EGLD vs NEAR: A Comprehensive Comparison of Two Leading Layer-1 Blockchain Platforms
Introduction: EGLD vs NEAR Investment Comparison
In the cryptocurrency market, the comparison between MultiversX (EGLD) and NEAR Protocol (NEAR) remains a topic that investors cannot overlook. The two projects not only exhibit significant differences in market capitalization ranking, application scenarios, and price performance, but also represent distinct positioning within the crypto asset landscape. MultiversX (EGLD): Since its launch, the project has gained market recognition by leveraging adaptive sharding technology and a Proof of Stake consensus mechanism to deliver a high-throughput public blockchain focused on security, efficiency, scalability, and interoperability. NEAR Protocol (NEAR): Established as a highly scalable base protocol designed to support decentralized application operation on mobile devices through state sharding, enabling linear expansion with network node growth and targeting 100k TPS based on 1 million mobile nodes. This article will conduct a comprehensive analysis of the investment value comparison between EGLD and NEAR across multiple dimensions, including historical price trends, supply mechanisms, ecosystem development, and market performance, while attempting to address the question most investors care about:
"Which is the better buy right now?"
Comparative Analysis Report: MultiversX (EGLD) and NEAR Protocol (NEAR)
I. Price History Comparison and Current Market Status
MultiversX (EGLD) and NEAR Protocol (NEAR) Historical Price Trends
MultiversX (EGLD):
- All-time high: USD 545.64 recorded on November 23, 2021
- All-time low: USD 5.48 recorded on October 11, 2025
- Long-term performance: The token has experienced a -85.36% decline over the past year
NEAR Protocol (NEAR):
- All-time high: USD 20.44 recorded on January 17, 2022
- All-time low: USD 0.526762 recorded on November 5, 2020
- Long-term performance: The token has experienced a -77.14% decline over the past year
Comparative Analysis: Both tokens have undergone significant corrections from their historical peaks. EGLD has declined from its ATH of USD 545.64 to current levels, representing a steeper absolute decline. NEAR has fallen from USD 20.44 to current trading levels, though both assets reflect broader market pressures experienced across the cryptocurrency sector during the observed period.
Current Market Status (December 17, 2025)
Price Data:
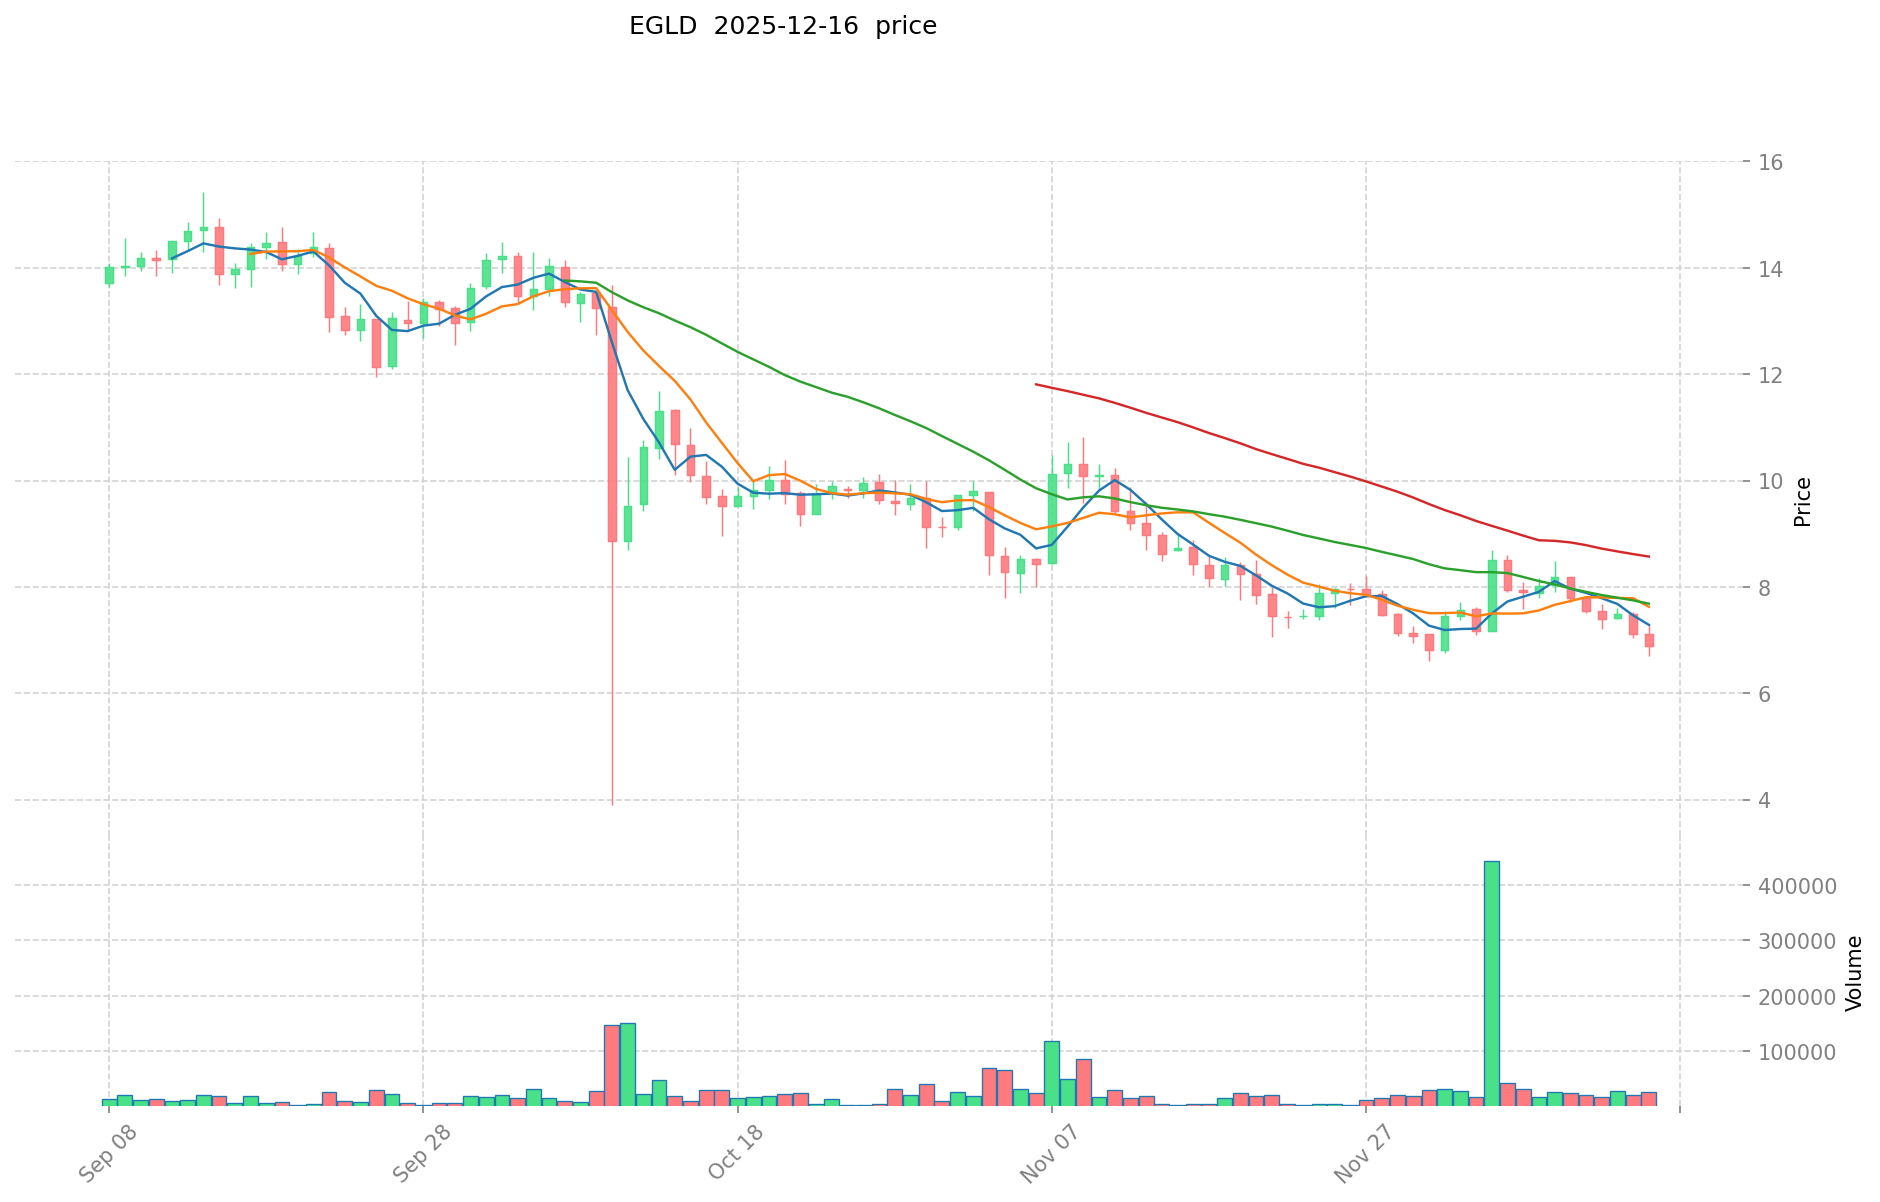
- EGLD current price: USD 6.91
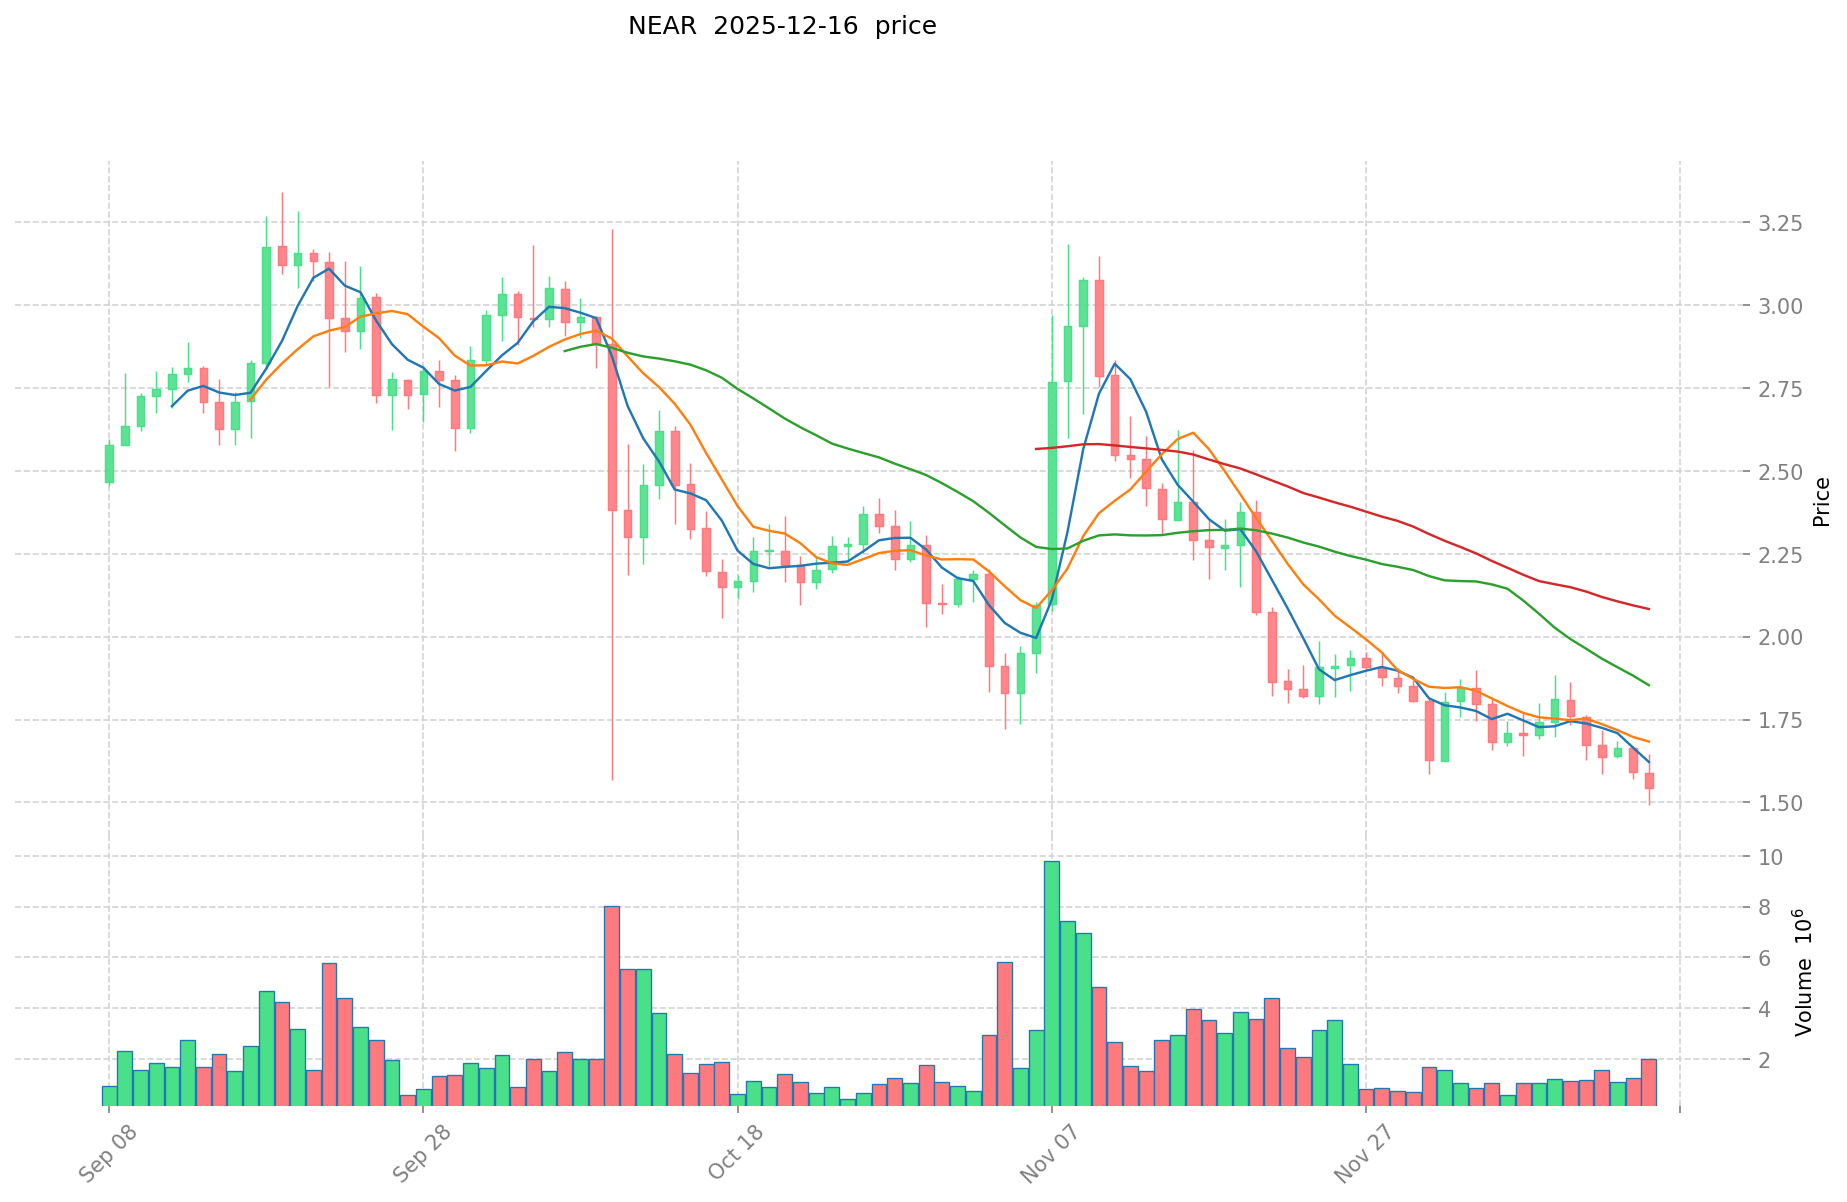
- NEAR current price: USD 1.559
24-Hour Trading Activity:
- EGLD 24-hour volume: USD 239,330.32
- NEAR 24-hour volume: USD 2,320,095.32
Market Sentiment Index (Fear & Greed Index): 11 (Extreme Fear)
View real-time prices:
II. Price Movement Analysis
Short-Term Price Fluctuations (Past 24 Hours)
EGLD Performance:
- 24-hour change: +1.31%
- 24-hour high: USD 7.014
- 24-hour low: USD 6.743
- Change amount: +USD 0.0894
NEAR Performance:
- 24-hour change: +2.95%
- 24-hour high: USD 1.6
- 24-hour low: USD 1.508
- Change amount: +USD 0.0447
1-Hour Movement:
- EGLD: -0.38% (down USD 0.0264)
- NEAR: +0.26% (up USD 0.0040)
Medium-Term Price Trends (7 Days and 30 Days)
7-Day Performance:
- EGLD: -16.7% (down USD 1.3853)
- NEAR: -15.85% (down USD 0.2936)
30-Day Performance:
- EGLD: -16.86% (down USD 1.4013)
- NEAR: -31.75% (down USD 0.7252)
Both tokens have experienced downward pressure over these intermediate timeframes, with NEAR showing more severe deterioration in the 30-day period.
III. Market Valuation Metrics
Market Capitalization and Supply
MultiversX (EGLD):
- Total market cap: USD 199,908,241.71
- Circulating supply: 28,930,281 EGLD
- Total supply: 28,930,281 EGLD
- Maximum supply: 31,415,926 EGLD
- Circulation ratio: 92.09%
- Market dominance: 0.0063%
NEAR Protocol (NEAR):
- Total market cap: USD 1,999,662,994.17
- Circulating supply: 1,282,657,469 NEAR
- Total supply: 1,282,657,455 NEAR
- Maximum supply: Unlimited (∞)
- Market dominance: 0.063%
NEAR holds approximately 10 times the market capitalization of EGLD, reflecting differences in investor positioning and market perception between these two protocols.
Fully Diluted Valuation (FDV)
- EGLD FDV: USD 199,908,241.71 (matching current market cap at 92.09% circulation)
- NEAR FDV: USD 1,999,662,972.35 (matching current market cap at 100% circulation)
IV. Protocol Architecture and Utility
MultiversX (EGLD)
EGLD is the native token of the MultiversX Network, representing a medium of exchange between users, developers, and validators. The token originated from the ERD (Elrond) upgrade, where 1,000 ERD tokens converted to 1 EGLD.
Key Technical Features:
- Adaptive sharding technology for network scalability
- Novel secure proof-of-stake consensus mechanism
- Focus on high-throughput transaction processing
Token Utility:
- Payment medium for network usage and transaction fees
- Validator compensation for providing computing and storage resources
- Network participation incentive structure
NEAR Protocol (NEAR)
NEAR Protocol is a highly scalable infrastructure protocol designed to support decentralized application deployment and execution on mobile devices.
Key Technical Features:
- State sharding technology enabling linear scalability with network node count
- Developer-friendly blockchain infrastructure
- Target specification: 100,000 TPS capacity based on 1 million mobile nodes
Token Utility:
- Payment for transaction fees within the network
- Validator compensation mechanism
- Network resource allocation (computing and storage)
- Governance participation through stake-based voting
V. Exchange Listing and Accessibility
MultiversX (EGLD):
- Listed on 41 exchanges
- Primary trading volume concentrated on major cryptocurrency platforms
- Published price (initial): USD 0.65
NEAR Protocol (NEAR):
- Listed on 59 exchanges
- Wider distribution across cryptocurrency trading platforms
- Published price (initial): USD 0.0375
NEAR demonstrates broader exchange coverage, indicating more extensive market accessibility and trading opportunities for participants.
VI. Community and Development Resources
MultiversX (EGLD)
Official Channels:
- Website: https://multiversx.com/
- Block Explorer: https://explorer.multiversx.com/
- White Paper: https://files.multiversx.com/multiversx-whitepaper.pdf
- GitHub: https://github.com/multiversx
- Twitter: https://twitter.com/MultiversX
- Community: https://www.reddit.com/r/elrondnetwork/
Token Holders: 9,142,085 addresses
NEAR Protocol (NEAR)
Official Channels:
- Website: https://near.org/
- Block Explorer: https://nearblocks.io/
- White Paper: https://near.org/papers/the-official-near-white-paper/
- GitHub: https://github.com/near, https://github.com/nearprotocol
- Twitter: https://twitter.com/nearprotocol
Token Holders: 43,961 addresses
VII. Summary and Market Context
As of December 17, 2025, both MultiversX (EGLD) and NEAR Protocol (NEAR) are trading within a market environment characterized by extreme fear sentiment. NEAR holds a significantly larger market capitalization (USD 2.0 billion vs. USD 200 million), though both tokens have experienced substantial long-term price depreciation from historical peaks.
In the immediate 24-hour period, both assets demonstrated modest positive momentum (+1.31% for EGLD and +2.95% for NEAR), contrasting with their concerning longer-term trajectories. The Fear & Greed Index reading of 11 suggests heightened market pessimism, which may present considerations for various market participants based on their individual investment horizons and risk assessments.
NEAR's broader exchange listing footprint (59 exchanges vs. 41 for EGLD) and substantially larger market capitalization indicate greater market penetration and liquidity accessibility. Both protocols maintain active development communities and clearly articulated technical architectures designed to address specific aspects of blockchain scalability and usability.
MultiversX (EGLD) Investment Analysis Report
II. Core Factors Influencing EGLD vs NEAR Investment Value
Supply Mechanism and Tokenomics
-
EGLD: As the native token of the Elrond blockchain network, EGLD serves as the core asset with economic incentive model design being critical to project success.
-
NEAR: The reference materials do not provide specific tokenomics details for comparison.
📌 Historical Pattern: Token supply mechanisms directly influence blockchain project viability through economic incentive model effectiveness. Projects with well-designed token economics demonstrate stronger long-term value retention.
Institutional Adoption and Market Applications
-
Institutional Holdings: The reference materials do not contain specific data comparing institutional preference between the two assets.
-
Enterprise Adoption:
- EGLD: MultiversX positions itself as a blockchain platform for the new internet economy, decentralized applications, and enterprise use.
- NEAR: The materials note NEAR's high scalability and support for decentralized applications, though specific enterprise adoption details are not provided.
-
Regulatory Environment: The reference materials do not include information regarding different countries' regulatory approaches to either asset.
Technology Development and Ecosystem Building
-
EGLD Technical Architecture:
- Implements state, network, and transaction sharding as the first blockchain network to do so
- Achieves transaction throughput of 15,000 TPS, significantly higher than Ethereum's 30 TPS
- Positions itself as a high-performance Layer 1 blockchain solution
-
NEAR Technical Development: The reference materials indicate high scalability capabilities and support for decentralized applications, though specific technical upgrade details are not provided.
-
Ecosystem Comparison:
- EGLD: Ecosystem includes MEX and RIDE projects
- General positioning: Both projects compete in DeFi and decentralized application sectors among Layer 1 public chains
Macroeconomic Factors and Market Cycles
-
Price Volatility: EGLD exhibits significant price fluctuations across different time periods and platforms, consistent with broader cryptocurrency market characteristics.
-
Monetary Policy Exposure: The reference materials do not contain specific analysis of how macroeconomic variables such as interest rates or USD index affect either asset.
-
Geopolitical Considerations: The materials do not address geopolitical factors influencing either EGLD or NEAR.
⚠️ Note: This analysis is based solely on provided reference materials. Significant gaps exist regarding NEAR's detailed characteristics, institutional adoption data, regulatory environment assessment, and macroeconomic impact analysis. Investment decisions should incorporate additional research and risk evaluation.
III. 2025-2030 Price Forecast: EGLD vs NEAR
Short-term Forecast (2025)
- EGLD: Conservative $6.15-$6.91 | Optimistic $9.68
- NEAR: Conservative $0.89-$1.56 | Optimistic $1.86
Mid-term Forecast (2026-2028)
- EGLD may enter a consolidation phase with growth potential, with prices ranging from $6.55 to $14.39, representing a 20-41% increase by 2027
- NEAR may experience gradual appreciation, with predicted price ranges from $1.21 to $2.32, showing a 9-21% gain through 2028
- Key drivers: Institutional capital inflows, spot/futures ETF approvals, ecosystem expansion and developer adoption
Long-term Forecast (2029-2030)
- EGLD: Base scenario $12.33-$15.90 | Optimistic scenario $15.90-$17.65
- NEAR: Base scenario $2.11-$2.80 | Optimistic scenario $2.46-$3.00
Disclaimer: This analysis is based on historical data modeling and market predictions. Cryptocurrency markets are highly volatile and unpredictable. Past performance does not guarantee future results. These forecasts should not be considered investment advice. Always conduct your own research and consult qualified financial advisors before making investment decisions. Market conditions, regulatory changes, and technological developments can significantly impact actual price movements.
EGLD:
| 年份 | 预测最高价 | 预测平均价格 | 预测最低价 | 涨跌幅 |
|---|---|---|---|---|
| 2025 | 9.6768 | 6.912 | 6.15168 | 0 |
| 2026 | 11.280384 | 8.2944 | 6.552576 | 20 |
| 2027 | 14.38746624 | 9.787392 | 5.28519168 | 41 |
| 2028 | 12.5709262848 | 12.08742912 | 10.878686208 | 74 |
| 2029 | 15.904639236096 | 12.3291777024 | 7.027631290368 | 78 |
| 2030 | 17.64613558656 | 14.116908469248 | 11.43469586009088 | 104 |
NEAR:
| 年份 | 预测最高价 | 预测平均价格 | 预测最低价 | 涨跌幅 |
|---|---|---|---|---|
| 2025 | 1.85521 | 1.559 | 0.88863 | 0 |
| 2026 | 1.79246025 | 1.707105 | 1.21204455 | 9 |
| 2027 | 2.04724567125 | 1.749782625 | 1.11986088 | 12 |
| 2028 | 2.3161872607125 | 1.898514148125 | 1.7846032992375 | 21 |
| 2029 | 2.802776436876937 | 2.10735070441875 | 1.222263408562875 | 35 |
| 2030 | 2.995177556190369 | 2.455063570647843 | 2.03770276363771 | 57 |
Comparative Investment Analysis Report: MultiversX (EGLD) vs NEAR Protocol (NEAR)
I. Price History Comparison and Current Market Status
Historical Price Trends
MultiversX (EGLD):
- All-time high: USD 545.64 (November 23, 2021)
- All-time low: USD 5.48 (October 11, 2025)
- 12-month performance: -85.36% decline
NEAR Protocol (NEAR):
- All-time high: USD 20.44 (January 17, 2022)
- All-time low: USD 0.526762 (November 5, 2020)
- 12-month performance: -77.14% decline
Comparative Analysis:
Both tokens have experienced significant corrections from historical peaks. EGLD has declined from USD 545.64 to current levels, while NEAR has fallen from USD 20.44 to current trading levels. Both assets reflect broader market pressures experienced across the cryptocurrency sector during the observed period.
Current Market Status (December 17, 2025)
Price Data:
- EGLD current price: USD 6.91
- NEAR current price: USD 1.559
Trading Volume (24-hour):
- EGLD: USD 239,330.32
- NEAR: USD 2,320,095.32
Market Sentiment: Fear & Greed Index at 11 (Extreme Fear)
Current market conditions reflect heightened pessimism across the cryptocurrency sector, presenting varied implications for different investor profiles.
II. Price Movement Analysis
Short-Term Performance (24 Hours)
EGLD:
- 24-hour change: +1.31%
- 24-hour range: USD 6.743 - USD 7.014
- 1-hour change: -0.38%
NEAR:
- 24-hour change: +2.95%
- 24-hour range: USD 1.508 - USD 1.6
- 1-hour change: +0.26%
Medium-Term Performance
7-Day Trends:
- EGLD: -16.7% (down USD 1.3853)
- NEAR: -15.85% (down USD 0.2936)
30-Day Trends:
- EGLD: -16.86% (down USD 1.4013)
- NEAR: -31.75% (down USD 0.7252)
Both tokens have experienced downward pressure over intermediate timeframes, with NEAR demonstrating more severe deterioration in the 30-day period.
III. Market Valuation Metrics
Market Capitalization and Supply Analysis
MultiversX (EGLD):
- Total market cap: USD 199,908,241.71
- Circulating supply: 28,930,281 EGLD
- Total supply: 28,930,281 EGLD
- Maximum supply: 31,415,926 EGLD
- Circulation ratio: 92.09%
- Market dominance: 0.0063%
NEAR Protocol (NEAR):
- Total market cap: USD 1,999,662,994.17
- Circulating supply: 1,282,657,469 NEAR
- Total supply: 1,282,657,455 NEAR
- Maximum supply: Unlimited (∞)
- Market dominance: 0.063%
NEAR maintains approximately 10 times the market capitalization of EGLD, reflecting differing investor positioning and market perception between these protocols.
Community Size and Engagement
MultiversX (EGLD):
- Total token holders: 9,142,085 addresses
NEAR Protocol (NEAR):
- Total token holders: 43,961 addresses
EGLD demonstrates significantly broader token holder distribution, indicating more extensive community participation despite lower overall market capitalization.
IV. Protocol Architecture and Utility
MultiversX (EGLD)
Technical Foundation:
- Native token of MultiversX Network
- Implements adaptive sharding technology
- Novel secure proof-of-stake consensus mechanism
Token Utility:
- Payment medium for network transactions and fees
- Validator compensation mechanism
- Network participation incentive structure
- Resource allocation for computing and storage
NEAR Protocol (NEAR)
Technical Foundation:
- Scalable infrastructure protocol for decentralized applications
- State sharding technology enabling linear scalability
- Target capacity: 100,000 TPS based on 1 million mobile nodes
- Designed for mobile device deployment support
Token Utility:
- Transaction fee payment
- Validator compensation mechanism
- Network resource allocation (computing and storage)
- Governance participation through stake-based voting
V. Exchange Listing and Market Accessibility
MultiversX (EGLD):
- Listed on 41 exchanges
- Limited but established trading infrastructure
NEAR Protocol (NEAR):
- Listed on 59 exchanges
- Broader market accessibility across trading platforms
NEAR demonstrates more extensive exchange coverage, providing greater trading opportunities and accessibility for market participants.
VI. Investment Strategy Comparison: EGLD vs NEAR
Long-Term vs. Short-Term Investment Strategies
EGLD:
- Suitable for investors focused on blockchain scalability innovations and native token appreciation potential
- Technical advancement believers seeking exposure to adaptive sharding implementations
- Investors with conviction in enterprise blockchain adoption narratives
NEAR:
- Suitable for investors seeking broader market liquidity and accessibility
- Participants targeting mobile-first blockchain infrastructure potential
- Investors prioritizing ecosystem expansion in emerging markets
Risk Management and Asset Allocation
Conservative Investor Profile:
- EGLD: 30% vs. NEAR: 70%
- Rationale: Higher liquidity and broader exchange coverage in NEAR provides greater downside protection
Aggressive Investor Profile:
- EGLD: 60% vs. NEAR: 40%
- Rationale: EGLD's smaller market cap presents higher growth potential volatility
Hedging Instruments:
- Stablecoin allocation to manage volatility exposure
- Cross-asset portfolio diversification across Layer 1 protocols
- Position sizing relative to overall portfolio risk tolerance
VII. Potential Risks Comparison
Market Risk
EGLD:
- Severe historical price depreciation (-85.36% over 12 months) indicates substantial volatility
- Lower trading volume (USD 239K daily) may limit exit liquidity during market stress
- Smaller market capitalization (USD 200M) increases susceptibility to whale-driven price movements
NEAR:
- Significant long-term price decline (-77.14% over 12 months) reflects broader market headwinds
- More robust trading volume (USD 2.32M daily) provides superior liquidity conditions
- Larger market capitalization offers relative stability but does not eliminate downside exposure
Technical Risk
EGLD:
- Adaptive sharding implementation complexity may present unforeseen scalability challenges
- Network stability dependent on validator participation maintenance
NEAR:
- State sharding architecture requires rigorous security auditing and testing
- Mobile device deployment introduces distinctive security considerations
- Unlimited token supply creates potential long-term inflationary pressure
Regulatory Risk
Reference materials do not provide specific regulatory environment assessment for either asset. Both projects operate within evolving global cryptocurrency regulatory frameworks where policy changes could impact token utility and market valuation.
VIII. Price Forecast Analysis: 2025-2030
Short-Term Forecast (2025)
EGLD:
- Conservative range: USD 6.15 - USD 6.91
- Optimistic scenario: USD 9.68
NEAR:
- Conservative range: USD 0.89 - USD 1.56
- Optimistic scenario: USD 1.86
Medium-Term Forecast (2026-2028)
EGLD:
- Predicted range: USD 6.55 - USD 14.39
- Potential appreciation: 20-41% by 2027
NEAR:
- Predicted range: USD 1.21 - USD 2.32
- Potential appreciation: 9-21% through 2028
Key drivers identified: Institutional capital inflows, spot/futures ETF approvals, ecosystem expansion, and developer adoption initiatives.
Long-Term Forecast (2029-2030)
EGLD:
- Base scenario: USD 12.33 - USD 15.90
- Optimistic scenario: USD 15.90 - USD 17.65
NEAR:
- Base scenario: USD 2.11 - USD 2.80
- Optimistic scenario: USD 2.46 - USD 3.00
IX. Conclusion: Which Is the Better Buy?
Investment Value Summary
EGLD Advantages:
- Broader community engagement (9.1M token holders) indicating strong grassroots support
- Higher individual token appreciation potential given lower market capitalization
- Technical differentiation through adaptive sharding implementation
- Nearer to full token circulation (92.09%), reducing future dilution risk
NEAR Advantages:
- Substantially larger market capitalization (USD 2.0B) providing greater price stability
- Superior trading liquidity (59 exchange listings, USD 2.32M daily volume) enabling efficient position management
- Mobile-first infrastructure positioning addresses emerging market opportunity
- Diversified governance participation mechanisms
Investment Recommendations
Beginner Investors:
- Prioritize NEAR due to superior liquidity, broader exchange availability, and established market infrastructure
- Begin with smaller positions reflecting extreme fear market sentiment
- Implement dollar-cost averaging strategy to mitigate timing risk
Experienced Investors:
- Consider EGLD exposure for potential higher growth returns given lower market capitalization
- Maintain diversified positions across both assets reflecting differing risk-return profiles
- Implement technical analysis-based entry/exit strategies accounting for extreme volatility
- Evaluate relative value based on ecosystem development catalysts and regulatory environment shifts
Institutional Investors:
- NEAR presents more suitable characteristics for institutional allocation given market depth and liquidity
- EGLD may merit smaller allocation reflecting higher risk exposure and limited trading infrastructure
- Both assets warrant comprehensive due diligence on tokenomics, governance structures, and regulatory compliance frameworks
Investment Verdict
Neither asset demonstrates clear superiority across all evaluation dimensions. Selection between EGLD and NEAR depends on individual investment objectives, risk tolerance, and time horizons:
- Growth-oriented investors may favor EGLD's lower market capitalization but must accept elevated volatility
- Stability-focused investors should prioritize NEAR's established market infrastructure and liquidity
- Balanced approaches warrant diversified exposure reflecting complementary technical architectures
⚠️ Risk Disclaimer: Cryptocurrency markets exhibit extreme volatility and unpredictability. Past performance does not guarantee future results. These forecasts and analyses should not be considered investment advice. Price predictions are based on historical data modeling and remain subject to significant error. Market conditions, regulatory changes, technological developments, and macroeconomic factors can substantially impact actual price movements. Always conduct independent research and consult qualified financial advisors before making investment decisions. Never invest capital you cannot afford to lose entirely. None
FAQ: MultiversX (EGLD) vs NEAR Protocol (NEAR) Investment Comparison
I. What are the current price levels and market caps for EGLD and NEAR as of December 17, 2025?
Answer: EGLD is trading at USD 6.91 with a market capitalization of USD 199.9 million, while NEAR is trading at USD 1.559 with a market capitalization of USD 2.0 billion. NEAR holds approximately 10 times the market cap of EGLD. Both tokens show modest 24-hour gains (EGLD +1.31%, NEAR +2.95%) despite operating within an extreme fear market sentiment environment (Fear & Greed Index: 11).
II. How have EGLD and NEAR performed over the past 12 months?
Answer: Both tokens have experienced significant long-term price depreciation. EGLD declined -85.36% over the past year, falling from its all-time high of USD 545.64 (November 2021) to current levels around USD 6.91. NEAR declined -77.14% over the same period, dropping from its all-time high of USD 20.44 (January 2022) to USD 1.559. This severe correction reflects broader cryptocurrency market pressures affecting the sector during the observed timeframe.
III. What are the key technical differences between MultiversX and NEAR Protocol?
Answer: MultiversX (EGLD) implements adaptive sharding technology combined with a secure proof-of-stake consensus mechanism, achieving 15,000 TPS throughput. NEAR Protocol utilizes state sharding technology enabling linear scalability with network growth, targeting 100,000 TPS capacity based on 1 million mobile nodes. NEAR emphasizes mobile-first infrastructure for decentralized applications, while MultiversX positions itself as a high-performance Layer 1 solution for the broader economy.
IV. Which token has better liquidity and market accessibility?
Answer: NEAR Protocol demonstrates superior market accessibility with 59 exchange listings compared to EGLD's 41 exchange listings. NEAR also shows significantly higher daily trading volume at USD 2.32 million versus EGLD's USD 239,330. This broader exchange coverage and superior liquidity make NEAR more suitable for investors prioritizing efficient position entry and exit capabilities during volatile market conditions.
V. What are the differences in token supply and circulation between EGLD and NEAR?
Answer: EGLD has a maximum supply of 31,415,926 tokens with current circulation of 28,930,281 (92.09% circulated), minimizing future dilution risk. NEAR has unlimited maximum supply with 1,282,657,469 circulating tokens. EGLD's defined supply cap provides greater tokenomics predictability, while NEAR's unlimited supply structure creates potential long-term inflationary pressure but offers flexibility for ecosystem development and validator compensation.
VI. Which asset demonstrates stronger community engagement?
Answer: EGLD demonstrates significantly broader community participation with 9,142,085 token holders across multiple addresses, compared to NEAR's 43,961 token holders. Despite NEAR's larger market capitalization, EGLD's substantially higher holder count indicates extensive grassroots community engagement and distributed token ownership. This broader holder base may reflect stronger long-term community conviction in the project's technical vision.
VII. What investment strategy is recommended for different investor profiles?
Answer: Conservative investors should prioritize NEAR due to superior liquidity, broader exchange availability, and larger market capitalization providing relative stability. Experienced investors may consider EGLD exposure for higher growth potential despite elevated volatility. Aggressive investors could allocate 60% EGLD and 40% NEAR for higher risk-return profiles. Institutional investors should favor NEAR given market depth and infrastructure, with EGLD as a smaller tactical allocation. Individual investor selection depends on risk tolerance, investment horizon, and specific portfolio objectives.
VIII. What are the price forecasts for EGLD and NEAR through 2030?
Answer: Short-term (2025): EGLD conservative range USD 6.15-6.91, optimistic USD 9.68; NEAR conservative range USD 0.89-1.56, optimistic USD 1.86. Medium-term (2026-2028): EGLD predicted range USD 6.55-14.39 (20-41% appreciation); NEAR predicted range USD 1.21-2.32 (9-21% appreciation). Long-term (2029-2030): EGLD base scenario USD 12.33-15.90; NEAR base scenario USD 2.11-2.80. Key drivers include institutional capital inflows, ETF approvals, ecosystem expansion, and developer adoption. These forecasts are based on historical modeling and carry substantial uncertainty in highly volatile cryptocurrency markets.
⚠️ Disclaimer: This analysis is provided for informational purposes only and does not constitute investment advice. Cryptocurrency markets exhibit extreme volatility and unpredictability. Past performance does not guarantee future results. Always conduct independent research and consult qualified financial advisors before making investment decisions. Never invest capital you cannot afford to lose entirely.
Share
How to Buy Cryptocurrency


Trending Cryptocurrencies


XZXX: A Comprehensive Guide to the BRC-20 Meme Token in 2025

Bitcoin Fear and Greed Index: Market Sentiment Analysis for 2025

Top Crypto ETFs to Watch in 2025: Navigating the Digital Asset Boom

5 ways to get Bitcoin for free in 2025: Newbie Guide

Bitcoin Market Cap in 2025: Analysis and Trends for Investors

2025 Bitcoin Price Prediction: Trump's Tariffs' Impact on BTC

Dropee Daily Combo for 17 december 2025
Discover How to Evaluate NFT Rarity Effectively
Is Threshold (T) a good investment? A Comprehensive Analysis of Tokenomics, Market Performance, and Future Potential in the Blockchain Infrastructure Sector
Is AWE Network (AWE) a good investment?: A Comprehensive Analysis of Performance, Risk Factors, and Future Potential in the Cryptocurrency Market

Is Unibase (UB) a good investment?: A Comprehensive Analysis of Its Market Potential, Risk Factors, and Future Prospects