Trade
Trading Type
Spot
Trade crypto freely
Alpha
Points
Get promising tokens in streamlined on-chain trading
Pre-Market
Trade new tokens before they are officially listed
Margin
Magnify your profit with leverage
Convert & Block Trading
0 Fees
Trade any size with no fees and no slippage
Leveraged Tokens
Get exposure to leveraged positions simply
Futures
Futures
Hundreds of contracts settled in USDT or BTC
Options
HOT
Trade European-style vanilla options
Unified Account
Maximize your capital efficiency
Demo Trading
Futures Kickoff
Get prepared for your futures trading
Futures Events
Participate in events to win generous rewards
Demo Trading
Use virtual funds to experience risk-free trading
Earn
Launch
Investment
Simple Earn
VIP
Earn interests with idle tokens
Auto-Invest
Auto-invest on a regular basis
Dual Investment
Buy low and sell high to take profits from price fluctuations
Quant Fund
VIP
Top asset management team helps you profit without hassle
Crypto Loan
0 Fees
Pledge one crypto to borrow another
Lending Center
One-Stop Lending Hub
VIP Wealth Hub
New
Customized wealth management empowers your assets growth
Private Wealth Management
Customized asset management to grow your digital assets
Staking
Stake cryptos to earn in PoS products
BTC Staking
HOT
Stake BTC and earn 10% APR
GUSD Minting
New
Use USDT/USDC to mint GUSD for treasury-level yields
Soft Staking
Earn rewards with flexible staking
More


Power777
No content yet
Power777
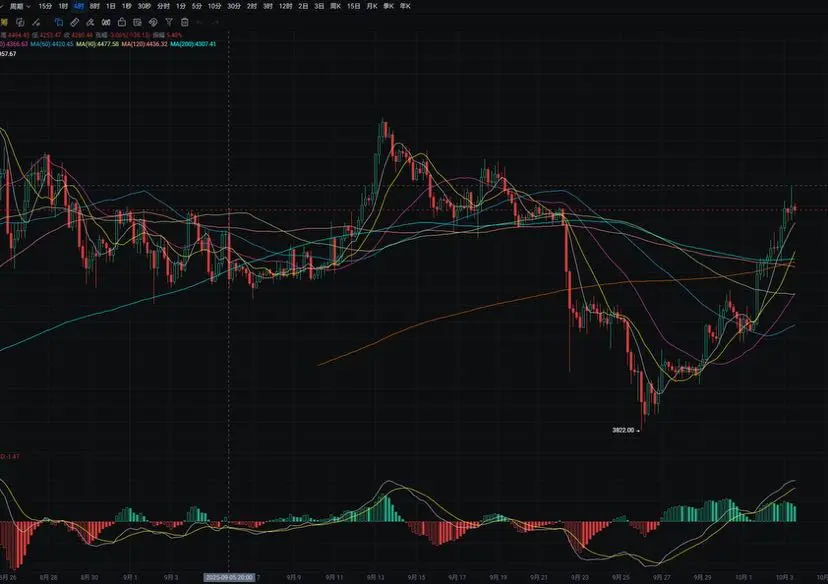
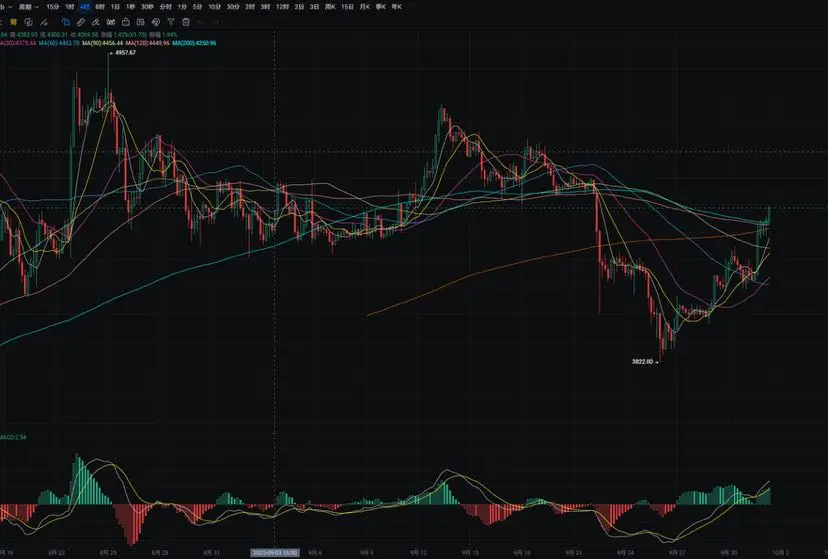
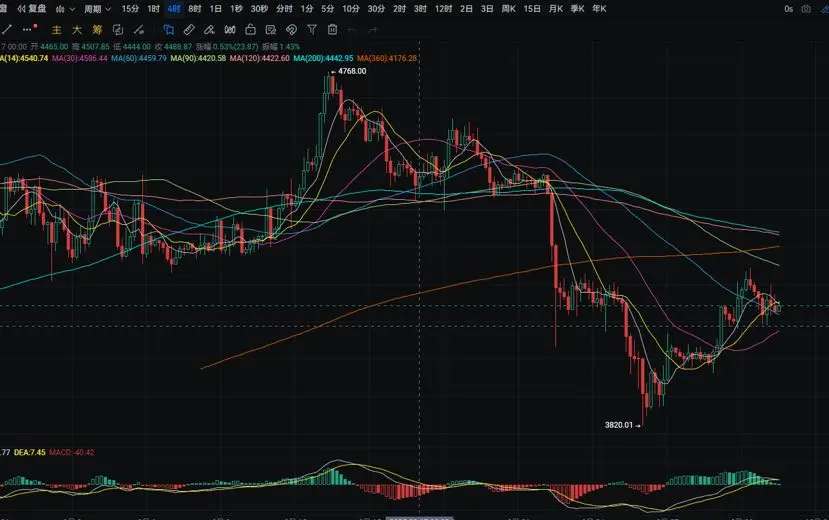
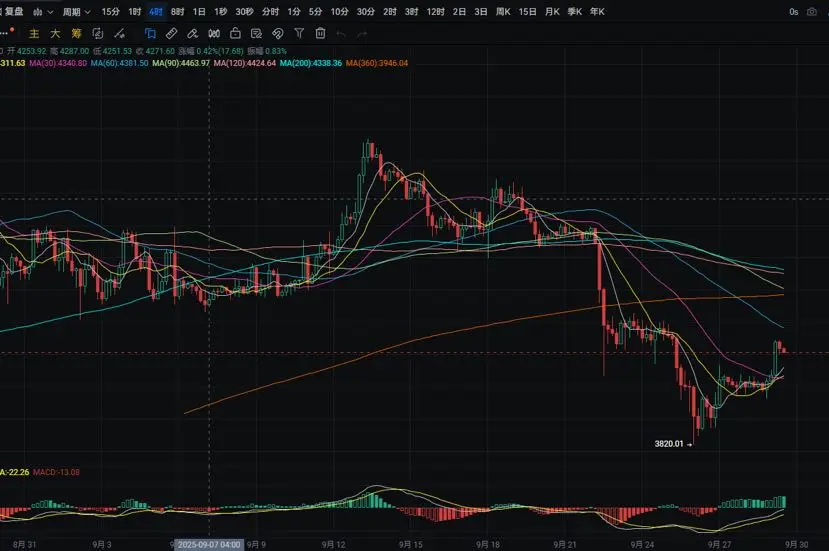
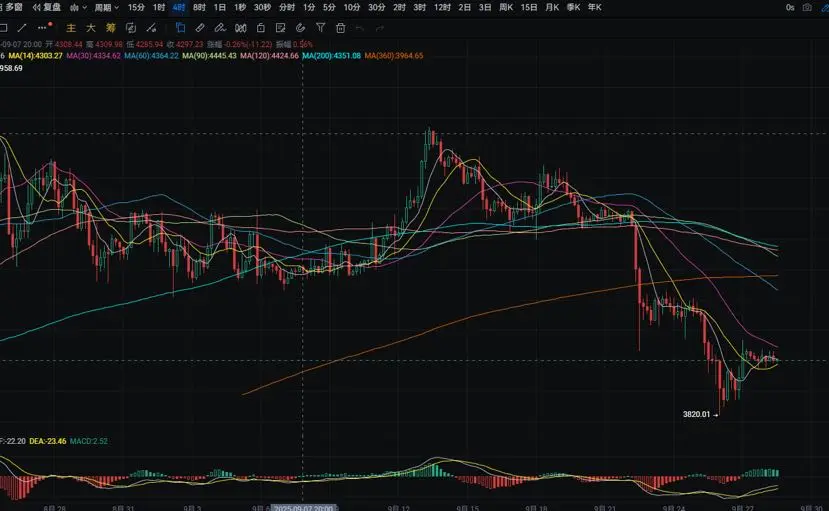
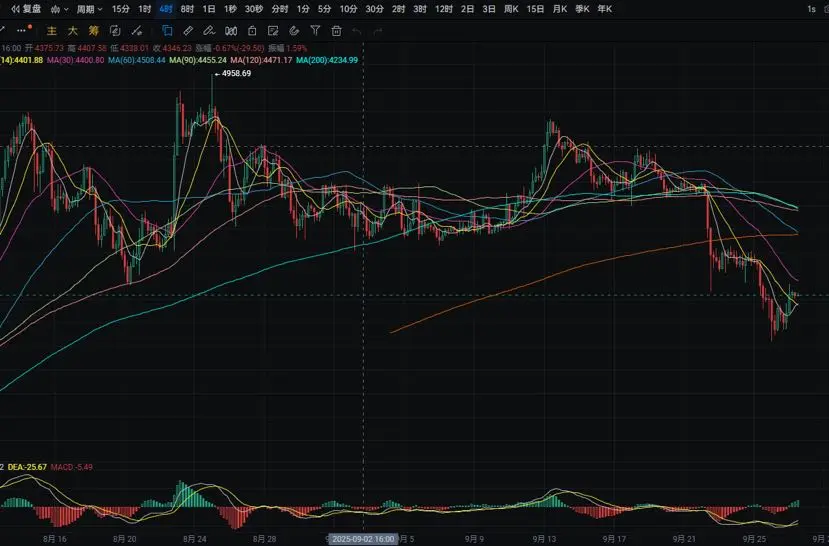
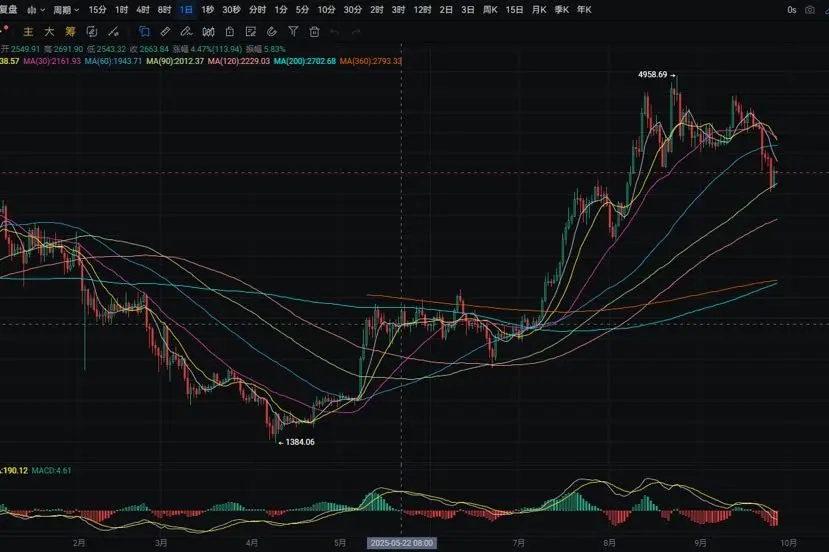
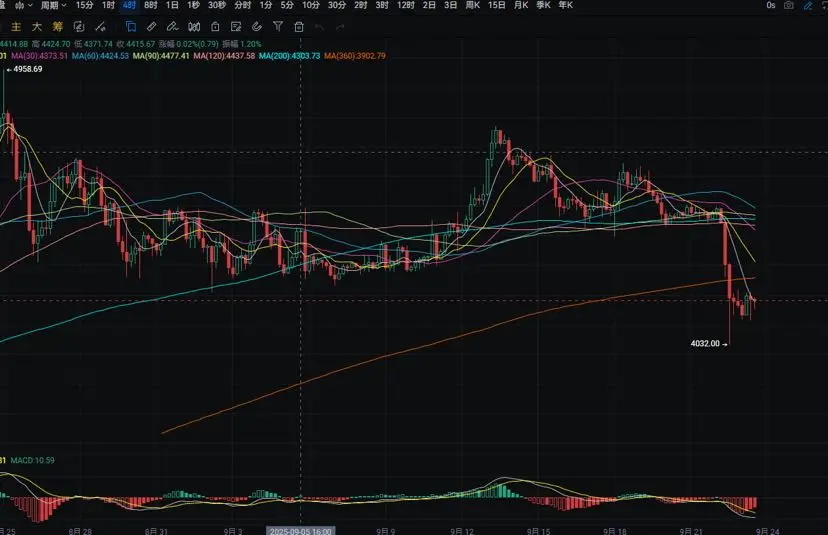
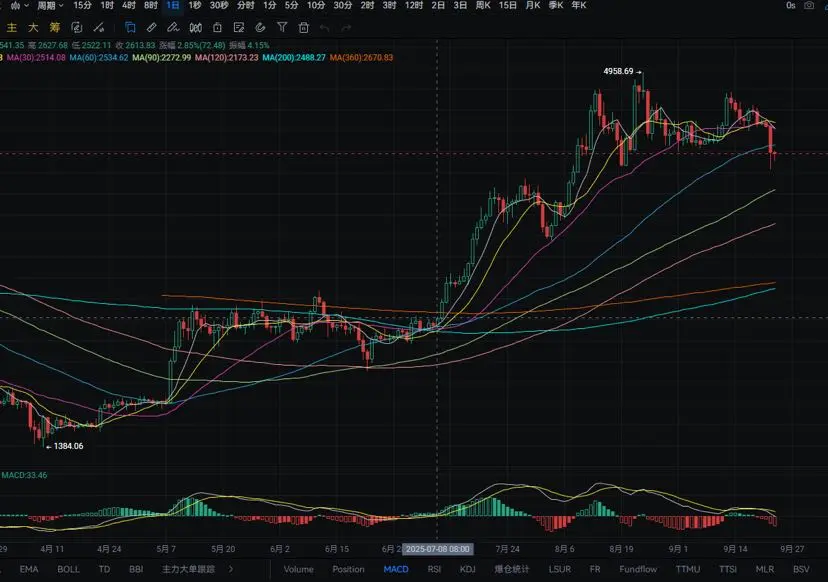
The Ether daily chart yesterday rose from a low of around 4330 to a high of around 4515, closing around 4480. The support level is around MA30; if it breaks down, it can be seen at around MA14. A pullback can be used to enter long positions nearby. The resistance level is around 4590; if it breaks through, it can be seen at around 4715. A rebound to the vicinity can be used to enter short positions. The MACD shows an increase in long positions, forming a golden cross pattern. On the four-hour chart, the support level is around MA14; if it breaks down, it can be seen at around 4290. A pullback
ETH0.31%
- Reward
- 1
- 2
- Repost
- Share
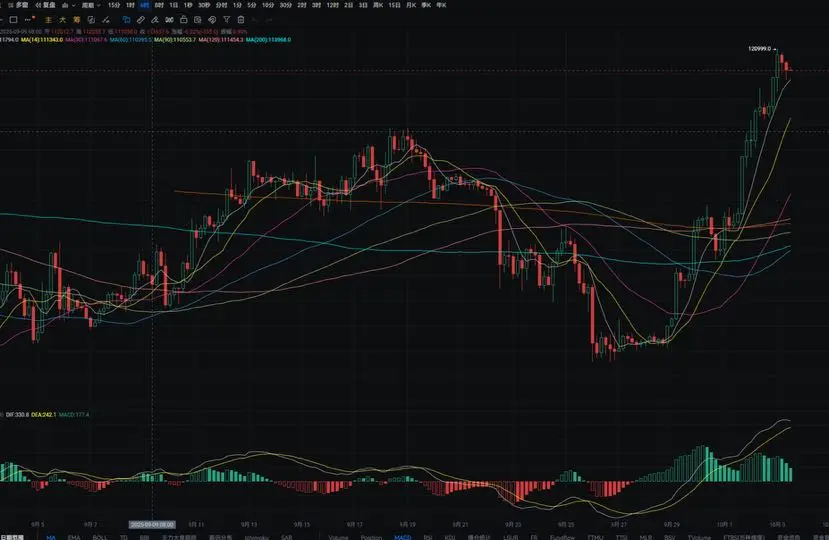
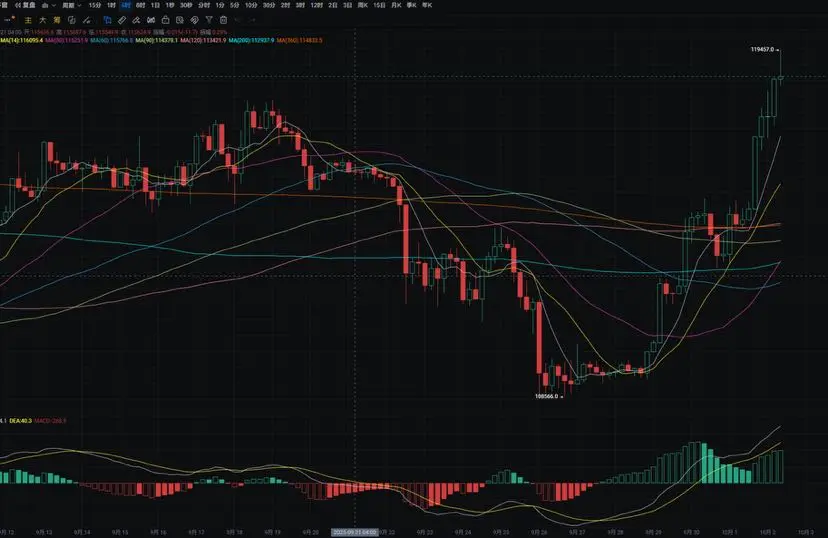
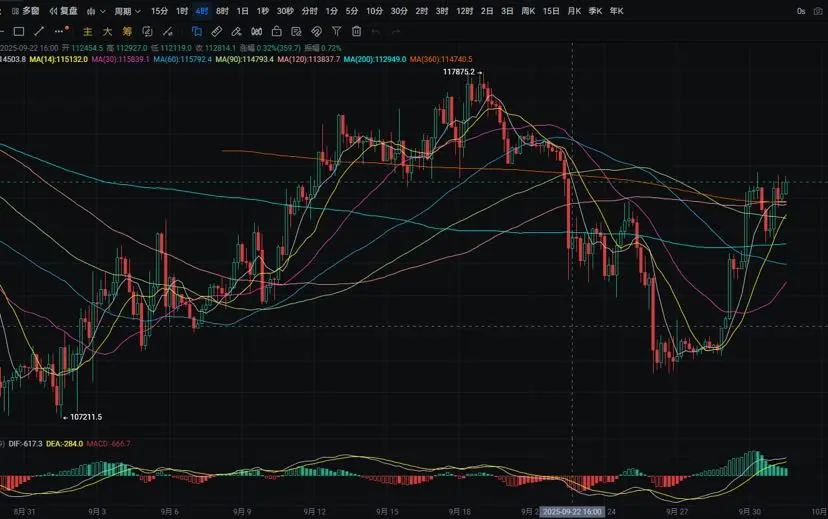
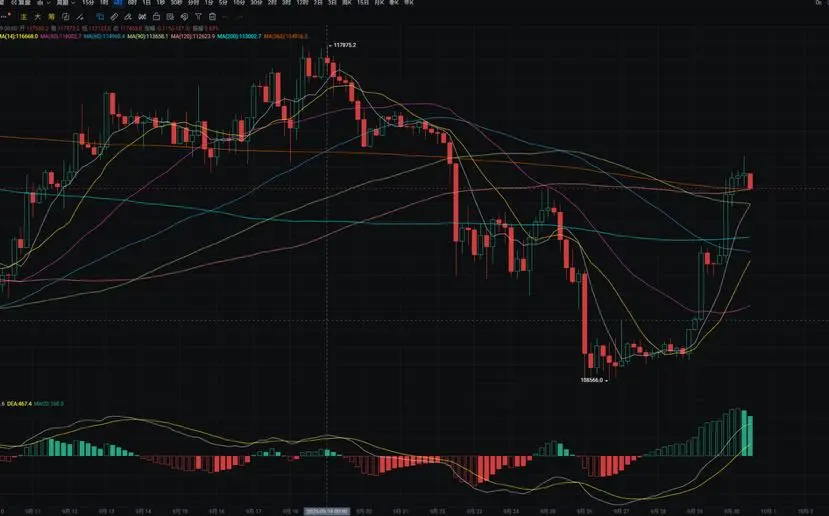
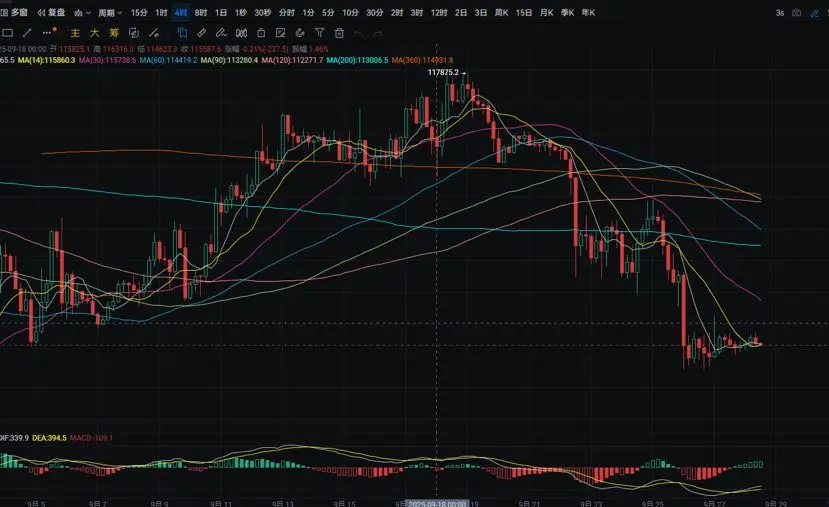
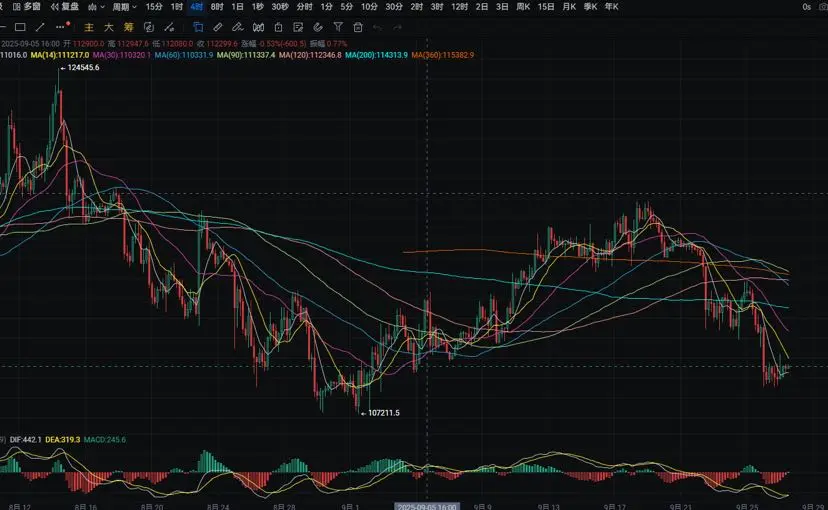
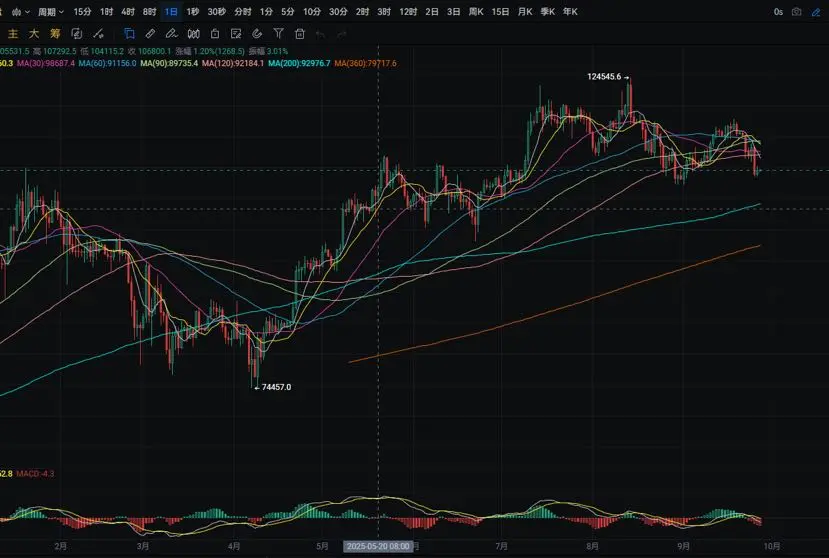
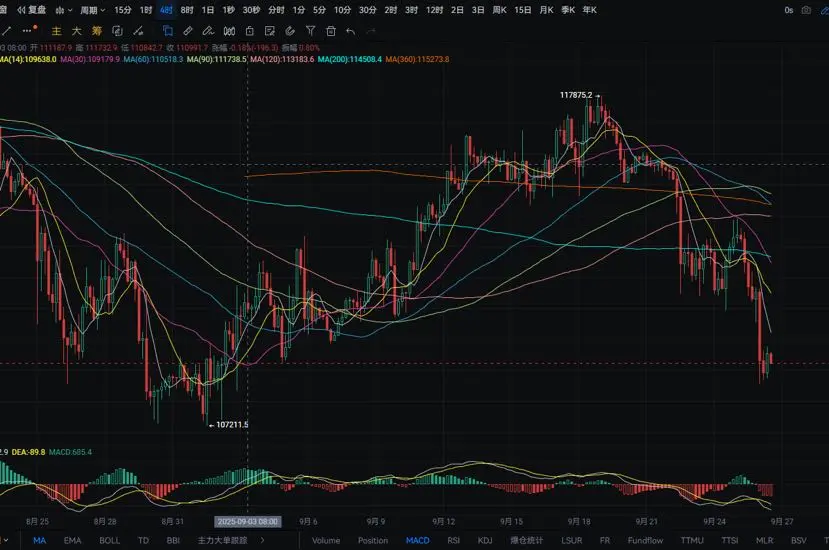
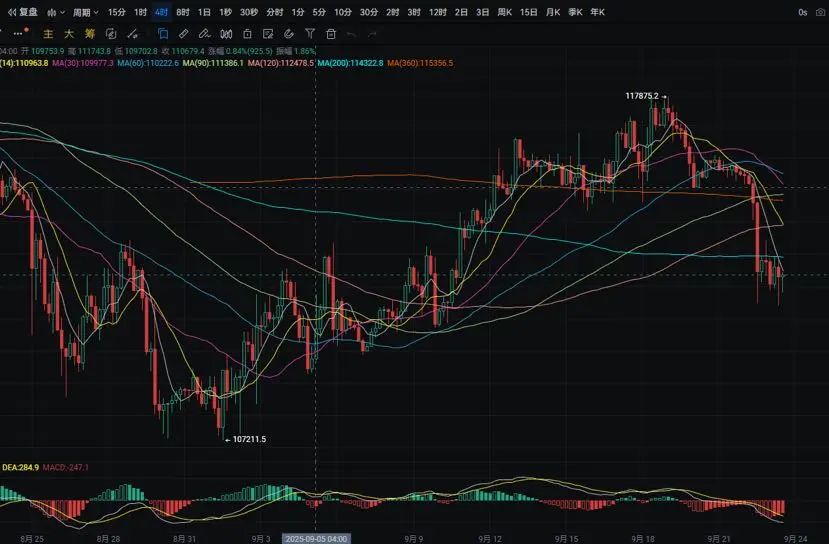
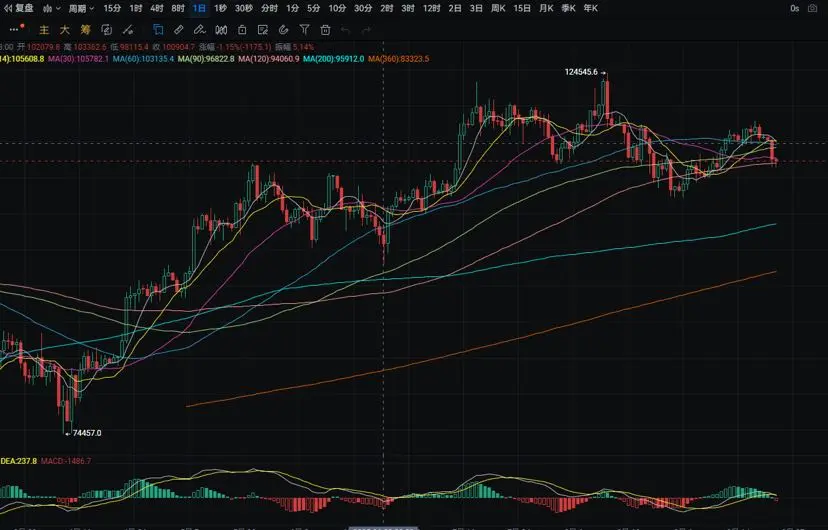
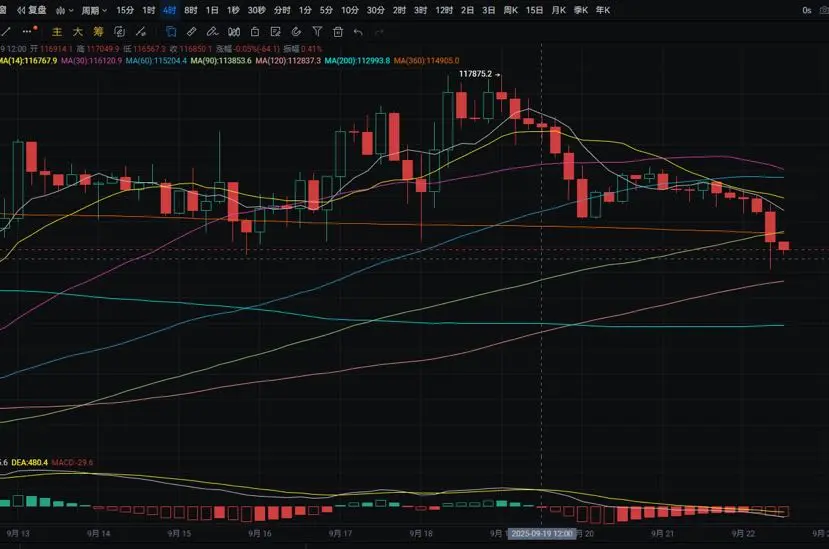
The BTC daily chart yesterday rose from a low of around 118250 to a high of around 121000, closing at around 120500. The support level is around 117400; if it falls below this, we could see it near the MA7 moving average. A pullback can be taken to enter long positions nearby. The resistance level is around 121400; if it breaks through, we can look towards approximately 123350. A rebound to the vicinity can be used to enter short positions. The MACD shows an increase in long positions. On the four-hour chart, the support is around the MA14; if it falls below this, we could see it near 116750.
BTC1.55%
- Reward
- like
- Comment
- Repost
- Share
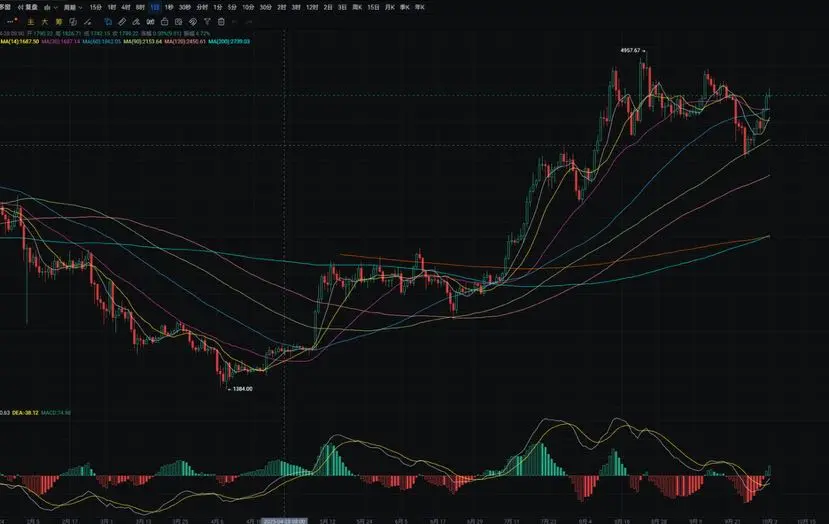
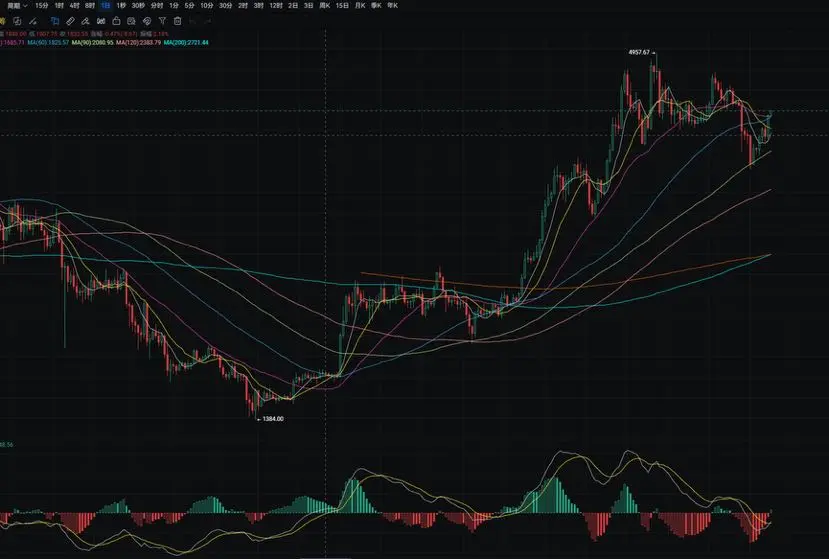
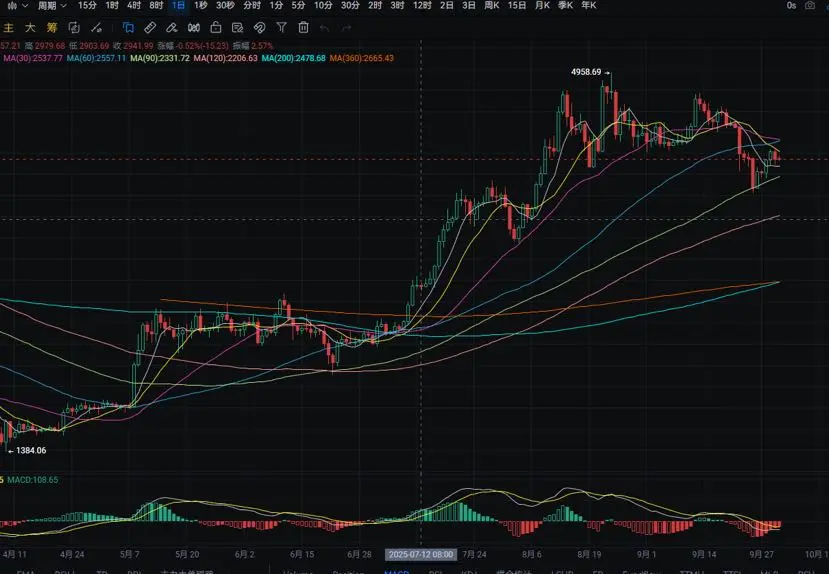
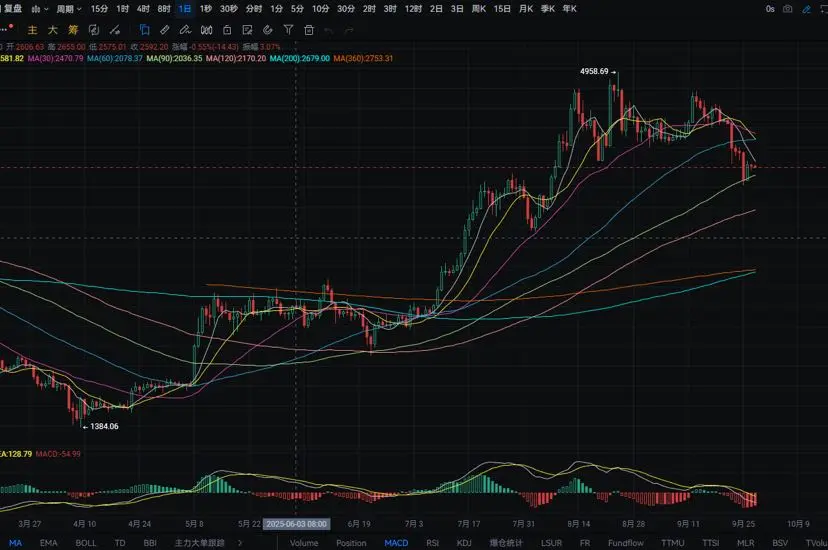
The Ether daily chart yesterday rose from a low of around 4120 to a high of around 4355, closing at around 4345. The support level is at MA14; a break below this could see a drop to around 4075. A pullback can be used to enter long positions nearby. The resistance level is at around 4500; a breakthrough could see a rise to around 4590. A rebound to nearby can be used to enter short positions. MACD shows a decrease in short positions, with signs of a golden cross pattern forming. On the four-hour chart, the support level is at MA90; a break below this could see a drop to around MA30. A pullback
ETH0.31%
- Reward
- 1
- Comment
- Repost
- Share
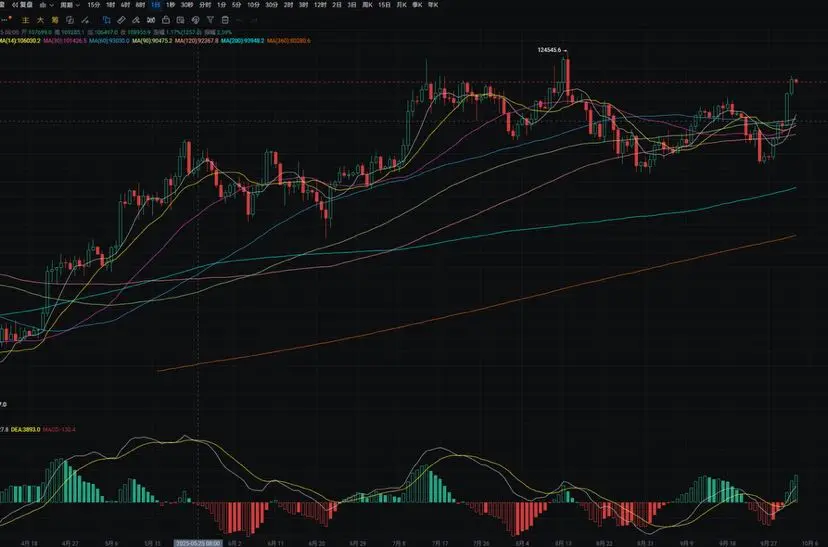
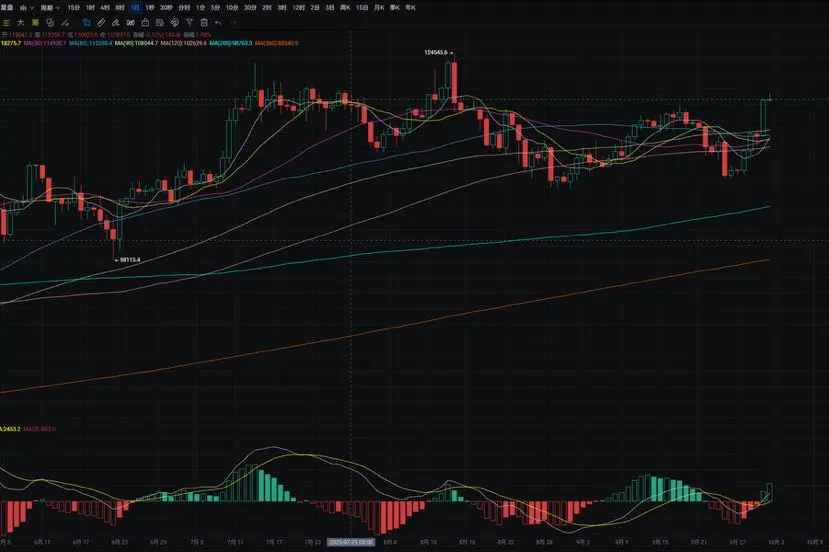
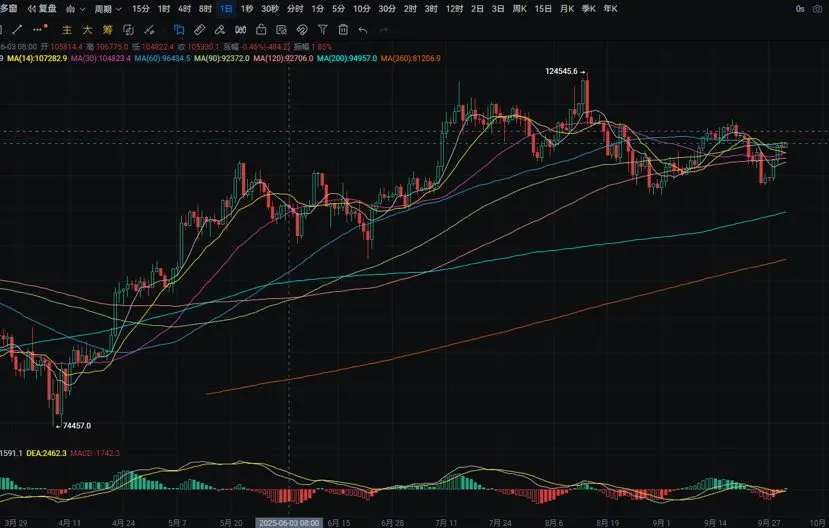
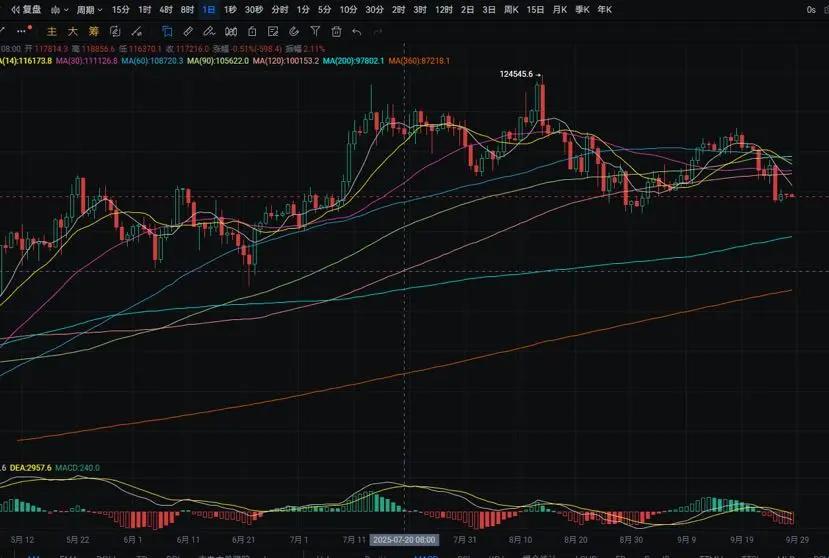
BTC daily chart yesterday rose from a low of around 113900 to a high of around 118650, closing near 118550. The support level is around 117000; if it breaks below, we could see a move towards the MA90 level. A pullback could allow for long positions near this area. The resistance level is around 120000; if this is broken, we could see a move towards 121500. MACD shows an increase in long positions, forming a golden cross pattern. On the four-hour chart, the support level is around 117350; if it breaks below, we could see a move towards 115850. A pullback could allow for long positions near thi
BTC1.55%
- Reward
- like
- Comment
- Repost
- Share
Ether daily chart yesterday fell from around the highest 4245 to the lowest around 4090, closing near 4145. The support level is near the MA7 moving average. If it breaks down, we could look to the MA90 nearby. A rebound could be an opportunity to enter long positions in the vicinity. The resistance level is near the MA30. If it breaks through, we could look to around 4440. A rebound to the vicinity could be an opportunity to enter short positions. MACD shows a decrease in short positions. The four-hour chart's support level is near the MA30. If it breaks down, we could look to around 4000
ETH0.31%
- Reward
- like
- Comment
- Repost
- Share
The daily chart of BTC fell from around 114800 yesterday to a low of around 112600, closing around 114000. The support level is near MA30; if it breaks, we could look towards around 111150. A pullback could be a good opportunity to take long positions. The resistance level is near 115950; if it breaks, we could look towards around 117550. A rebound to this area could be a chance to take short positions. MACD shows a decrease in short positions. The support level on the four-hour chart is near MA90; if it breaks, we could look towards MA200. A pullback could be a good opportunity to take long p
BTC1.55%
- Reward
- like
- Comment
- Repost
- Share
The BTC daily chart rose from around 111500 yesterday to a high of around 114400, closing near 114250. The support level is near MA120, and if it breaks down, it could drop to around 110000. A pullback can be used to enter long positions nearby. The resistance level is around 116000; if it breaks, we could see around 117100. A rebound to nearby levels can be used to enter short positions. MACD shows a decrease in short positions, indicating signs of a golden cross pattern. On the four-hour chart, the support is around 113250; if it breaks, it could drop to near MA60. A pullback can be used to
BTC1.55%
- Reward
- like
- Comment
- Repost
- Share
The Ether daily chart rose from a low of around 3965 to a high of around 4145 yesterday, closing at around 4140. The support level is near MA90; if it breaks, it could drop to around 3870. A pullback could be an opportunity to enter long positions nearby. The resistance level is at MA14; if it breaks, it could rise to around 4450. A rebound nearby could be an opportunity to enter short positions. The MACD shows a decrease in short positions. On the four-hour chart, the support level is at MA30; if it breaks, it could drop to around 3905. A pullback could be an opportunity to enter long positio
ETH0.31%
- Reward
- 1
- 1
- Repost
- Share
GateUser-5d236937:
Hello buddyThe Ether daily chart fell from around 4035 yesterday to a low of around 3970, with a closing price near 4015. The support level is around 3905; if it breaks, we can look for a target around 3750. A bounce back can be taken for long positions nearby. The resistance level is at 4150; if it breaks, we can look for a target near the MA60. A rebound to the vicinity can be taken for short positions. The MACD shows decreasing short positions. On the four-hour chart, the support level is around 3940; if it breaks, we can look for a target around 3865. A bounce back can be taken for long positions nea
ETH0.31%
- Reward
- like
- Comment
- Repost
- Share
The BTC daily chart yesterday fell from a high of around 109700 to a low of around 109000, closing at around 109600. The support level is around 108100, and if it breaks, it can be seen at around 106750. A pullback can be used to enter long positions nearby. The resistance level is around 111150, and if it breaks, it can be seen near MA14. A rebound nearby can be used to enter short positions. The MACD shows an increase in short positions. On the four-hour chart, the support level is around 108700, and if it breaks, it can be seen at around 107600. A pullback can be used to enter long position
BTC1.55%
- Reward
- like
- Comment
- Repost
- Share
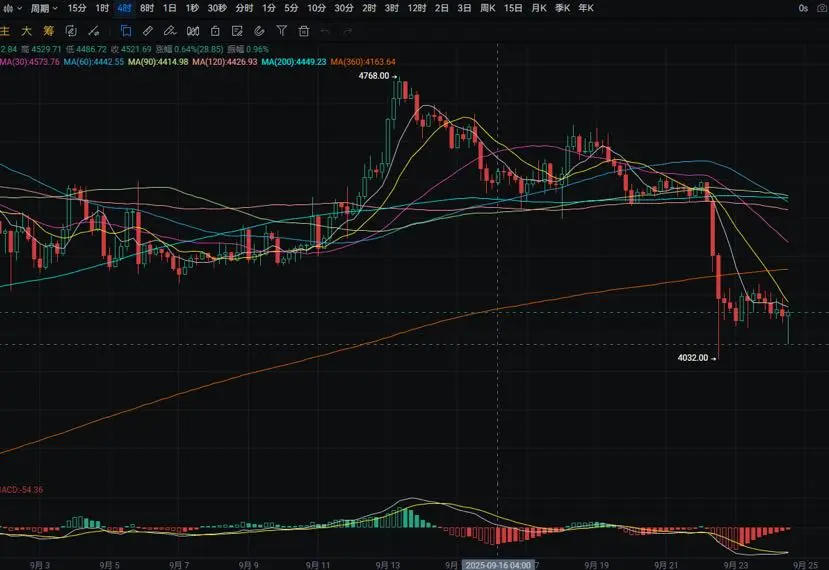
The Ether daily chart yesterday rose from a low of around 3865 to a high of around 4070, closing at around 4030. The support level is around 3870; if it breaks, we could see it drop to around 3795. A rebound could allow for long positions around that area. The resistance level is around 4195; if it breaks, we could see it rise to around the MA14. A rebound near that level could allow for short positions. The MACD shows a decrease in short positions. The four-hour chart shows support at around 3905; if it breaks, it could drop to around 3835. A rebound could allow for long positions around that
ETH0.31%
- Reward
- like
- Comment
- Repost
- Share
The BTC daily chart rose from a low of around 108550 to a high of around 110250 yesterday, closing near 109600. The support level is around 108100; if it breaks below, it could be seen at around 106950. A pullback can be used to enter long positions nearby. The resistance level is near the MA7 moving average; if it breaks through, it could be seen at around 113150. A rebound to nearby levels can be used to enter short positions. The MACD shows an increase in short positions. In the four-hour chart, the support level is around 108350; if it breaks below, it could be seen at around 107650. A pul
BTC1.55%
- Reward
- like
- Comment
- Repost
- Share
BTC daily chart yesterday fell from the highest around 113450 to the lowest around 108550, closing near 108950. The support level is around 107250; if it breaks, it can look down to around 106550. A pullback can be used to enter long positions nearby. The resistance level is near MA120; if it breaks, it can look to MA90. A rebound to nearby can be used to enter short positions. MACD shows an increase in short positions. On the four-hour chart, the support level is around 108500; if it breaks, it can look to around 107600. A pullback can be used to enter long positions nearby. The resistance le
BTC1.55%
- Reward
- like
- Comment
- Repost
- Share
The BTC daily chart yesterday rose from around 110950 to a peak of around 113900, closing near 113250. The support level below is around 110850; if it breaks, we can look towards around 108200. A pullback can provide an opportunity to enter long positions nearby. The resistance level above is near the MA7 moving average; if it breaks, we can look towards around MA14. A rebound to the area can provide an opportunity to enter short positions. The MACD shows an increase in short positions, forming a death cross. On the four-hour chart, the support below is around 110550; if it breaks, we can look
BTC1.55%
- Reward
- like
- Comment
- Repost
- Share
The Ether daily chart yesterday fell from a high of around 4230 to a low of around 4115, closing near 4160. The support level is located near 4010; if it breaks down, a drop to around 3910 can be expected. A pullback can be used to enter long positions nearby. The resistance level is near MA60; if it breaks through, a rise to around MA30 can be expected. A rebound to nearby levels can be used to enter short positions. The MACD shows an increase in short positions. On the four-hour chart, the support level is near 4050; if it breaks down, a decline to around 3955 can be anticipated. A pullback
ETH0.31%
- Reward
- like
- Comment
- Repost
- Share
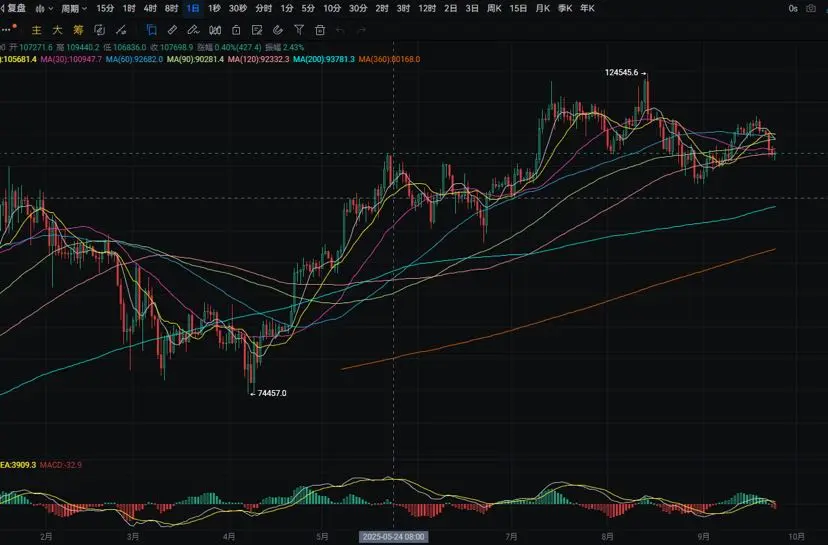
The BTC daily chart yesterday fell from around 113250 to a low of around 111400, closing around 111950. The support level is around 109100; if it breaks, we can look to around 108100. A pullback can be a good opportunity to go long nearby. The resistance level is around 113800; if it breaks, we can look to around 115850. A rebound to nearby can be a good opportunity to go short. The MACD shows an increase in short positions. On the four-hour chart, the support level is around 110750; if it breaks, we can look to around 109450. A pullback can be a good opportunity to go long nearby. The resista
BTC1.55%
- Reward
- like
- Comment
- Repost
- Share
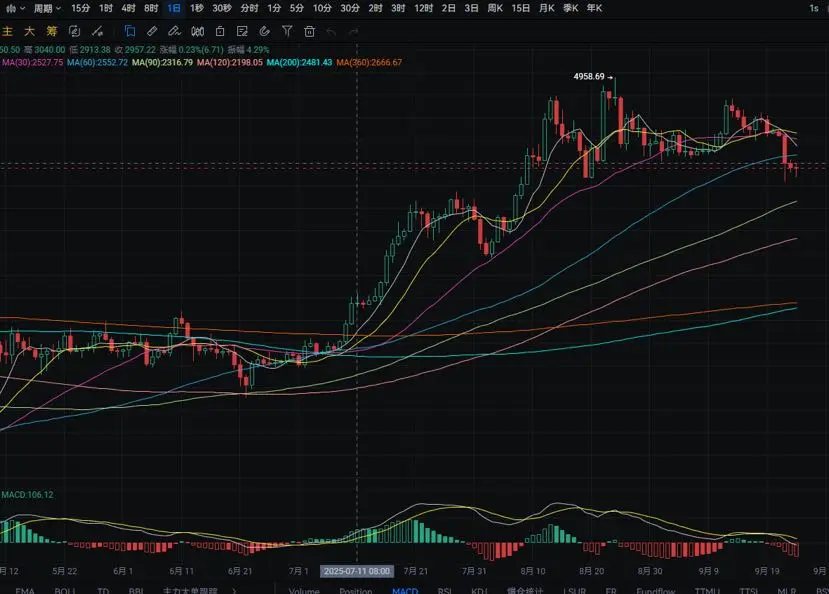
Ether daily chart yesterday fell from a high of around 4455 to a low of around 4030, closing near 4195. The support level is around 4075; if it breaks, it can be seen at around 3905. A pullback can be bought near this level. The resistance level is around 4345; if it breaks, it can be seen near MA30. A rebound near this level can be sold short. MACD shows an increase in short positions. On the four-hour chart, the support level is around 4075; if it breaks, it can be seen at around 3950. A pullback can be bought near this level. The resistance level is around MA360; if it breaks, it can be see
ETH0.31%
- Reward
- like
- Comment
- Repost
- Share
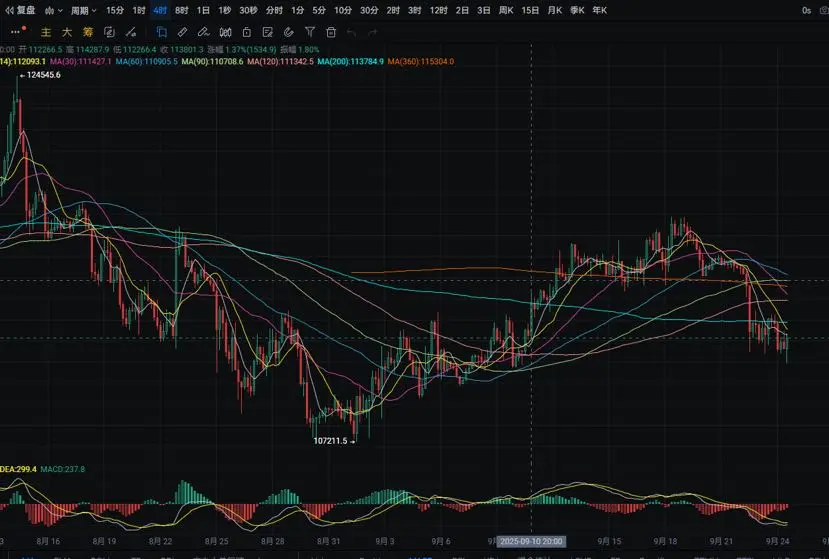
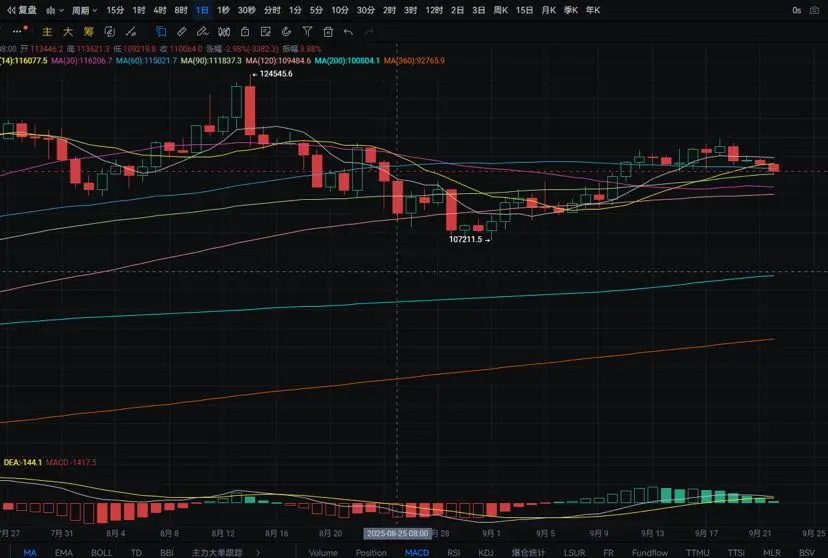
BTC daily chart yesterday fell from the highest around 115350 to the lowest around 111450, closing near 112600. The support level is around 111050; if it breaks below, it can look towards around 108350. A pullback can be bought nearby. The resistance level is near MA90; if it breaks through, it can look towards around 115850. A rebound to nearby can be shorted. MACD shows an increase in short positions, forming a death cross. On the four-hour chart, the support level is around 111650; if it breaks below, it can look towards around 109750. A pullback can be bought nearby. The resistance level i
BTC1.55%
- Reward
- like
- Comment
- Repost
- Share
The daily chart of BTC yesterday fell from a high of around 115800 to a low of around 115150, closing near 115200. The support level is around 113500; if it breaks down, it can be seen towards MA120. A pullback can be used to enter long positions nearby. The resistance level is around 116350; if it breaks through, it can be seen towards 118250. A rebound towards nearby can be used to enter short positions. The MACD shows a decrease in long positions. On the four-hour chart, the support level is around MA120; if it breaks down, it can be seen towards MA200. A pullback can be used to enter long
BTC1.55%
- Reward
- like
- Comment
- Repost
- Share
The BTC daily chart yesterday rose from a low of around 115350 to a high of around 116050, closing around 115600. The support level is near MA90; if it breaks down, it could drop to around MA30. A pullback can be used to enter long positions nearby. The resistance level is around 117500; if it breaks through, it could rise to around 119300. A rebound to nearby levels can be used to enter short positions. The MACD shows a decrease in long positions. On the four-hour chart, the support level is near MA360; if it breaks down, it could drop to around 114050. A pullback can be used to enter long po
BTC1.55%
- Reward
- like
- Comment
- Repost
- Share