Trade
Trading Type
Spot
Trade crypto freely
Alpha
Points
Get promising tokens in streamlined on-chain trading
Pre-Market
Trade new tokens before they are officially listed
Margin
Magnify your profit with leverage
Convert & Block Trading
0 Fees
Trade any size with no fees and no slippage
Leveraged Tokens
Get exposure to leveraged positions simply
Futures
Futures
Hundreds of contracts settled in USDT or BTC
Options
HOT
Trade European-style vanilla options
Unified Account
Maximize your capital efficiency
Demo Trading
Futures Kickoff
Get prepared for your futures trading
Futures Events
Participate in events to win generous rewards
Demo Trading
Use virtual funds to experience risk-free trading
Earn
Launch
Investment
Simple Earn
VIP
Earn interests with idle tokens
Auto-Invest
Auto-invest on a regular basis
Dual Investment
Buy low and sell high to take profits from price fluctuations
Quant Fund
VIP
Top asset management team helps you profit without hassle
Crypto Loan
0 Fees
Pledge one crypto to borrow another
Lending Center
One-Stop Lending Hub
VIP Wealth Hub
New
Customized wealth management empowers your assets growth
Private Wealth Management
Customized asset management to grow your digital assets
Staking
Stake cryptos to earn in PoS products
BTC Staking
HOT
Stake BTC and earn 10% APR
GUSD Minting
New
Use USDT/USDC to mint GUSD for treasury-level yields
Soft Staking
Earn rewards with flexible staking
More


ZEENIA
“I hold bags heavier than your ego. Talk charts or don’t talk at all.”
Pin
ZEENIA

- Reward
- like
- 11
- Repost
- Share
ZEENIA:
relax! it was glitch , and of course i couldnt book the profit, but i wish it was real though 🫰🫰View More
- Reward
- like
- Comment
- Repost
- Share
Bitcoin’s Bollinger Bands Hit Record Squeeze . what next? 🥵🥵
#Gatelayerofficiallylaunches #Joingrowthpointsdrawtowiniphone17 #BtcPriceAnalysis
#Gatelayerofficiallylaunches #Joingrowthpointsdrawtowiniphone17 #BtcPriceAnalysis
BTC0.05%
- Reward
- like
- Comment
- Repost
- Share

- Reward
- 1
- Comment
- Repost
- Share
ADA / USDT
- ADA is forming what many see as a bullish reversal setup. Signs include falling wedge or maybe cup-and-handle or higher lows. - Key levels: $0.86-$0.90 as major resistance to reclaim. These would be needed to flip momentum. - Support around $0.80 relies on staying above that zone. If that fails, downside is more likely.
Trade setup: — Entry: Buy near current levels (if ADA is ~$0.86-$0.90) OR better entry on pullback toward ~$0.80 if you can risk waiting — Stop-loss: ~5-8% below entry; e.g. if entry at $0.90, SL ~$0.82; if entry at ~$0.80, SL ~$0.73 — Take-profits: •
ADA0.7%
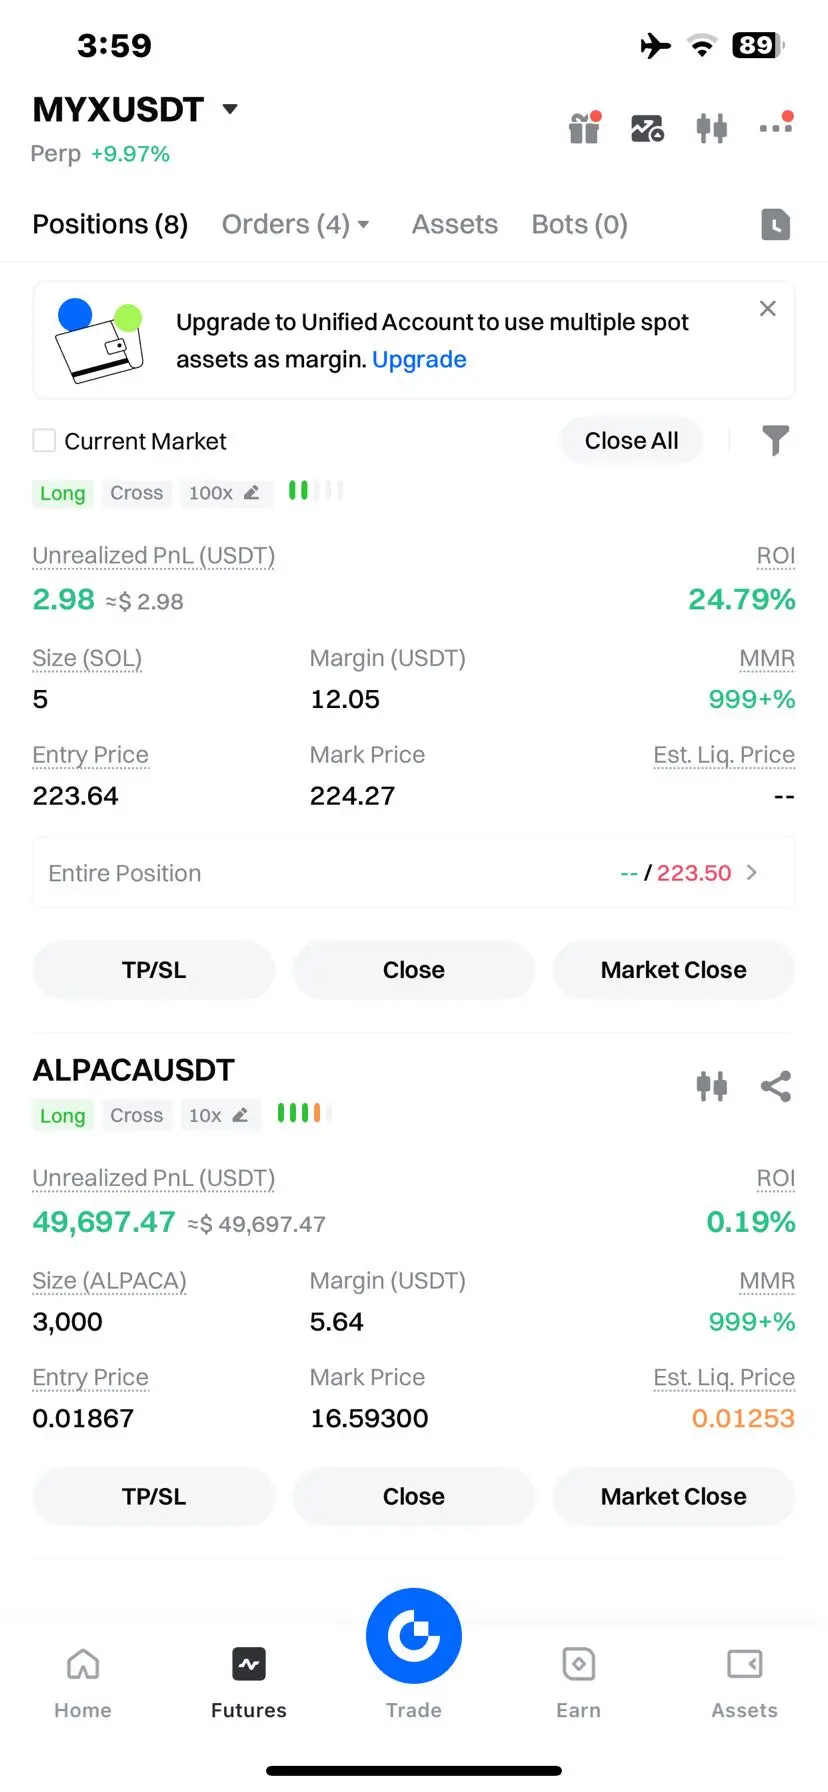
[The user has shared his/her trading data. Go to the App to view more.]
- Reward
- like
- Comment
- Repost
- Share
LINK / USDT
(WAIT FOR ENTY ) if breaks sbove 28
- LINK is testing resistance near $27.87–$29–$32 in some projections. If it breaks, upside is good. - Key supports around $21 region (golden retracement / moving averages) that have held in past analyses. If that holds, structure stays bullish.
Trade setup: — Entry: Ideally on break above $28 (resistance) OR a safer pullback toward $23-$25 if price dips — Stop-loss: ~5-7% below entry; for example, if entering at $28, SL at ~$25; if pullback entry at $23, SL ~$21 — Take-profits: • TP1: ~$34–$36 • TP2: ~$40-45 if momentum strong and r
[The user has shared his/her trading data. Go to the App to view more.]
- Reward
- like
- Comment
- Repost
- Share
SOL / USDT
- SOL is consolidating just under a major resistance at ~$248–$250, which is seen as a “supply wall.” - Support zone around $230 is important. Holding above that gives bullish potential. - If price breaks cleanly above $248–$250 with strength/volume, it could swing up toward next resistance zones.
Trade setup: — Entry: buy on breakout above $250 OR conservative entry on pullback near $230–$235 — Stop-loss: if entry at $250, SL around $230; if entry at pullback, SL around $215–$220 — Take-profits: • TP1: ~$280–$300 • TP2: ~$330-350 if breakout is strong and holds —
SOL-1.45%
[The user has shared his/her trading data. Go to the App to view more.]
- Reward
- like
- Comment
- Repost
- Share
SOMI/USDT Short-Term Trade Setup
Trade Direction: We favor a LONG (buy) setup. SOMI has pulled back sharply from its Sept. 7, 2025 all-time high (~$1.9061 ) into the ~$1.22–1.30 zone. Multiple analyses suggest this area is strong support and likely to “bounce”  . For example, one signal notes that after the $1.90 peak, SOMI “is stabilizing near 1.22–1.25 support” and a “strong bounce zone” exists at $1.22 . Meanwhile, technical indicators remain constructive: short EMAs are still aligned bullishly and the MACD has turned positive . Funding rates are only slightly positive (e.g. +0.0100% o
Trade Direction: We favor a LONG (buy) setup. SOMI has pulled back sharply from its Sept. 7, 2025 all-time high (~$1.9061 ) into the ~$1.22–1.30 zone. Multiple analyses suggest this area is strong support and likely to “bounce”  . For example, one signal notes that after the $1.90 peak, SOMI “is stabilizing near 1.22–1.25 support” and a “strong bounce zone” exists at $1.22 . Meanwhile, technical indicators remain constructive: short EMAs are still aligned bullishly and the MACD has turned positive . Funding rates are only slightly positive (e.g. +0.0100% o
[The user has shared his/her trading data. Go to the App to view more.]
- Reward
- like
- Comment
- Repost
- Share
- Reward
- 2
- 1
- Repost
- Share
OnlyLoveToPlayWithA :
:
Hold on tight, we're about to To da moon 🛫