Trade
Trading Type
Spot
Trade crypto freely
Alpha
Points
Get promising tokens in streamlined on-chain trading
Pre-Market
Trade new tokens before they are officially listed
Margin
Magnify your profit with leverage
Convert & Block Trading
0 Fees
Trade any size with no fees and no slippage
Leveraged Tokens
Get exposure to leveraged positions simply
Futures
Futures
Hundreds of contracts settled in USDT or BTC
Options
HOT
Trade European-style vanilla options
Unified Account
Maximize your capital efficiency
Demo Trading
Futures Kickoff
Get prepared for your futures trading
Futures Events
Participate in events to win generous rewards
Demo Trading
Use virtual funds to experience risk-free trading
Earn
Launch
Investment
Simple Earn
VIP
Earn interests with idle tokens
Auto-Invest
Auto-invest on a regular basis
Dual Investment
Buy low and sell high to take profits from price fluctuations
Quant Fund
VIP
Top asset management team helps you profit without hassle
Crypto Loan
0 Fees
Pledge one crypto to borrow another
Lending Center
One-Stop Lending Hub
VIP Wealth Hub
New
Customized wealth management empowers your assets growth
Staking
Stake cryptos to earn in PoS products
BTC Staking
HOT
Stake BTC and earn 10% APR
ETH Staking
HOT
Stake ETH and earn 10% APR
GUSD Minting
New
Use USDT/USDC to mint GUSD for treasury-level yields
Soft Staking
Earn rewards with flexible staking
More


- Trending TopicsView More
4.7M Popularity
13.4K Popularity
25.2K Popularity
308.7K Popularity
164.6K Popularity
- Pin
- 💥 Gate Square Event: #Post0GWinUSDT# 💥
Post original content on Gate Square related to 0G or the ongoing campaigns (Earn, CandyDrop, or Contract Trading Competition) for a chance to share 200 USDT rewards!
📅 Event Period: Sept 25, 2025, 18:00 – Oct 2, 2025, 16:00 UTC
📌 Related Campaigns:
Earn: Enjoy stable earnings
👉 https://www.gate.com/announcements/article/47290
CandyDrop: Claim 0G rewards
👉 https://www.gate.com/announcements/article/47286
Contract Trading Competition: Trade to win prizes
👉 https://www.gate.com/announcements/article/47221
📌 How to Participate:
1️⃣ Post original cont - 🚀 #GateNewbieVillageEpisode2# ✖️ @独领风骚必暴富
💰 Share your first profit on Gate | 🎉 Recall your most unexpected gain | 🤝 Grow with the community
⏰ Event Date:Sept 24 04:00 – Sept 30 16:00 UTC+8
How to Join:
1️⃣ Follow Gate_Square + @独领风骚必暴富
2️⃣ Post on Gate Square with the hashtag #GateNewbieVillageEpisode2#
3️⃣ Share your first pot of gold or your most surprising profit on Gate—more detailed and interesting posts have a higher chance to win!
🎁 Rewards
3 lucky winners → Gate X RedBull Tumbler + $20 Futures Trial Voucher
If merchandise cannot be shipped, it will be replaced with a $30 Futures - 🚗 #GateSquareCommunityChallenge# Round 2 — Which coin is not listed on Gate Launchpad❓
Time to prove if you’re a true Gate veteran!
💰 Join the challenge — 5 lucky winners will share $50 in GT!
👉 How to participate:
1️⃣ Follow Gate_Square
2️⃣ Like this post
3️⃣ Comment with your answer
🗓️ Deadline: October 8, 2025, 24:00 (UTC+8) - 🥊 You’ve entered the Trading PK Arena, matching your opponent now...
One click to place an order and jump into the battle! Who will climb the leaderboard and claim the 👑?
Gate’s brand-new Indicators Radar feature is live! Here you can:
📈 Share your trades on the live candlestick chart to [Square] 👉️ https://www.gate.com/post
👀 Watch others’ trading moves in real time;
💬 Go head-to-head with fellow traders in the community!
Don’t just read—follow the tutorial below and get started 👇
📌 Note: This feature is available only on app version 7.20.5 or above.
Crypto Symbols Explained: The Significance of Rocket Emojis 🚀
###Ethereum's Sideways Movement: Prelude to a Major Shift?
The cryptocurrency market is witnessing an intriguing phase as Ethereum (ETH) continues its lateral movement. This seemingly quiet period could be the precursor to a significant price action, either a dip to crucial support levels or the beginning of a bullish trend.
###Key Support Zones Under Scrutiny
ETH is currently testing a critical wave 4 pullback zone between $3,374 and $4,061. The $4,060 level, which aligns with the 23.6% Fibonacci retracement, served as a reaction point in mid-August. The lower boundary at $3,374 provides ETH with a cushion for potential further declines.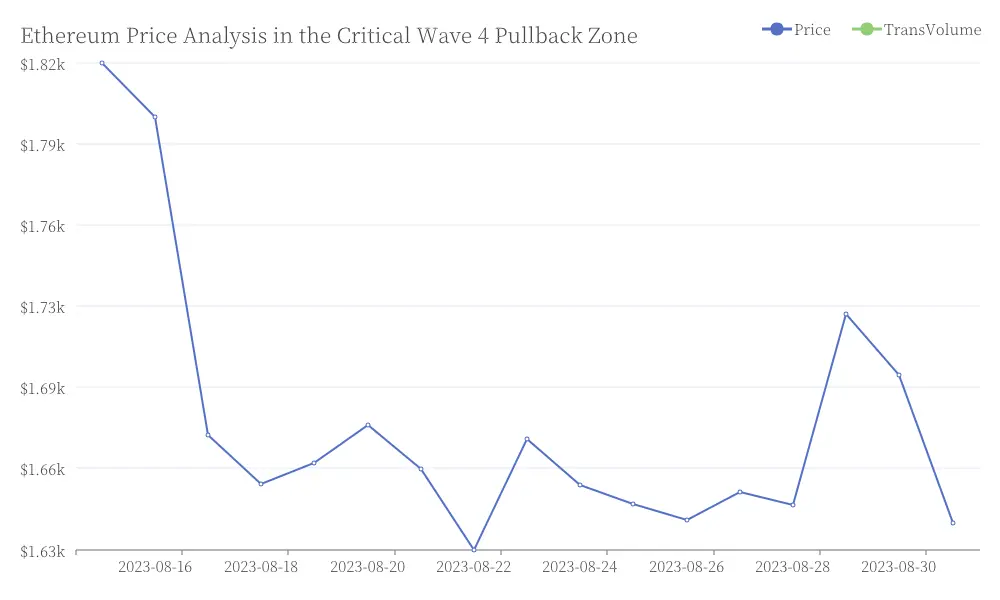 Ethereum Price Analysis in the Critical Wave 4 Pullback Zone
###Potential for Deeper Retracements
Should a more substantial pullback occur, investors should monitor the 38.2% Fibonacci retracement at $3,665, the ascending trendline tested in June, and the dynamic 200-day SMA & EMA moving averages acting as trend filters. Throughout strong uptrends, ETH has historically maintained positions above these moving averages, highlighting their significance as support indicators.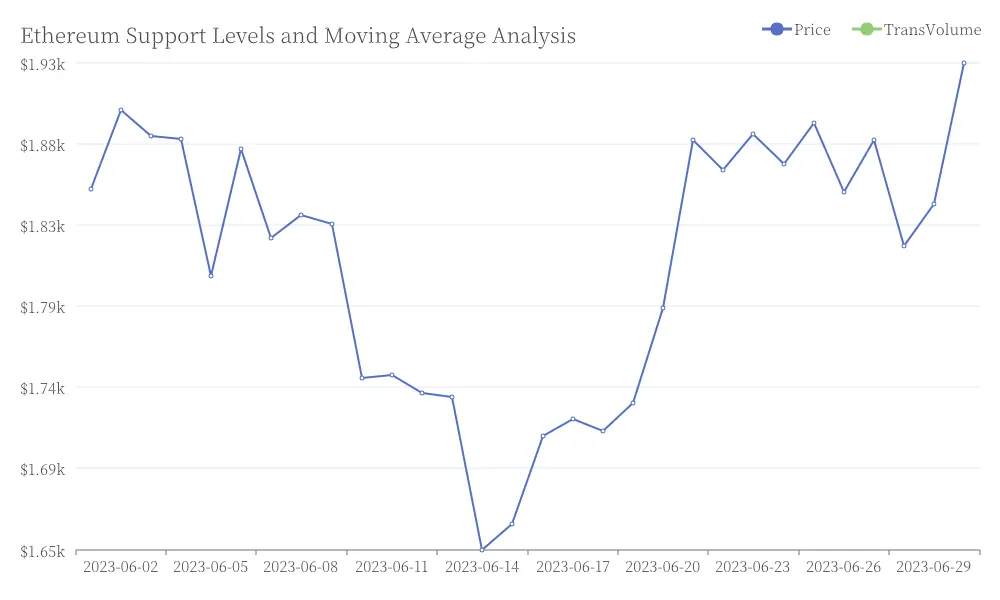 Ethereum Support Levels and Moving Average Analysis
###Short-Term Range-Bound Activity
Currently, ETH fluctuates within a sideways range of $4,211 to $4,500. While the price remains below the $4,500 resistance with no breakout signal yet, it's holding steady above the $4,211 support level. As long as ETH continues trading within this range, prioritizing capital preservation strategies remains crucial for investors.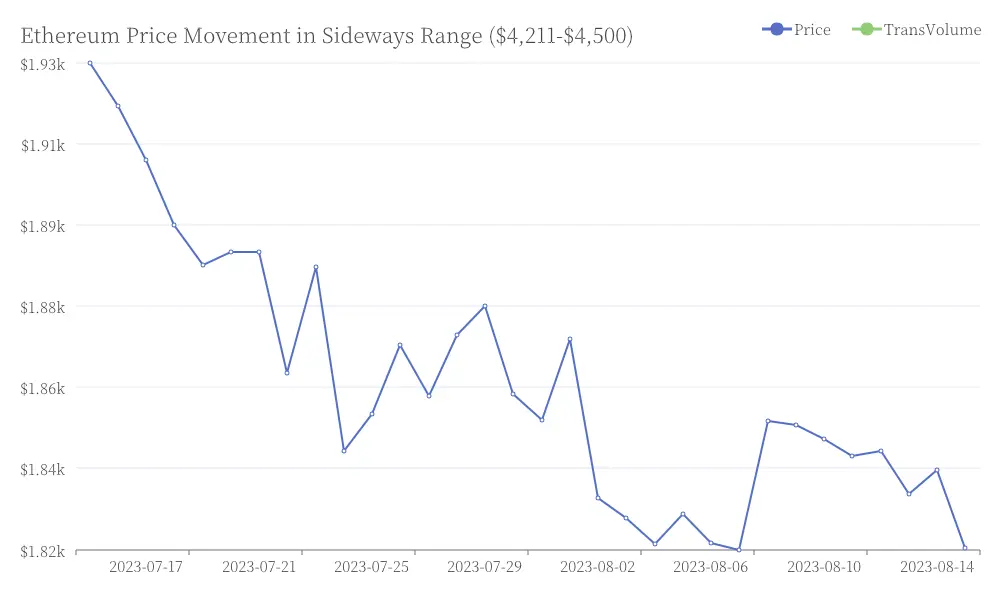 Ethereum Price Movement in Sideways Range ($4,211-$4,500)
###Ethereum's Potential Trajectories
Ethereum's future price action could follow two main paths. In a bullish scenario, maintaining current support levels and breaking through the $4,500 resistance could trigger the next upward wave. Conversely, if ETH fails to hold support, we might see a dip towards the $3,665 level or even $3,374 before a stronger rebound materializes. Meanwhile, ETH's declining market dominance suggests some alternative cryptocurrencies are temporarily outperforming it in the market.
###The Rocket Emoji: A Symbol of Crypto Enthusiasm
In the cryptocurrency community, the rocket emoji 🚀 has become a powerful symbol representing rapid growth, innovation, and excitement, particularly when discussing potential price increases. This emoji encapsulates the speed and energy often associated with cryptocurrency markets, serving as a shorthand for bullish sentiment and the anticipation of significant upward price movements.