INVESTERCLUB
RIZE TO CONCURE
INVESTERCLUB
#DailyPolymarketHotspot $HYPE
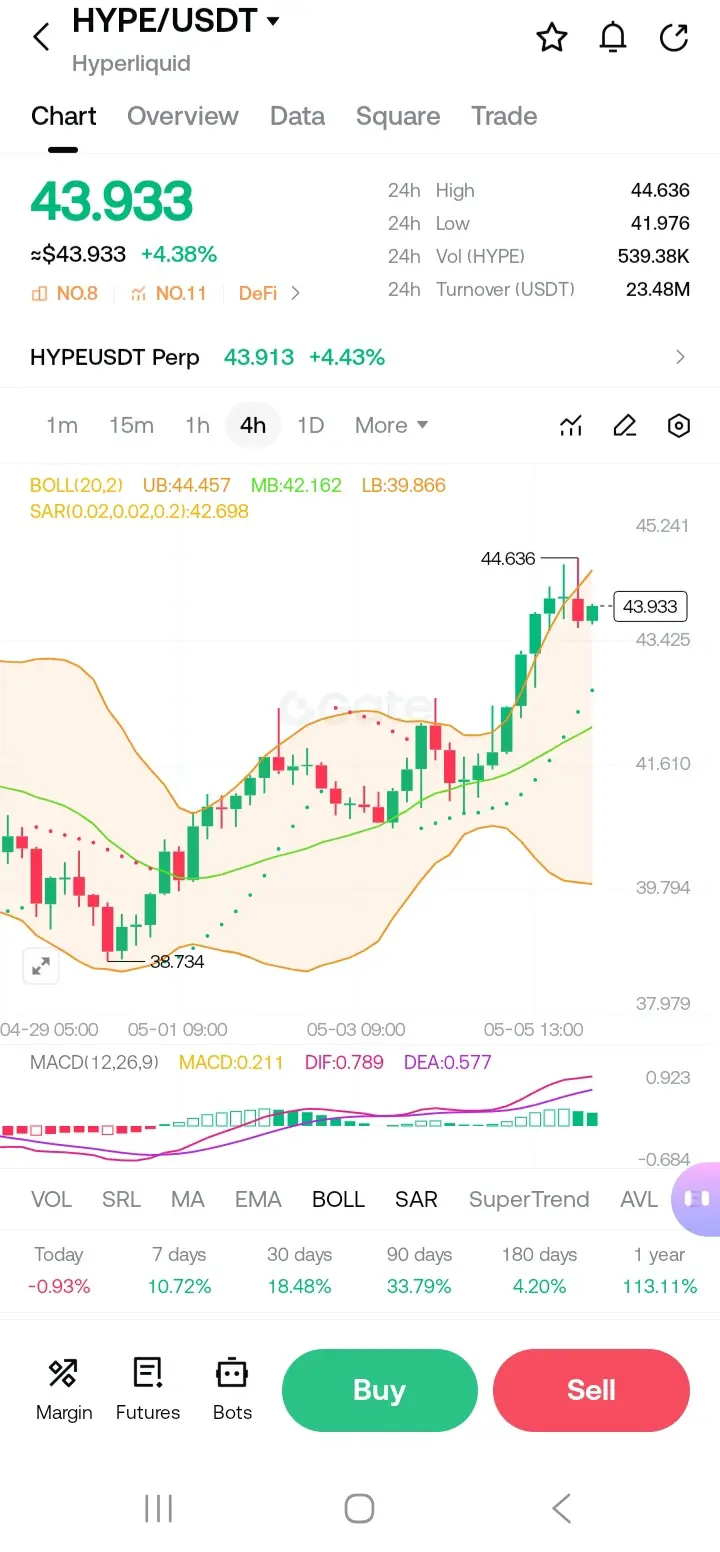
HYPE/USDTチャート(4時間足、BOLL&MACDが見える)に基づき、サポートとレジスタンスの詳細なテクニカル分析を行います。
1. 現在の市場状況
· 価格:約43.933 USDT(本日+4.38%)
· トレンド構造:価格はBOLLミドルバンド(MB:42.162)とSAR(42.698)を上回って取引されており、以前の統合後に短期から中期の強気トレンドの反転を確認しています。
· モメンタム:MACDはDIF(0.789)> DEA(0.577)を示し、ヒストグラム(0.211)がプラスです。これはアクティブな強気のクロスオーバーであり、ヒストグラムの勢いはまだ爆発的ではありません。
2. 主要なレジスタンスレベル(売り側壁)
レベル 価格 なぜ重要か
R1(即時) 44.457 BOLL上バンド(UB) — 動的抵抗線。現在の価格はこのゾーンをテストしています。
R2(ローカルハイ) 44.636 24時間高値 — 現在のキャンドル範囲で明確な拒否ポイント。
R3(主要) 45.241 チャート上の明確なピーク。45.24を上抜ければ46–47への道が開ける。
コンテキスト:
44.64を超える4時間足の終値が出れば、45.24への流動性スイープを期待。弱気は44.60–45.25を積極的に守る。
3.
HYPE2.75%

- 報酬
- 2
- 2
- リポスト
- 共有
EqunixHub:
btc c は間もなく統合され、新しい方向性を定めるでしょうもっと見る
##FedHoldsRateButDividesDeepen $XAUT
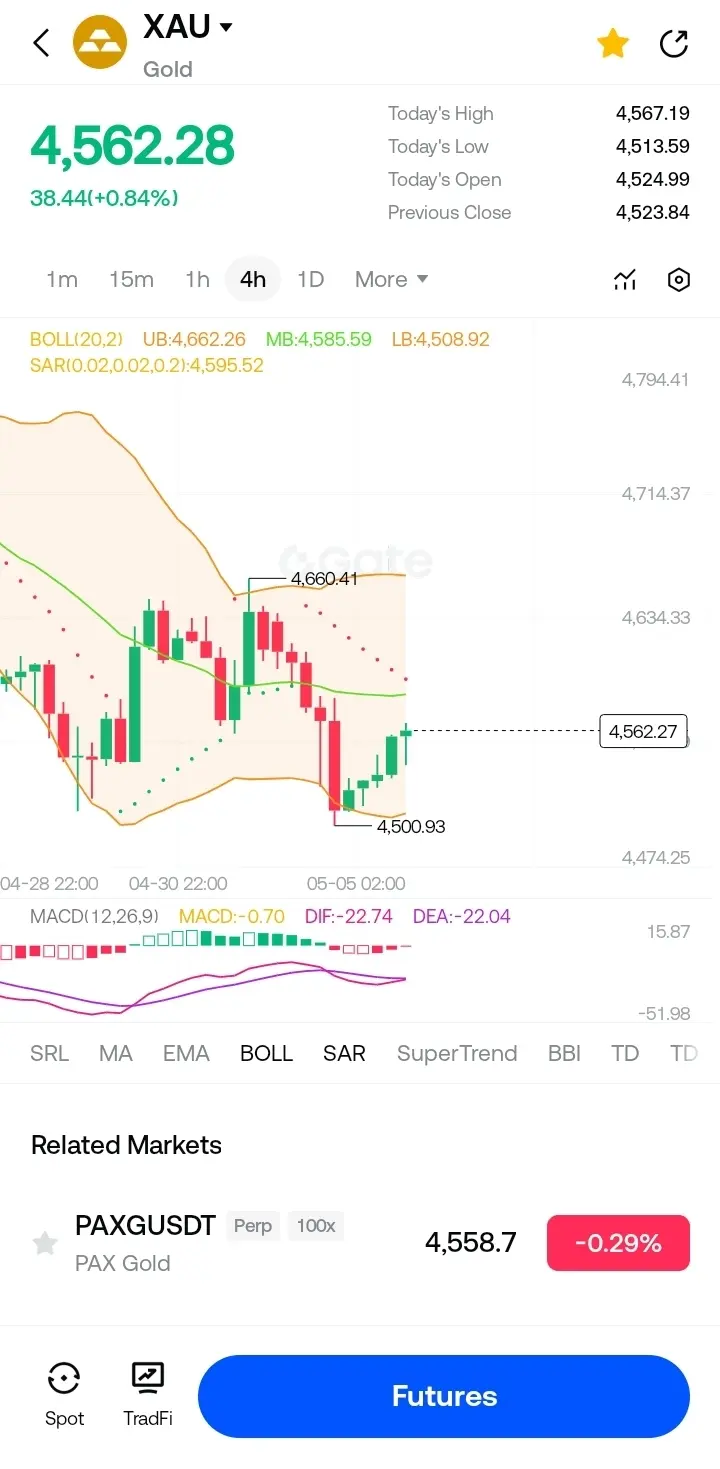
4時間金(XAU)チャートに基づく、主要なサポートとレジスタンスレベルの詳細なテクニカル分析。
現在の市場状況
· 最終価格:4,562.28
· トレンド状況:価格はボリンジャーバンドのミッドバンド(MB:4,585.59)以下で取引されているが、下バンド(LB:4,508.92)より上にあり、短期的な弱気圧力が広範な範囲内に存在していることを示唆。
レジスタンスレベル(上昇障壁)
レベル 価格 根拠
R1(即時) ~4,585.60 ボリンジャーのミッドバンド(MB) / 20期間移動平均線。最初の主要なハードル。
R2 ~4,595.50 パラボリックSAR(最近の反転ポイント)。下落トレンド後の動的抵抗として機能しやすい。
R3(強) ~4,660–4,665 ボリンジャーのアッパーバンド(UB)。ここでのブレイクは強い強気の勢いを示す。
心理的なレベル 4,700 & 4,714 丸い数字 + チャートの左肩から見える前回の高値。
サポートレベル(下降底)
レベル 価格 根拠
S1(即時) ~4,508–4,513 ボリンジャーのローバンド(LB) + 本日の安値(4,513.59)。現在の重要防衛ゾーン。
S2 4,500.93 チャート上の最近のスイング安値(05-05付近で見える)。強力な心
XAUT2.22%
- 報酬
- 2
- コメント
- リポスト
- 共有
$BELIEVE #DailyPolymarketHotspot
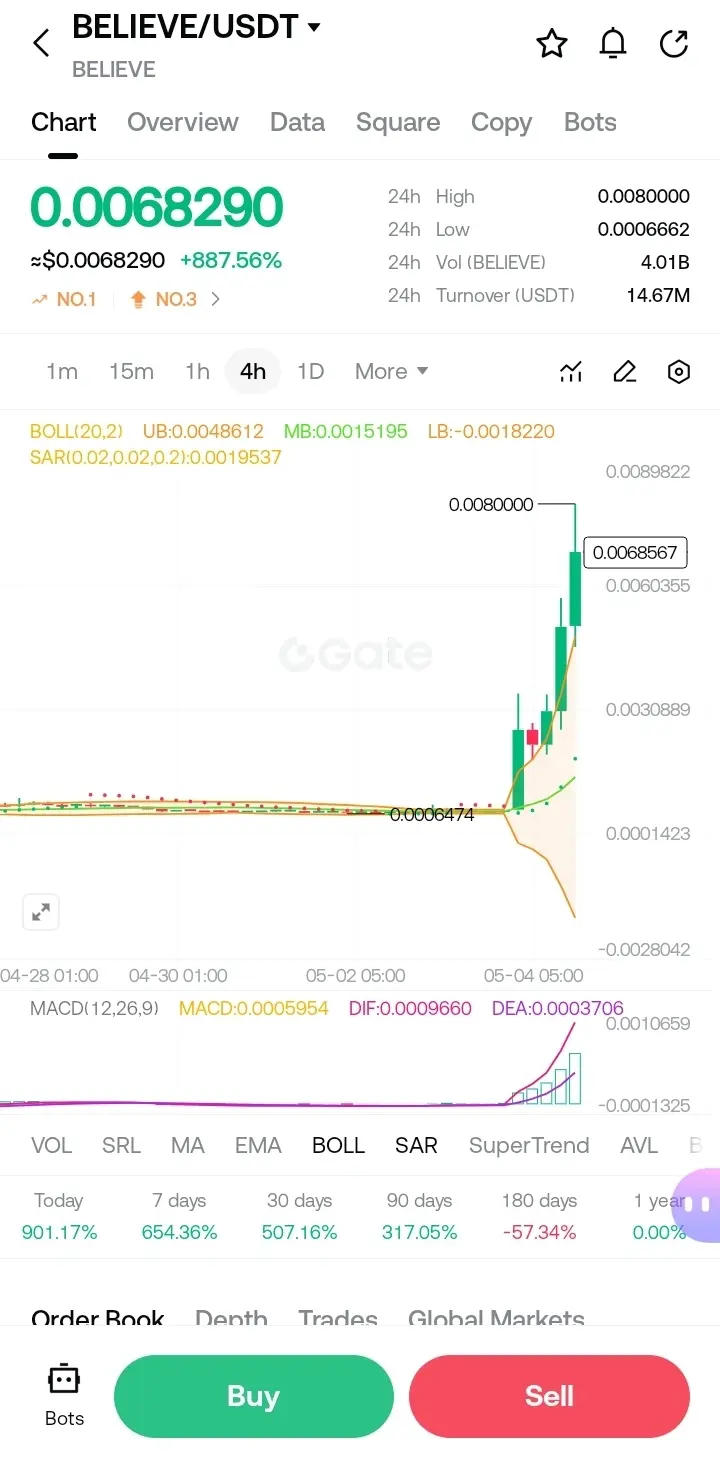
こちらはBELIEVE/USDTチャートの深い技術分析です。
1. 概要と背景
· 現在の価格:~0.0068290
· 24時間変動:+887.56%(非常にボラティリティが高い)
· 24時間範囲:0.0006662 – 0.0080000
これは、市場キャップに対して巨大な取引量(4.01B BELIEVE)を持つ、非常に投機的な低時価総額のミームまたはハイプトークンです。
2. チャートからの主要観察点
📈 トレンドと価格動向
· 垂直な急騰:約0.00014から0.0088へ、約5日間で。
· 現在はピークの0.0088から調整中(チャートにマーク済み)。
· 価格は0.0068付近で取引中 – 依然として0.003レベルを大きく上回っている。
古典的な放物線的上昇 → 初期の分配・統合の兆候。
3. 重要レベル
レベル 価格(USDT) 重要性
最近の高値 0.0088000 供給ゾーン、2回拒否
直近の抵抗 0.0068567 すぐ上の抵抗線
中間サポート 0.0060355 ピボットエリア
強力なサポート 0.0030889 前回のブレイクアウトゾーン
安値(急騰後) 0.0001423 ランチパッドレベル(現時点では関係ない可能性大)
4. 指標
📊 ボリンジャーバンド(20,2)
· 上部バ
BELIEVE-27.86%
- 報酬
- 2
- コメント
- リポスト
- 共有
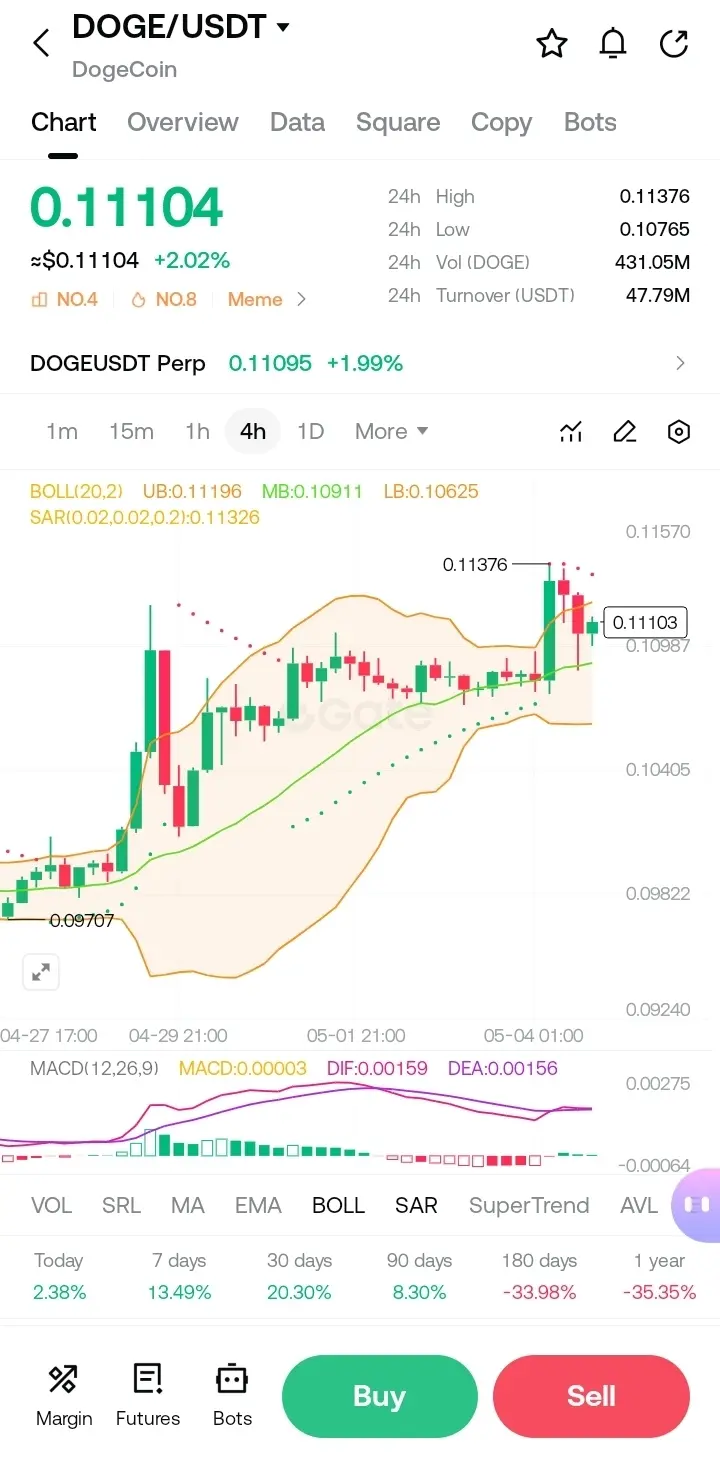
$DOGE #BitcoinSpotVolumeNewLow
スキャル取引計画はこちら
1. 重要レベル
サポート
· 0.10911(ミドルボリンジャーバンド、MB)– 即時サポート
· 0.10625(ローボリンジャーバンド、LB)– 強力なサポート
レジスタンス
· 0.11196(アッパーボリンジャーバンド、UB)– 即時レジスタンス
· 0.11326(SAR)– ダイナミックレジスタンス
· 0.11376 – ローカルスイングハイ
現在価格
· ~0.11104(UB付近、強気圧を示すがボリンジャーの買われ過ぎゾーンに近づく)
2. テクニカル指標の概要
· ボリンジャーバンド(20,2)– 価格は上部バンド付近、調整または統合の可能性を示唆。
· SAR(0.02,0.02,0.2)– 0.11326が価格より上 → 上昇トレンド維持だが鈍化。
· MACD – DIF(0.00159)> DEA(0.00156)、MACDはプラスだが非常に小さく → 弱い強気の勢い。
· 出来高 – 急増なし、強いブレイクアウトの確認不足。
· トレンドの戻り – 本日+2.38%、7日間+13.49%、1年で-35% → 短期的には強気、長期的には弱気。
3. スキャル取引計画(ロング&ショート)
✅ ロング設定(積極的スキャル)
· エントリーゾーン:0.1095 – 0.
DOGE3.29%
- 報酬
- 4
- コメント
- リポスト
- 共有
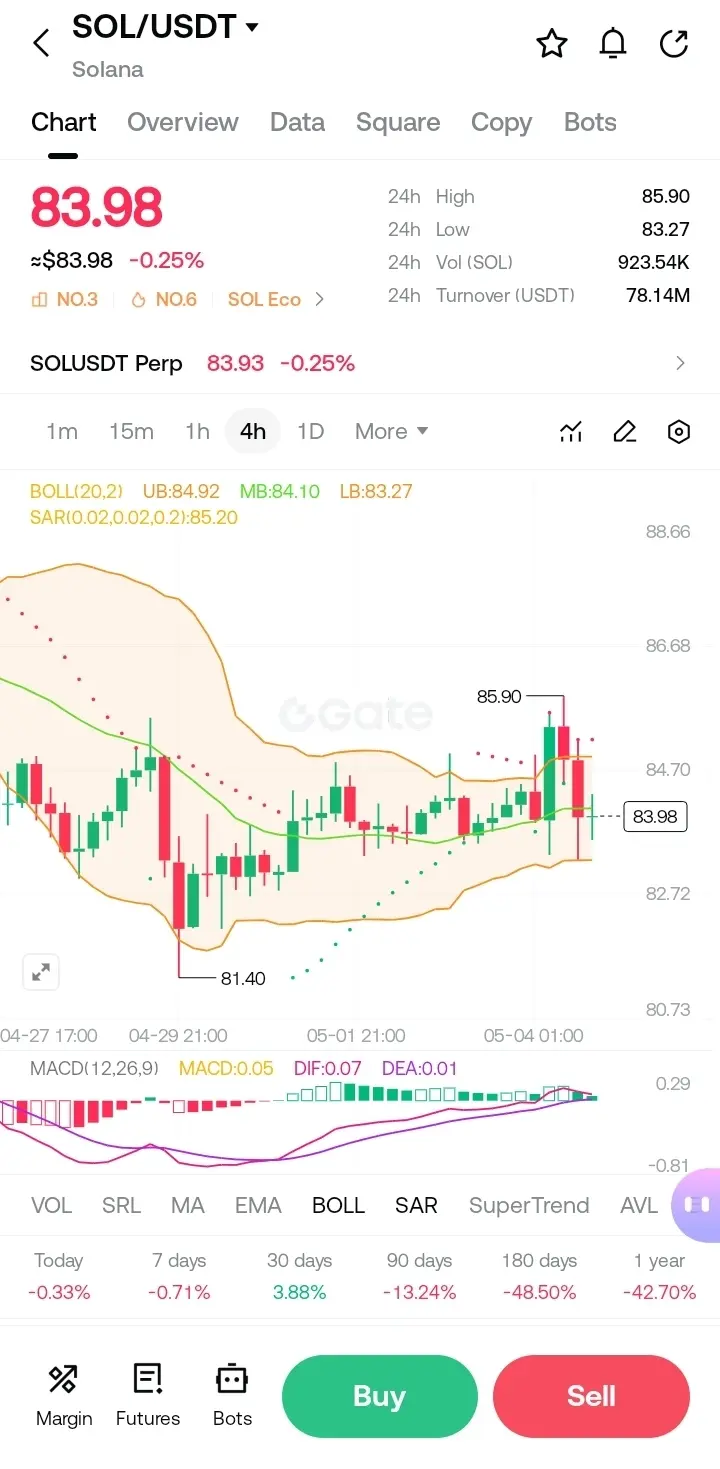
$SOL ##FedHoldsRateButDividesDeepen
こちらはSOL/USDTの4時間足チャートに関する詳細な技術分析で、構造、勢い、トレーダー心理を含む表層レベルを解説します。
1. サポートレベル – 分解
主要サポート:83.27 – 83.50
· ボリンジャーバンド下限(LB:83.27) – ダイナミックサポート。価格がこのレベルに触れるか維持する場合、出来高が確認されれば売られ過ぎ状態を示唆。
· 最近の24時間安値(83.27) – ここで複数回反発があれば強い買い意欲を示す。
· 心理的ラウンドナンバー – 83.00は感情的なサポートとして機能。
二次サポート:82.72 – 81.40
· チャート左側のローソク足の実体から見える歴史的反応ゾーン。
· 83.27を割ると、ストップロスの迅速な掃き出しが予想され、82.72、その後に81.40(前回のレンジ底)へ向かう可能性。
· 81.40を下回ると短期レンジは無効となり、心理的レベルの80.00を目指す。
隠れたサポート(オーダーブロック / 流動性ゾーン)
· 81.00 – 81.50のエリアには、4月末のスイング安値からの未約定買い注文が含まれている可能性。
2. レジスタンスレベル – 分解
即時レジスタンス:84.92 – 85.20
· 上部ボリンジャーバンド(84.92)
SOL3.11%
- 報酬
- 4
- 2
- リポスト
- 共有
Elionis:
🔍を注意深く追跡するもっと見る
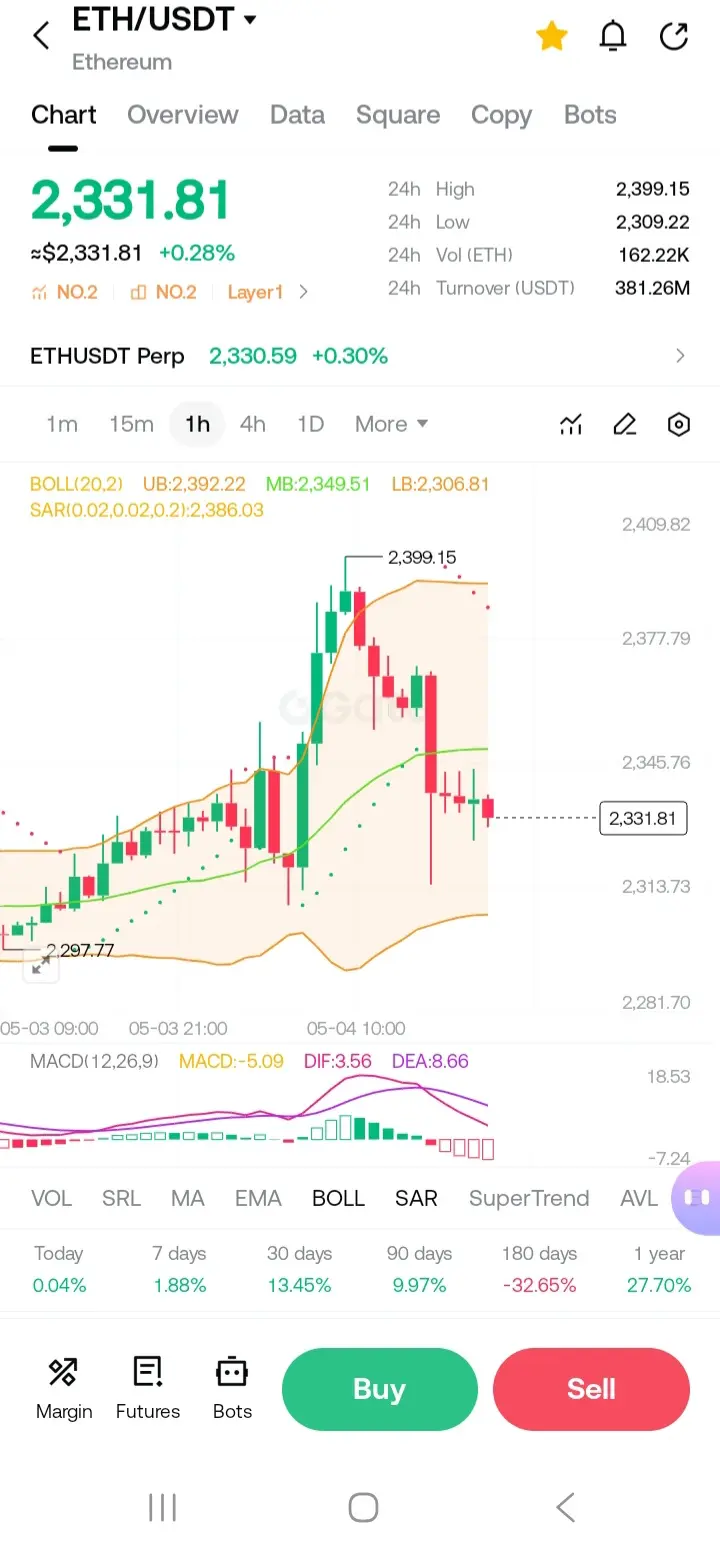
$ETH #USSeeksStrategicBitcoinReserve
提供されたETH/USDTチャート(USDⓈ-マ永久先物、ボリンジャーバンド&MACD表示)に基づく詳細なテクニカル分析です:
1. 全体のトレンドとポジション
· 現在の価格:約2,330(スポット参考値の2,331.81からやや下落)。
· 背景:ETHは180日間で-32.65%下落(中期的弱気)だが、1年間で+27.70%上昇(前回の安値からの回復)。短期(7日+1.88%、30日-13.45%)は最近の売り圧力を示す。
2. ボリンジャーバンド(20,2) – 圧縮 / 弱気バイアス
· 上バンド:2,392.22
· 中央バンド(移動平均):2,349.51
· 下バンド:2,306.81
· 現在の価格(2,330)は中央バンドより下で、下バンドより上に位置。
· 解釈:ETHはボリンジャーバンドの下半分にあり、勢いが弱いことを示す。バンドは極端に広くなく、圧縮またはレンジ相場の可能性を示唆。中間バンド(2,349)を下回ったまま推移すれば、短期的な弱気バイアスが維持される。
3. SAR(パラボリックSAR) – 弱気シグナル
· SAR値:2,386.03
· 価格(2,330)がSARドットより下にあるため、これは典型的な弱気継続シグナル。前の下落トレンドが継続中であり、反発しても2,3
ETH-0.38%
- 報酬
- 3
- 1
- リポスト
- 共有
jimmychen:
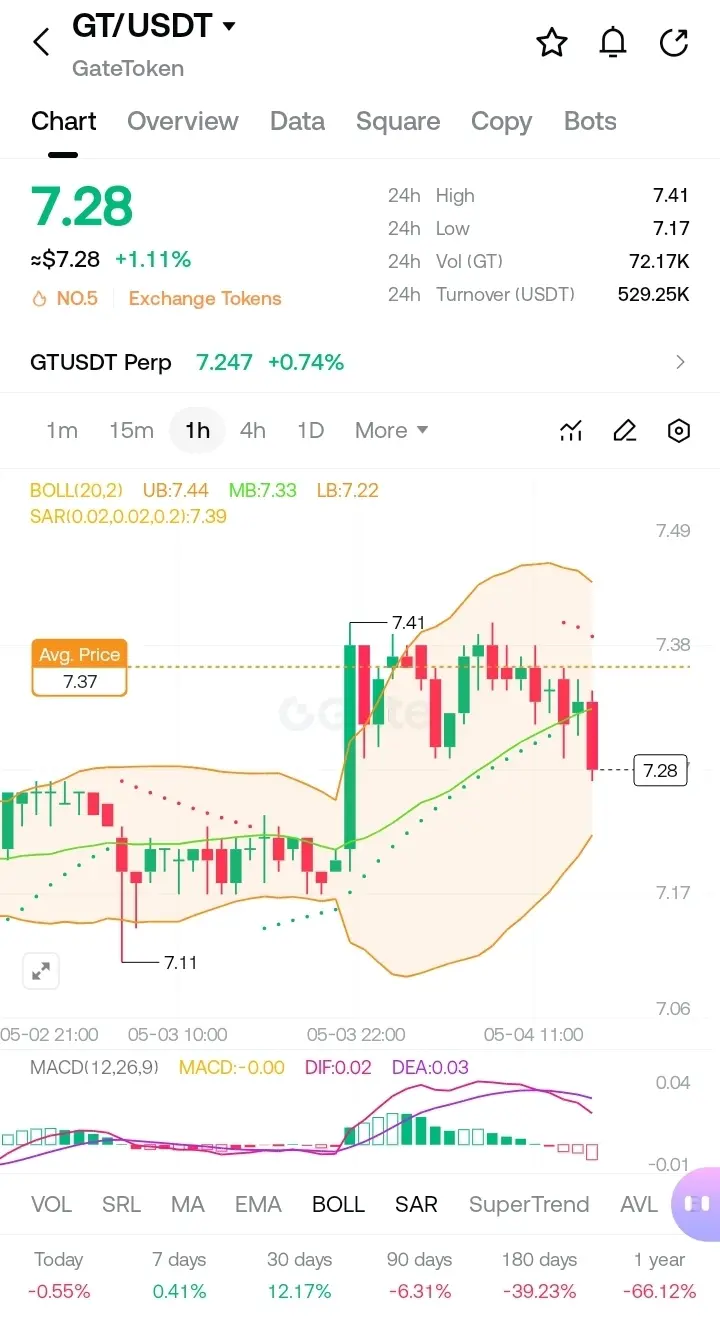
BTCは現在調整を続けながら高値80,000に反発しています。今朝、BTCの上昇の影響で、ETHは今夜も引き続き2400の高値を狙う見込みで、買い方の資金が継続的に買い増しています。皆さんはこの機会に押し目で建て玉を行い、損切りをしっかりと行ってください。$GT #DailyPolymarketHotspot
GT/USDT、こちらは完全な詳細なK線テクニカル分析です。
1. 概要と市場状況
· 現在価格:約7.28ドル
· 24時間変動:+1.11%(穏やかな短期強気)
· ランク:取引所トークンの5位
· 長期トレンド:弱気(1年:-66.12%;180日:-39.23%)
長期的な弱さにもかかわらず、価格は30日間で+12.17%の回復を示しており、中期的な底打ちプロセスの可能性を示唆している。
2. ボリンジャーバンド(20,2)
· 上バンド(UB):7.44
· 中央バンド(MB):7.33
· 下バンド(LB):7.22
· 現在価格(7.28)は中央バンド(7.33)より下だが、下バンド(7.22)より上。
解釈:
価格はボリンジャーバンドの下半分にあり、穏やかな弱気の勢いを示す。売られ過ぎではなく(LBに触れていない)、価格がMB(7.33)を取り戻さない限り、売り手が優勢。バンド幅は平均的→ボラティリティの爆発はまだない。
3. SAR(パラボリックSAR:0.02,0.02,0.21)
· SAR値:7.39
· 現在価格(7.28)はSAR(7.39)より下。
解釈:
SARが価格より上なら上昇トレンド(強気)だが、ここではSARが上にある→弱気トレンドのシグナル。反発は7.39を超える必要がある。
4.
GT0.13%

- 報酬
- 4
- 1
- リポスト
- 共有
NexaCrypto:
LFG 🔥$XRP #DeFiLossesTop600MInApril
1. 現在の市場スナップショット
· 価格:約1.383 USDT
· 24時間範囲:1.382 – 1.401
· 短期トレンド:やや弱気(本日-0.14%、7日間で-3.08%)
· 長期の背景:1年で-36.53% → XRPは最近の反発にもかかわらずマクロ的な下落トレンドに留まる。
2. 主要指標
ボリンジャーバンド(20,2)
· 上部:1.398
· 中央(移動平均):1.389
· 下部:1.380
解釈:
価格は下部バンドに寄り添い、弱気圧を示すとともに売られ過ぎの可能性も示唆。1.380を下回ると売りが加速する可能性。
SAR(0.02, 0.2)
· 値:1.391(価格より上)
→ パラボリックSARは価格より上にあり → 現在の時間枠で下落トレンドが確認される。
MACD(12,26,9)
· MACDライン:-0.001
· DIF:-0.000
· DEA:0.000
→ 弱気シグナル(MACDがシグナルライン下)、ただし勢いは非常に弱い(ゼロ付近)。明確なクロスを待つ。
3. サポート&レジスタンスレベル
レベル 価格(USDT) 種類 強さ
即時抵抗 1.389 – 1.391 MA & SAR 中程度
より強い抵抗 1.398 – 1.401 BB上部 + 24時間高値 強
重要抵抗
XRP1.56%
- 報酬
- 1
- コメント
- リポスト
- 共有
$ORDI ##FedHoldsRateButDividesDeepen
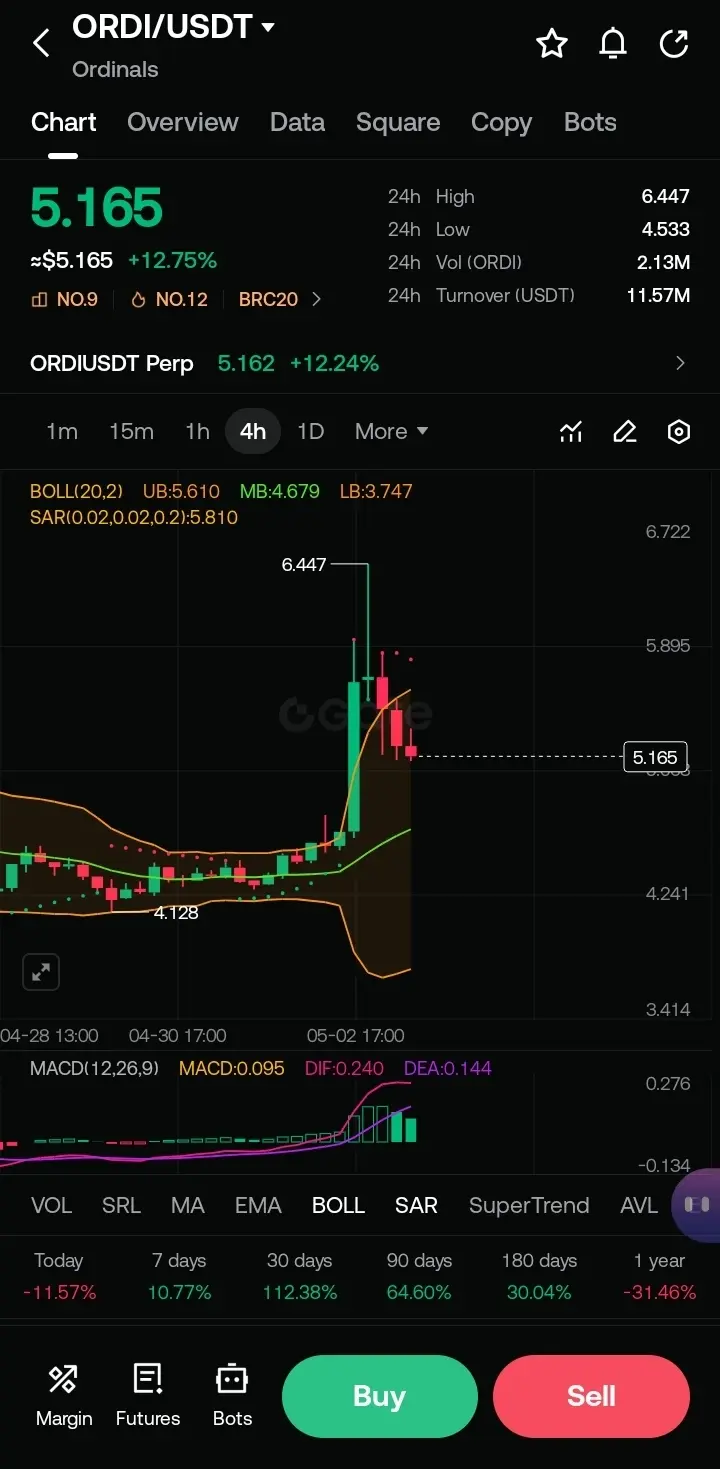
こちらはORDI/USDT 4時間足チャートの詳細なテクニカル分析です。
1. 市場の状況と概要
· 現在価格:約5.165 USDT
· 24時間変動:+12.75%(強い強気の勢い)
· 24時間レンジ:4.533 – 6.447
· 本日の変動:–11.57%(日内の調整を示唆)
· 全体のトレンド(30日/90日):+112% / +64% → 明らかに強気のマクロトレンドだが急激な調整も見られる。
2. ボリンジャーバンド(20,2)分析
· 上バンド(UB):5.610
· 中央バンド(MB / SMA):4.679
· 下バンド(LB):3.747
解釈:
価格は最近UB(約6.44付近)を超えた → 行き過ぎている → 現在の調整で約5.165に戻り、UBの少し下のエリアをテスト中。
· MB(4.679)を上回る保持は構造を強気に保つ。
· MBを下回るとLB(3.747)を狙う動きとなり、主要サポートと一致。
3. SAR(パラボリックSAR)
· SAR値:5.810(現在価格より上)
→ 4時間足で弱気の反転シグナル。これにより、最近の高値(約6.44)は局所的なトップであり、価格は現在リトレースメント段階にあることを確認。
4. MACD(12,26,9)
· MACDライン:
ORDI-0.13%
- 報酬
- 1
- コメント
- リポスト
- 共有
$TRX #BitcoinSpotVolumeNewLow
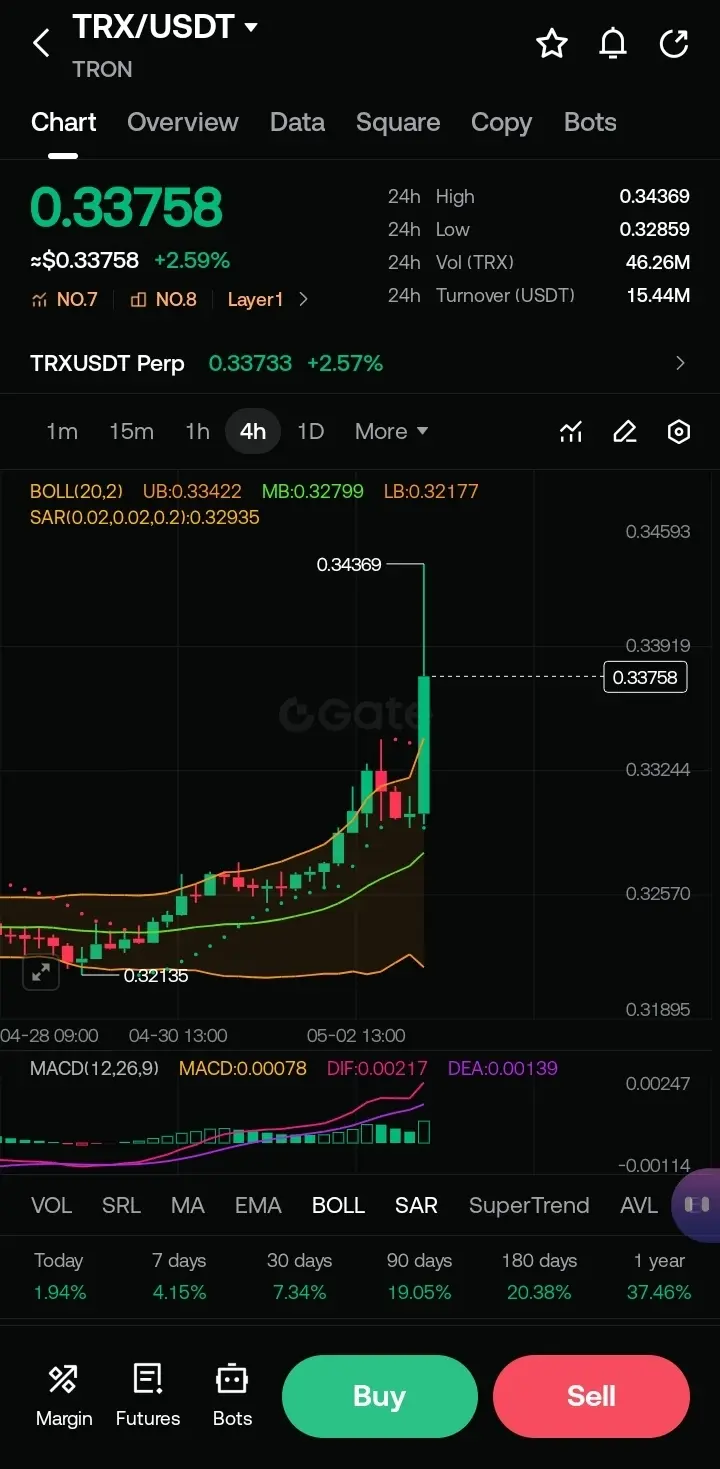
TRX/USDT 4時間チャート、サポートとレジスタンスレベル、トレンド構造、主要指標に焦点を当てた詳細なテクニカル分析。
1. 現在の市場概況
· 価格:約0.33758 USDT(+2.59%)
· トレンド状況:価格はボリンジャーバンドの中央バンド(MB:0.32799)より上で取引されており、4時間足で弱気から強気への勢いの変化を示している。
· SAR:0.32935 価格はパラボリックSARより上にあり、上昇トレンドを確認。
2. 主要レジスタンスレベル(上昇ターゲット)
レベル 価格(USDT) 重要性
R1 0.33422 上部ボリンジャーバンド(即時抵抗線)
R2 0.34369 24時間高値 / ローカルスイングハイ
R3 0.35000 心理的な丸い数字 / 次の主要供給ゾーン
R4 0.36000 - 0.37000 以前の構造高値(完全には示されていないが歴史的背景から)
現在の観察:価格は0.33422(UB)を突破しようとしている。これを上回る確定足が出れば、0.34369やそれ以上への道が開かれる。
3. 主要サポートレベル(下落保護)
レベル 価格(USDT) 重要性
S1 0.32935 パラボリックSAR(動的サポート)
S2 0.32799 中央ボリンジャーバンド(トレンドのピボッ
TRX0.89%
- 報酬
- 1
- コメント
- リポスト
- 共有
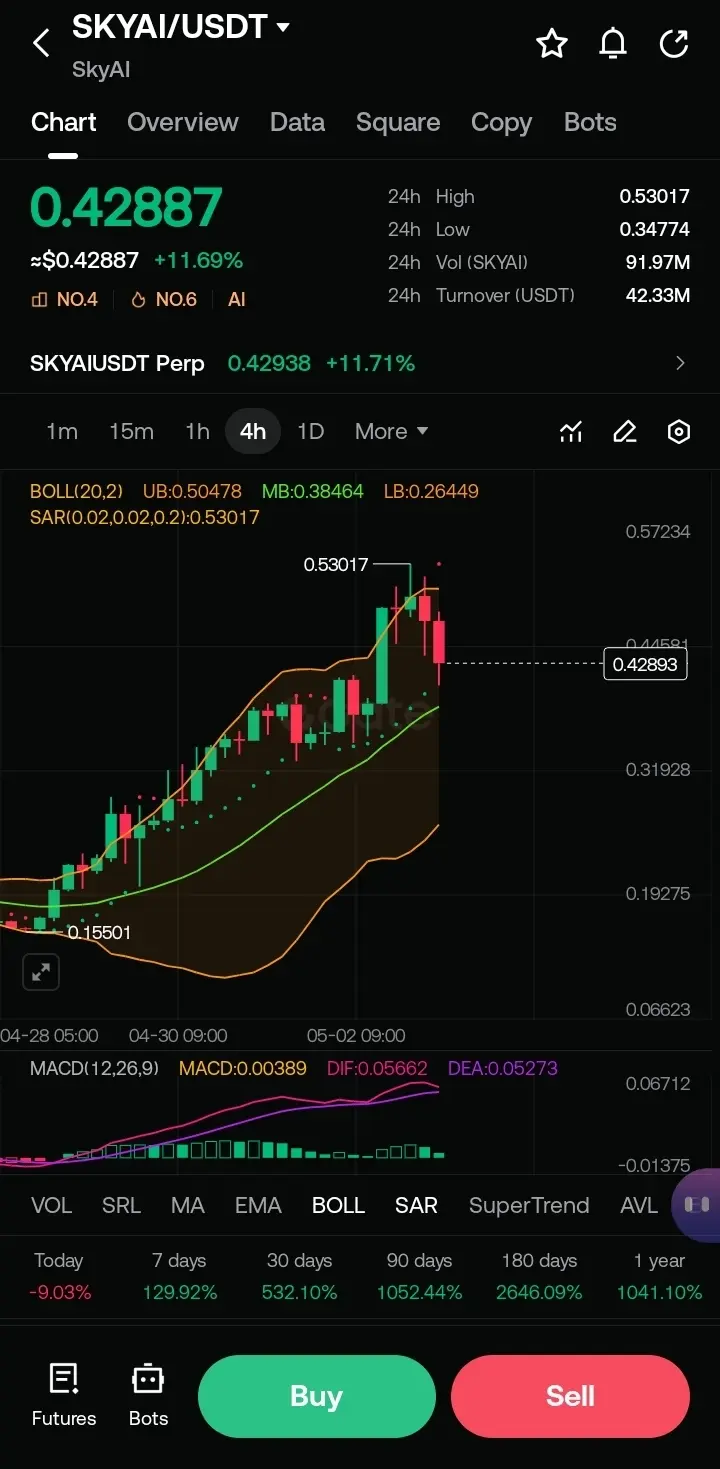
#OilBreaks110 4時間チャート SKYAI/USDT、重要なサポートとレジスタンスレベルを含む詳細なテクニカル分析。
1. 現在の市場スナップショット
· 価格:約0.42887 USDT
· 24時間変動:+11.69%(短期的な強気の勢い)
· 全体のトレンド:非常に強気(180日間で+2646%増加)、しかし現在は最近のピークからの調整/押し戻し中。
2. 主要指標の分析
ボリンジャーバンド(20,2)
· 上バンド(UB):0.50478
· 中央バンド(MB):0.38464(20期間移動平均)
· 下バンド(LB):0.26449
· 解釈:価格は中央バンドより上で取引されているが、上バンドからはかなり下。急上昇後、バンド内で冷却中。バンドは広く、依然として高いボラティリティを示す。
SAR(パラボリック・ストップ&リバース)
· 値:0.53017
· 解釈:SARは現在価格(0.53017 > 0.42887)より上にある。これは現在のローソク足にとって弱気のシグナルで、上昇トレンドが一時停止し、調整段階に入っていることを示す。
MACD(12,26,9)
· MACDライン:0.00389(正の値だが小さい)
· DIF(ファスト):0.05662
· DEA(スロー):0.05273
· 解釈:DIFはDEAより上(ゴールデンクロスが以前に発生)。
SKYAI30.8%
- 報酬
- 1
- コメント
- リポスト
- 共有
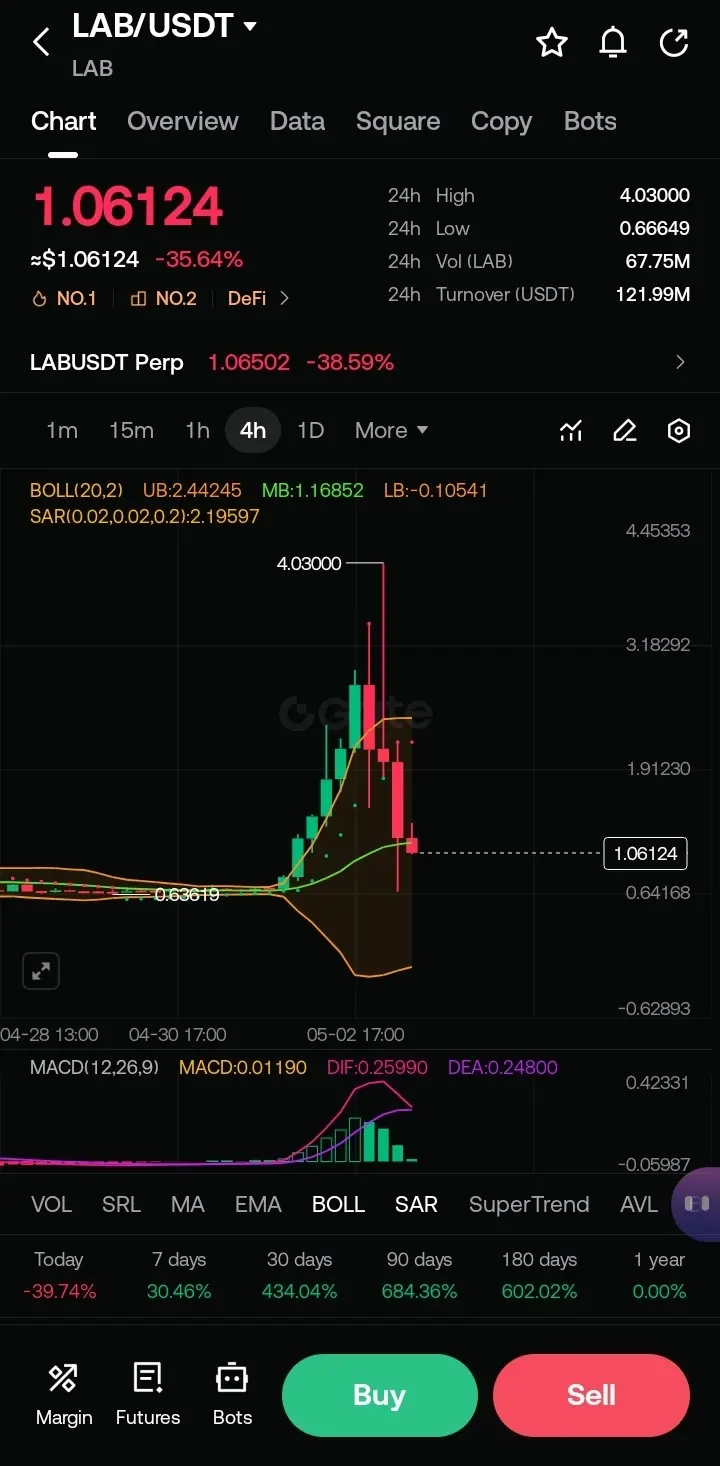
#FedHoldsRateButDividesDeepen $LAB
以下はLAB/USDTチャート(4時間足のローソク足データを示す)の詳細な技術分析です。
1. 全体の市場状況と主要な動き
· 現在の価格:~1.06124 USDT
· 24時間変動:-35.64%(短期的に非常に弱気)
· 30日変動:+434.04% → 以前の強い上昇トレンド
· 90日変動:+684.36% → 長期的な強気構造
これは数ヶ月にわたる激しい上昇ラリーの後、最近の高値から急激に調整されたことを示唆しています。
2. 重要なレベル
レベル 価格(USDT) 重要性
24H高値 4.03000 最近の反発拒否 / 強い抵抗線
前回サポート ~1.16852(MB) ボリンジャーバンドの中央線
現在の価格 1.06124 MB以下 — 短期的に弱気
24H安値 0.66649 重要なサポート(最近テスト済み)
ボリンジャーバンド下部バンド -0.10541 極端な下限バンド(実際の価格ではない)→ 高いボラティリティを示唆
負のLBは計算上のアーティファクトです。意味のある低値(約0.66649)に置き換える。
3. 指標分析
ボリンジャーバンド(20,2)
· UB:2.44245
· MB:1.16852
· LB:-0.10541(無効 — 実際のチャートでは約0.66649と解釈)
·
LAB48.77%
- 報酬
- 3
- 1
- リポスト
- 共有
GateUser-0f2a6f7f:
jxjeoejrjdiekenj2037474929(9#)$+$!_)##BitcoinETFOptionLimitQuadruples $GT
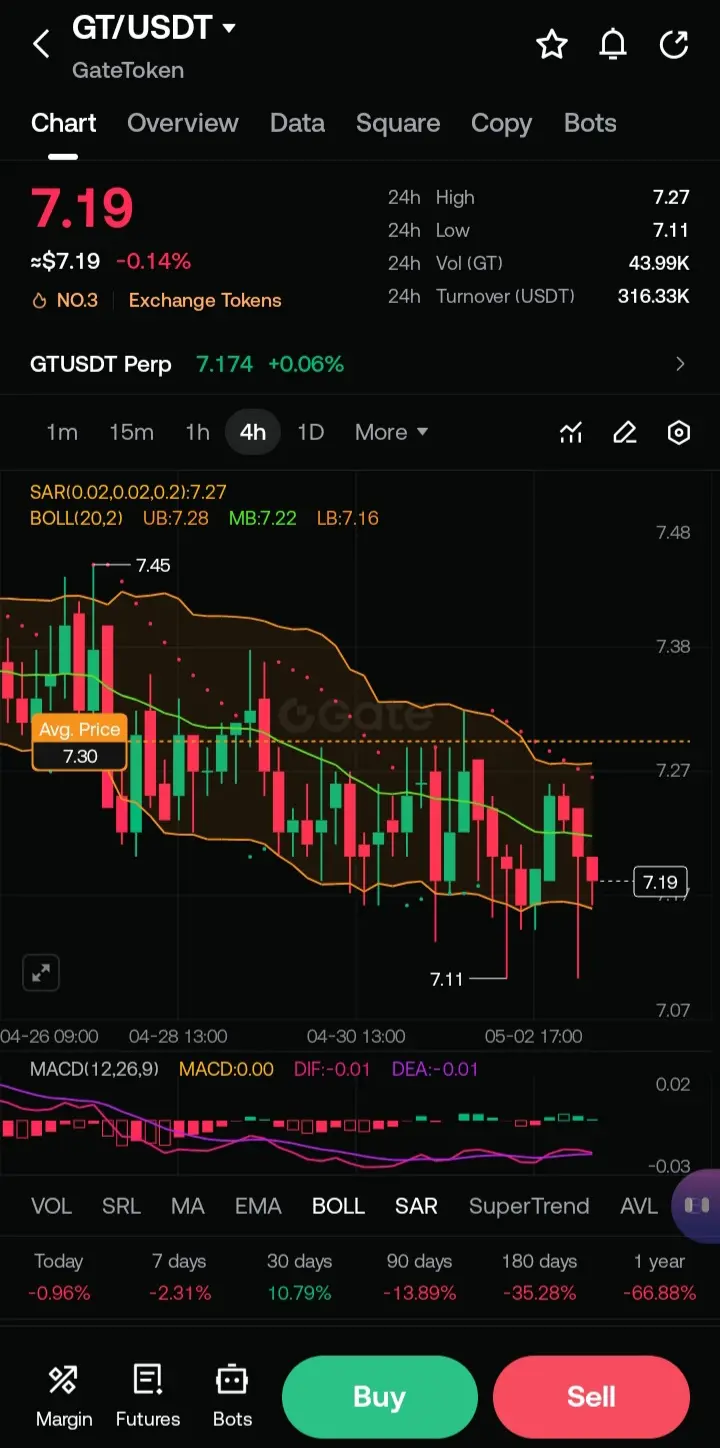
GT/USDTの4時間チャートに基づく詳細なテクニカル分析です:
1. 価格とトレンドの概要
· 現在の価格:約7.19ドル
· 24時間変動:-0.14%(やや弱気)
· 範囲内の位置:最近の高値(7.45)と安値(7.11)の中間付近にあり、迷いを示しています。
2. 主要指標の内訳
SAR(パラボリックSAR - 0.02,0.02,0.2):
· 値:7.27
· 解釈:弱気。価格はSARドットの下で取引されており、短期的な下落トレンドが維持されていることを示唆。抵抗は7.27付近に予想される。
BOLL(ボリンジャーバンド - 20,2):
· 上部(UB):7.28
· 中央(MB):7.22
· 下部(LB):7.16
· 解釈:価格(7.19)は中央と下部バンドの間にあり、LB(7.16)付近に近い。バンドは比較的狭く、低ボラティリティの絞り込み状態 → ブレイクアウト(上昇または下降)が近づいている可能性。
MACD(12,26,9):
· MACDライン:0.00
· DIF:-0.01
· DEA:-0.01
· 解釈:中立からやや弱気。ラインはゼロラインと非常に近く、弱い勢いと明確なトレンドの欠如を示す。ゼロを超えるクロスは強気の反転を示唆。
3. サポートとレジスタンスレベル
·
GT0.13%
- 報酬
- 2
- コメント
- リポスト
- 共有
#USSeeksStrategicBitcoinReserve $SUI
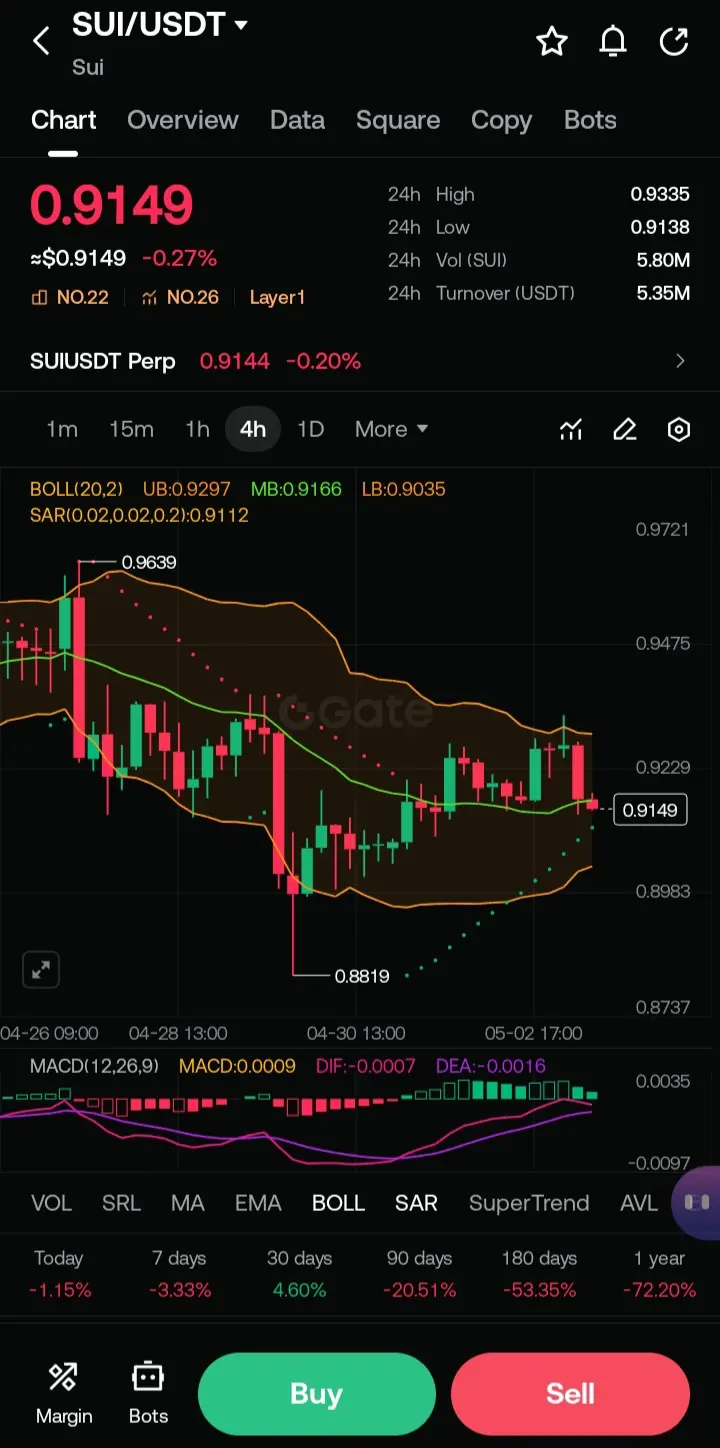
SUI/USDT 4時間足チャートに基づく詳細なテクニカル分析です。
📊 トレンドと市場の状況
· 現在の価格:約0.9149 USDT
· 24時間変動:-0.27%(やや弱気の偏り)
· 長期トレンド:高時間足で深く弱気(1年で約72%下落)
📈 主要指標
ボリンジャーバンド(20,2)
· 上バンド:0.9297
· 中央バンド:0.9166
· 下バンド:0.9035
· 観察:価格は中央バンド以下、下バンド付近で取引されており、弱気の勢いと売られ過ぎの可能性を示唆。
SAR(0.02, 0.02, 0.2)
· 値:0.9112
· 解釈:SARは現在価格より下にあり、短期的にはやや強気のシグナルだが、接近しているため弱い追随を示唆。
MACD(12,26,9)
· MACDライン:0.0009
· DIF:-0.0007
· DEA:-0.0016
· シグナル:MACDがDEAを上抜け(弱い強気のクロスオーバー)、しかしヒストグラムは小さく、勢いは低い。
出来高
· 24時間取引量(SUI):580万 — 比較的低い取引量で、両側の強い確信の欠如を示唆。
🧩 サポートとレジスタンス
· 即時サポート:~0.9035(下バンド) / 0.8737(最近のスイング安値)
· 即時レジスタンス
SUI4.71%
- 報酬
- 2
- コメント
- リポスト
- 共有
#WCTCTradingKingPK
**トレーディングアリーナを制覇する:規律の力**
あなたはこれまでに、志望するトレーダーが失敗するのを目撃したことがありますか?知識不足ではなく、純粋な混乱からですか?あまりにも頻繁に、トレーダーはツールや戦術を武器に市場に飛び込みながらも、つまずいてしまいます。
**では、何が欠けているのでしょうか?**
それは複雑なアルゴリズムや最新の市場トレンドではありません。トレーディング成功の背骨:規律です。
**プレッシャーが高まるとき—ポートフォリオが打撃を受けたとき—成功者は混乱ではなく冷静さをもって対処します。**
なぜほとんどのトレーダーはつまずくのか?
市場は実力主義ではありません;才能を報いるわけではありません。むしろ、ストレス下での反応を評価します。
1. しっかりとした計画を立てたのに、恐怖が忍び寄ると崩れてしまう。
2. ストップロスを設定したのに、パニックで調整してしまう。
3. 早期利益を確定した後、市場があなた抜きで上昇するのを見てしまう。
これは単なる戦略の問題ではなく—揺るぎない規律を築くことに関わっています。
**一貫性は、市場の気まぐれに関係なく、計画に忠実に従うことで鍛えられます。**
トレーディング規律の7つの重要な柱
1. **書き出す:あなたのトレーディングプランは重要です**
- 進入と退出の戦略
原文表示**トレーディングアリーナを制覇する:規律の力**
あなたはこれまでに、志望するトレーダーが失敗するのを目撃したことがありますか?知識不足ではなく、純粋な混乱からですか?あまりにも頻繁に、トレーダーはツールや戦術を武器に市場に飛び込みながらも、つまずいてしまいます。
**では、何が欠けているのでしょうか?**
それは複雑なアルゴリズムや最新の市場トレンドではありません。トレーディング成功の背骨:規律です。
**プレッシャーが高まるとき—ポートフォリオが打撃を受けたとき—成功者は混乱ではなく冷静さをもって対処します。**
なぜほとんどのトレーダーはつまずくのか?
市場は実力主義ではありません;才能を報いるわけではありません。むしろ、ストレス下での反応を評価します。
1. しっかりとした計画を立てたのに、恐怖が忍び寄ると崩れてしまう。
2. ストップロスを設定したのに、パニックで調整してしまう。
3. 早期利益を確定した後、市場があなた抜きで上昇するのを見てしまう。
これは単なる戦略の問題ではなく—揺るぎない規律を築くことに関わっています。
**一貫性は、市場の気まぐれに関係なく、計画に忠実に従うことで鍛えられます。**
トレーディング規律の7つの重要な柱
1. **書き出す:あなたのトレーディングプランは重要です**
- 進入と退出の戦略

- 報酬
- 2
- 4
- リポスト
- 共有
EqunixHub:
アペ・イン 🚀もっと見る
$SOL #BitcoinSpotVolumeNewLow
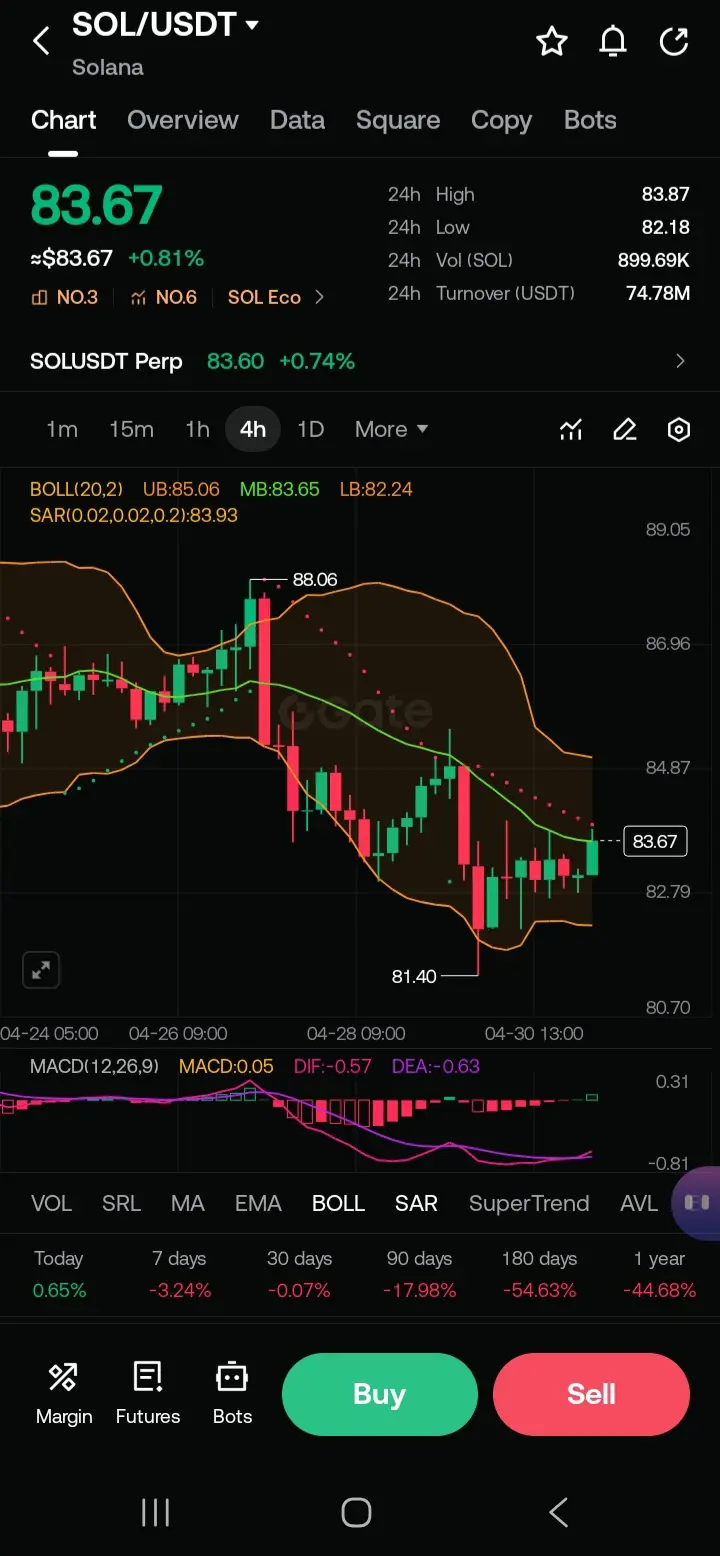
提供されたSOL/USDTチャートに対して、ライン・テクニカル分析を行います。主要な指標と価格動向を分析します。
価格動向の概要
- **現在の価格**:83.67 USDT
- **高値**:83.87 USDT
- **安値**:82.18 USDT
- **24時間変動率**:+0.81%
価格は比較的安定した範囲を示し、最近の動きの上部付近に留まっています。
ローソク足パターン(Kline)
- **最近のローソク足**:直近のローソク足の形成に基づき、強気または弱気のシグナルを探します。高値または安値の連続はありますか?
- ローソクの色を評価します—緑のローソクは強気の動きを示し、赤のローソクは弱気の動きを示します。
ボリンジャーバンド
**上バンド**:88.85
- **下バンド**:82.84
- **ミドルバンド(SMA)**:85.85
解釈
現在の価格はミドルバンド以下にあり、弱気のセンチメントや反転前の調整を示す可能性があります。
- 価格が上バンドを突破すれば上昇ブレイクアウトを示唆し、逆に下バンドを割ると追加の弱気圧力を示すかもしれません。
指数移動平均線(EMA)
- **単純移動平均(SMA)**と**指数移動平均(EMA)**のトレンドとクロスを分析します:
- 現在の価格が
SOL3.11%

- 報酬
- 2
- コメント
- リポスト
- 共有
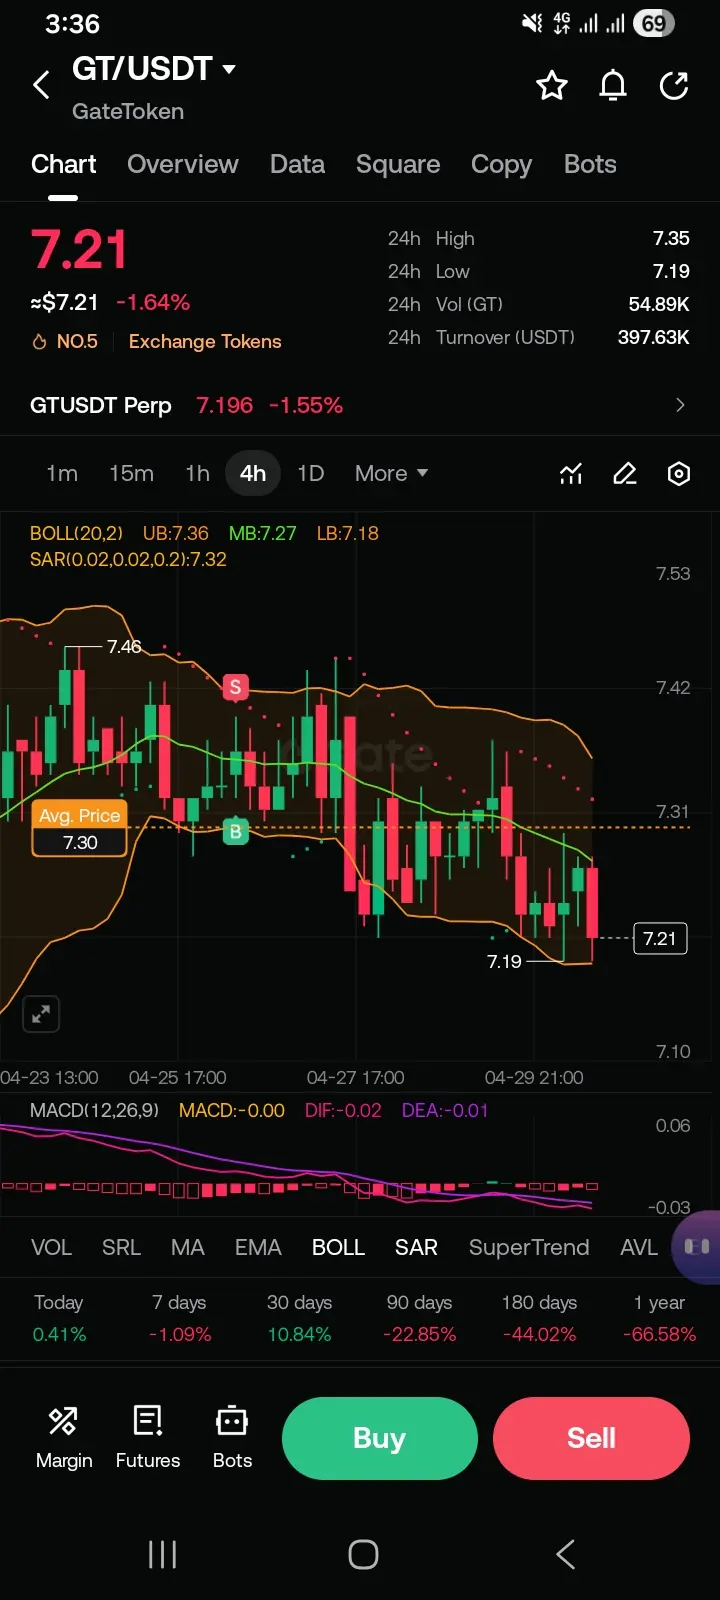
#CryptoMarketsDipSlightly $GT
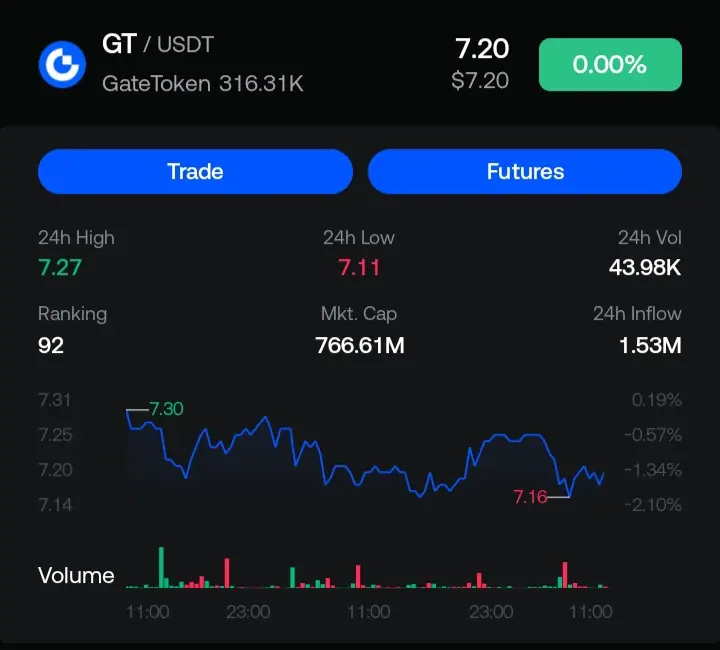
GT/USDTチャート、詳細なローソク足のテクニカル分析です。
1. 全体市場の状況
· 資産:GT/USDT(GateToken) – 取引所トークンで5位。
· 現在価格:≈ $7.21
· 24時間変動:-1.64%(非常に短期的にはやや弱気の偏り)。
· 長期パフォーマンス(1年):-66.58% → 高い時間軸(週次/月次)での強い構造的下落トレンド。
· 30日間のパフォーマンス:+10.84% → 長期的な弱気市場内での最近の短期リリーフ反発。
2. 現在の4時間足ローソク(主要分析期間)
· 最後のローソクの状態:弱気の赤い陽線(終値またはほぼ終値が7.21、最高値7.35から)。
· 形成:セッションの安値付近(7.19–7.21)で推移、7.35からのリジェクション後。高値で売り圧力を示す。
3. 重要なサポート&レジスタンスレベル
レベル 価格(USDT) 重要性
レジスタンス1 7.35 24時間高値 / 最近のリジェクションゾーン
レジスタンス2 7.46 チャート注釈エリア(前回のスイング高値)
平均価格 7.30 ダイナミックレジスタンス(値域高値)
現在価格 7.21 弱まる買い圧力ゾーン
サポート1 7.19 24時間安値(薄氷状態)
サポート2 7.18 ボリンジャー下バンド(LB)
GT0.13%

- 報酬
- 2
- コメント
- リポスト
- 共有