🚨 $BTC IS FOLLOWING INVERSE HEAD AND SHOULDERS PATTERN
Market has already formed 3 key parts of structure:
1. Left shoulder: $108k
2. Head: $126k
3. Right shoulder: $97k
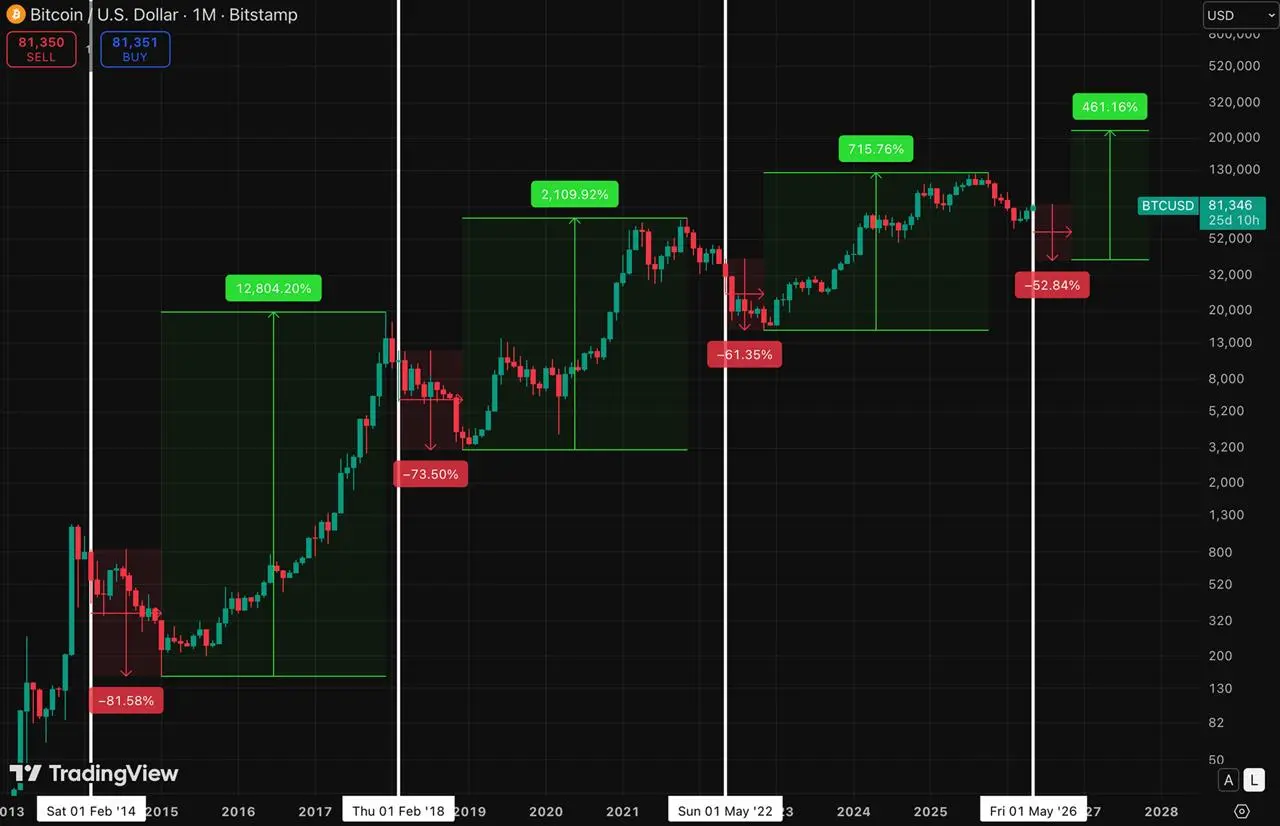
The same pattern appeared in 2021, before market dropped from $52k → $32k within months
This isn’t bait - it’s a recurring cycle structure seen over and over again
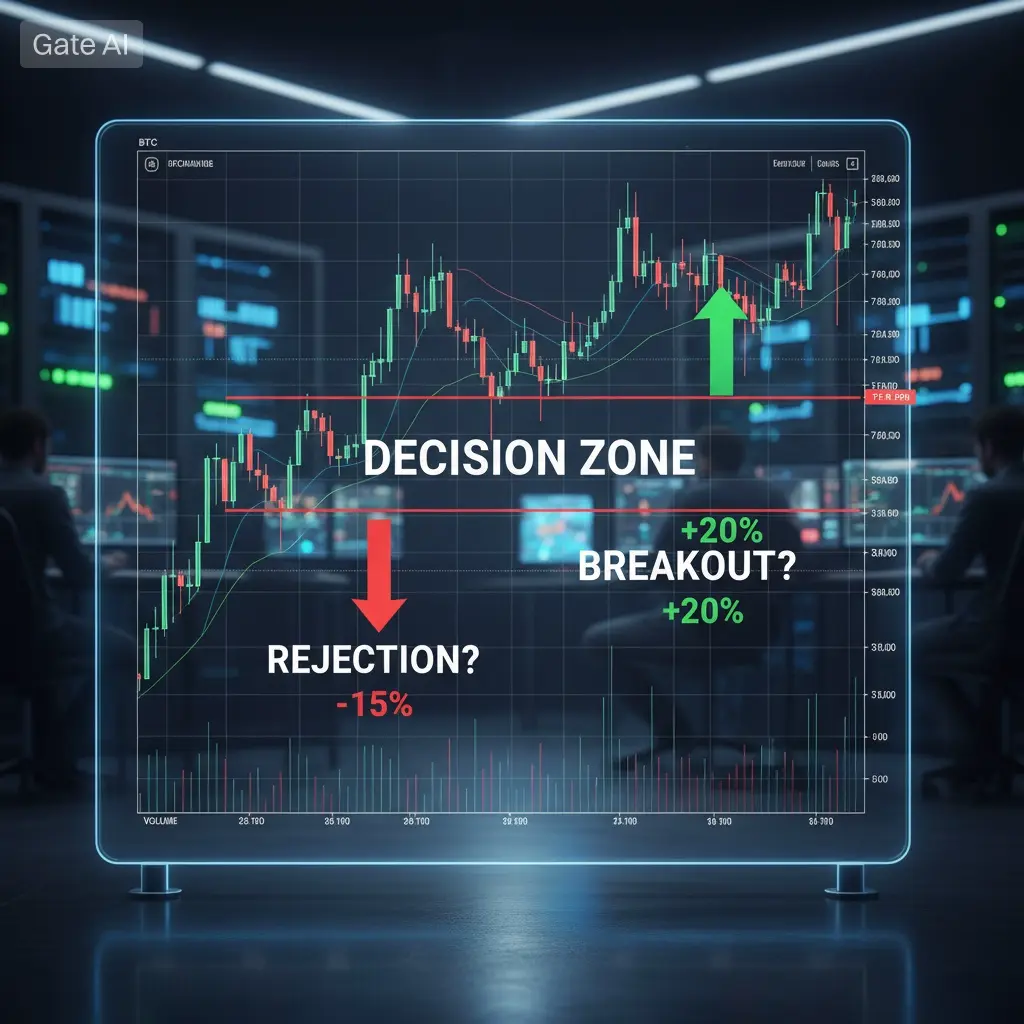
So what’s likely next?
→ Breakdown below $60k
→ Short-term accumulation
→ Final bottom formation around $52k-$49k
Market is showing more and more signs of a major downside move, while retail still believes “bull run has started”
Be prepared for a heavy dump!
#GateSquareMayTradingShare
Market has already formed 3 key parts of structure:
1. Left shoulder: $108k
2. Head: $126k
3. Right shoulder: $97k
The same pattern appeared in 2021, before market dropped from $52k → $32k within months
This isn’t bait - it’s a recurring cycle structure seen over and over again
So what’s likely next?
→ Breakdown below $60k
→ Short-term accumulation
→ Final bottom formation around $52k-$49k
Market is showing more and more signs of a major downside move, while retail still believes “bull run has started”
Be prepared for a heavy dump!
#GateSquareMayTradingShare