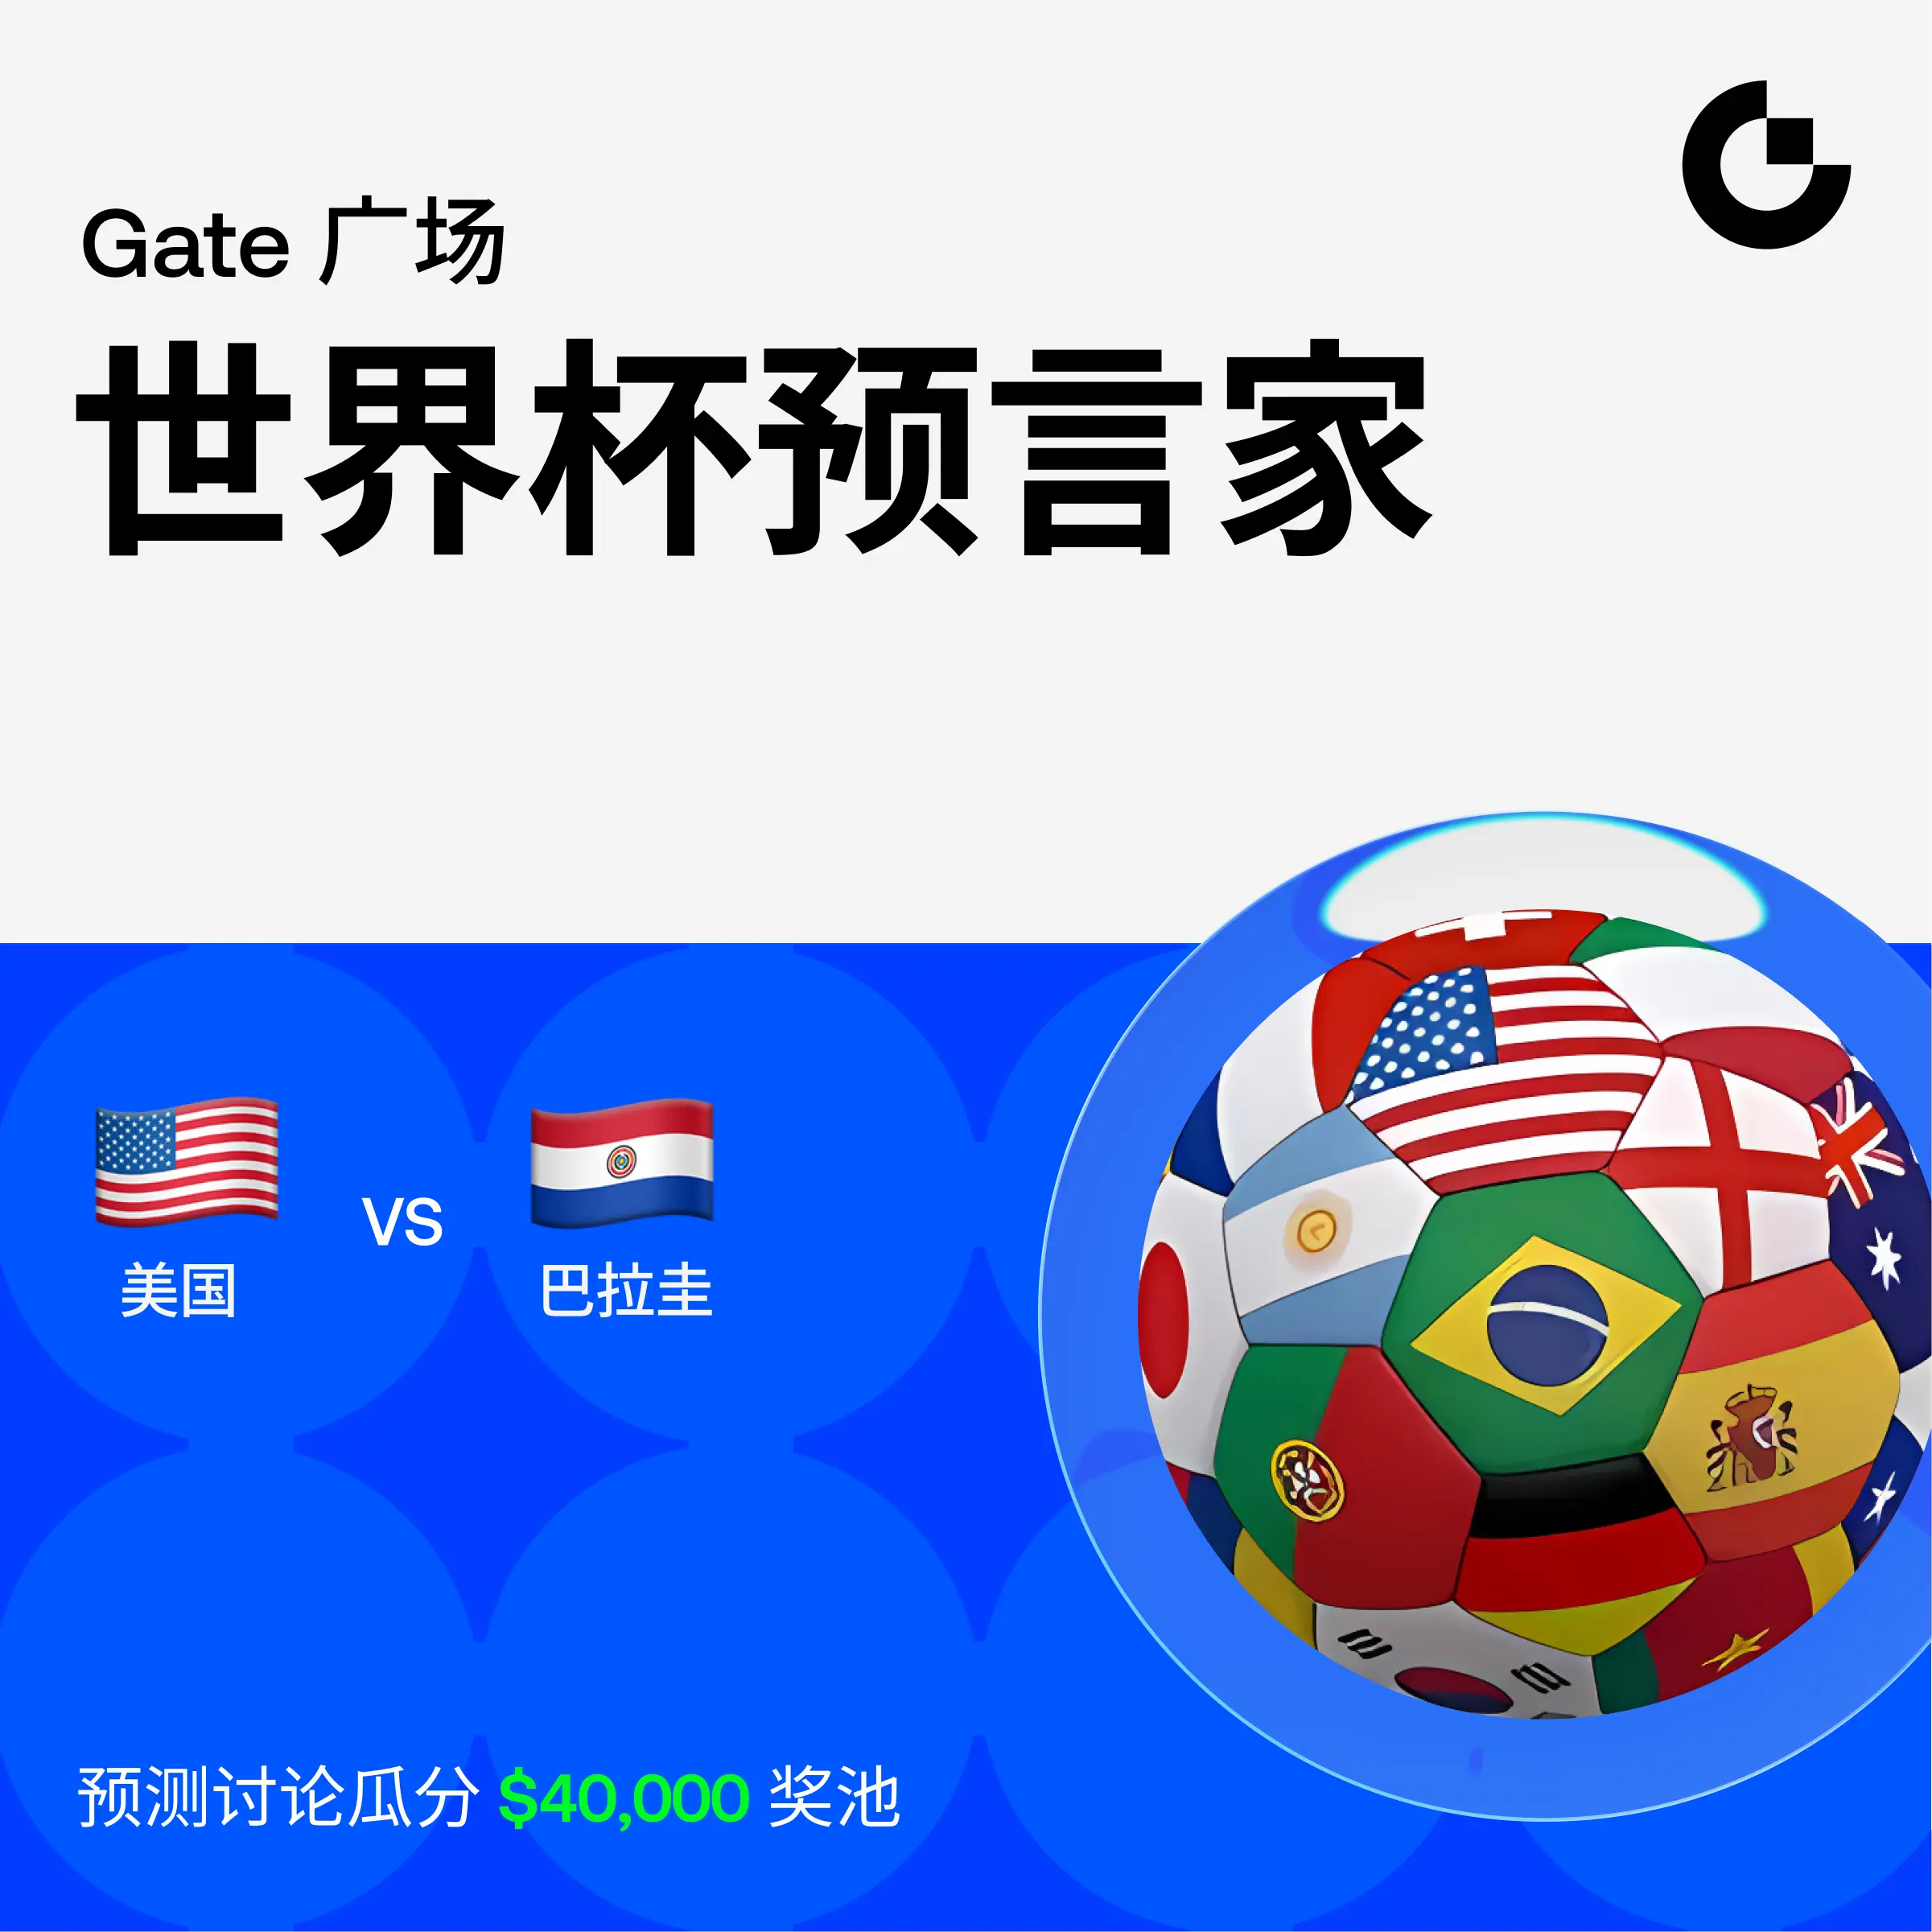
#PredictWorldCup🇺🇸vs🇵🇾
The FIFA World Cup 2026 continues with an exciting Group D encounter between the United States and Paraguay. As one of the tournament hosts, the USA will enjoy home support and familiar conditions, while Paraguay arrives determined to prove itself against one of the region’s strongest opponents. Both teams know that securing points in the opening stages can play a crucial role in qualification, making this fixture highly significant.
Match Overview
The United States enters the tournament with a talented squad capable of playing high-tempo football, pressing aggressively, and creating chances through quick transitions. Playing at home could provide an additional psychological advantage, as the crowd support may help the team maintain momentum during difficult moments.
Paraguay, meanwhile, has built its reputation on disciplined defending, physical battles in midfield, and organized tactical play. The team often focuses on limiting opponents’ opportunities before looking to strike on counterattacks or capitalize on set pieces. Their experience against strong South American competition prepares them well for high-pressure situations
Current Expectations and Market Sentiment
Prediction markets currently view this as a relatively balanced contest with a slight edge for the United States.
USA Win Probability: Approximately 49–50%
Draw Probability: Approximately 28–29%
Paraguay Win Probability: Approximately 23–24%
These figures suggest confidence in the United States but also acknowledge that Paraguay has realistic chances of earning points. The narrow difference between outcomes highlights how competitive this matchup could become.
United States Team Analysis
The American squad combines youth, speed, and technical quality across multiple positions. Players capable of carrying the ball forward and pressing high up the pitch make the USA dangerous in transition.
Key strengths include:
Fast attacking movement
Strong wing play
High pressing tactics
Home crowd advantage
Athletic midfield capable of covering large areas
However, occasional defensive lapses and inconsistency against organized opponents remain areas that require improvement. If the USA struggles to break Paraguay’s defensive shape early, frustration could become a factor.
Paraguay Team Analysis
Paraguay traditionally relies on defensive discipline and teamwork rather than individual brilliance. The team often prioritizes compact positioning and looks for opportunities through long balls, crosses, and set pieces.
Major strengths include:
Physical defending
Tactical organization
Counterattacking ability
Strong aerial presence
Experience in difficult competitive matches
Their biggest challenge may be generating enough attacking opportunities if forced to defend for extended periods against sustained American pressure.
Tactical Battle
The key tactical contest will likely revolve around possession versus defensive organization.
The United States may attempt to dominate possession, stretch the field, and create overloads on the wings. Paraguay could respond by sitting deeper, limiting space between defensive lines, and forcing the Americans into low-percentage crossing situations.
Midfield battles will be extremely important. Whichever team controls second balls and transitions could gain a decisive advantage.
Key Factors That Could Decide the Match
Home advantage for the United States
Paraguay’s disciplined defensive setup
Efficiency in front of goal
Performance during set pieces
Midfield control and ball recovery
Tactical adjustments after halftime
Individual moments of quality
Mental composure under pressure
Possible Score Scenarios
Several realistic outcomes stand out based on current form and tactical styles:
USA 1–0 Paraguay
USA 2–1 Paraguay
1–1 Draw
Paraguay 1–0 USA if they successfully frustrate the American attack
A low-scoring match appears more likely than an open, high-scoring encounter due to Paraguay’s defensive approach.
My Prediction
Based on available information, I believe the United States holds a slight advantage entering this fixture. Home support and attacking quality could prove enough to secure three points, although Paraguay possesses the discipline to make the match extremely competitive.
My projected result is a narrow 2–1 victory for the United States, but football remains unpredictable and alternative outcomes remain entirely possible.
Group Stage Importance
Opening matches often shape the momentum of an entire World Cup campaign. A victory would place either team in a stronger position for qualification, while even a single point could become valuable depending on other group results.
For the USA, starting with a win would boost confidence in front of home supporters. For Paraguay, avoiding defeat against the host nation could provide significant momentum heading into later fixtures.
Gate Prediction Market
Gate offers a dedicated World Cup prediction section where users can follow tournament schedules, standings, and prediction events in one place. After updating to the latest version of the Gate App, users can access match-related prediction opportunities and monitor changing market sentiment throughout the competition.
The platform also features the "Green Field Prophet, World Cup Prediction Carnival," covering every World Cup match with multiple participation options and promotional reward campaigns.
Before making any prediction, users should evaluate team news, tactical developments, injuries, and recent performances to form their own independent assessment.
Investment Mindset for Prediction Markets
Prediction markets should be approached with discipline and realistic expectations. Football outcomes depend on countless variables including injuries, referee decisions, tactical adjustments, and unexpected moments.
Rather than relying solely on public sentiment, participants may benefit from combining statistical analysis, historical performance, and current form before making decisions.
Final Thoughts
USA versus Paraguay promises to be one of the more interesting contests of the group stage. The Americans possess home advantage, attacking quality, and positive momentum, while Paraguay brings resilience, structure, and tournament experience that could make life difficult for any opponent.
Although current expectations lean slightly toward the United States, the relatively balanced probabilities show that no result should be considered certain. Fans can expect an intense tactical battle where patience, efficiency, and small moments may ultimately determine the winner.
Whether supporting the host nation or backing Paraguay’s determined challenge, this fixture should provide an entertaining showcase of World Cup football and could have lasting implications for Group D qualification.
@Gate_Square