2025 ABTPrice Prediction: Analyzing Market Trends and Potential Growth Factors for ABT Token
Introduction: ABT's Market Position and Investment Value
ArcBlock (ABT), as a blockchain ecosystem for building and deploying decentralized applications, has made significant strides since its inception in 2018. As of 2025, ArcBlock's market capitalization has reached $57,886,176, with a circulating supply of approximately 98,580,000 tokens, and a price hovering around $0.5872. This asset, known as a "blockchain ecosystem enabler," is playing an increasingly crucial role in the development and deployment of decentralized applications.
This article will comprehensively analyze ArcBlock's price trends from 2025 to 2030, combining historical patterns, market supply and demand, ecosystem development, and macroeconomic factors to provide investors with professional price predictions and practical investment strategies.
I. ABT Price History Review and Current Market Status
ABT Historical Price Evolution Trajectory
- 2020: Market low, price dropped to $0.04949826 on March 13
- 2024: All-time high, price reached $4.69 on May 22
- 2025: Significant decline, price fell by 67.78% over the past year
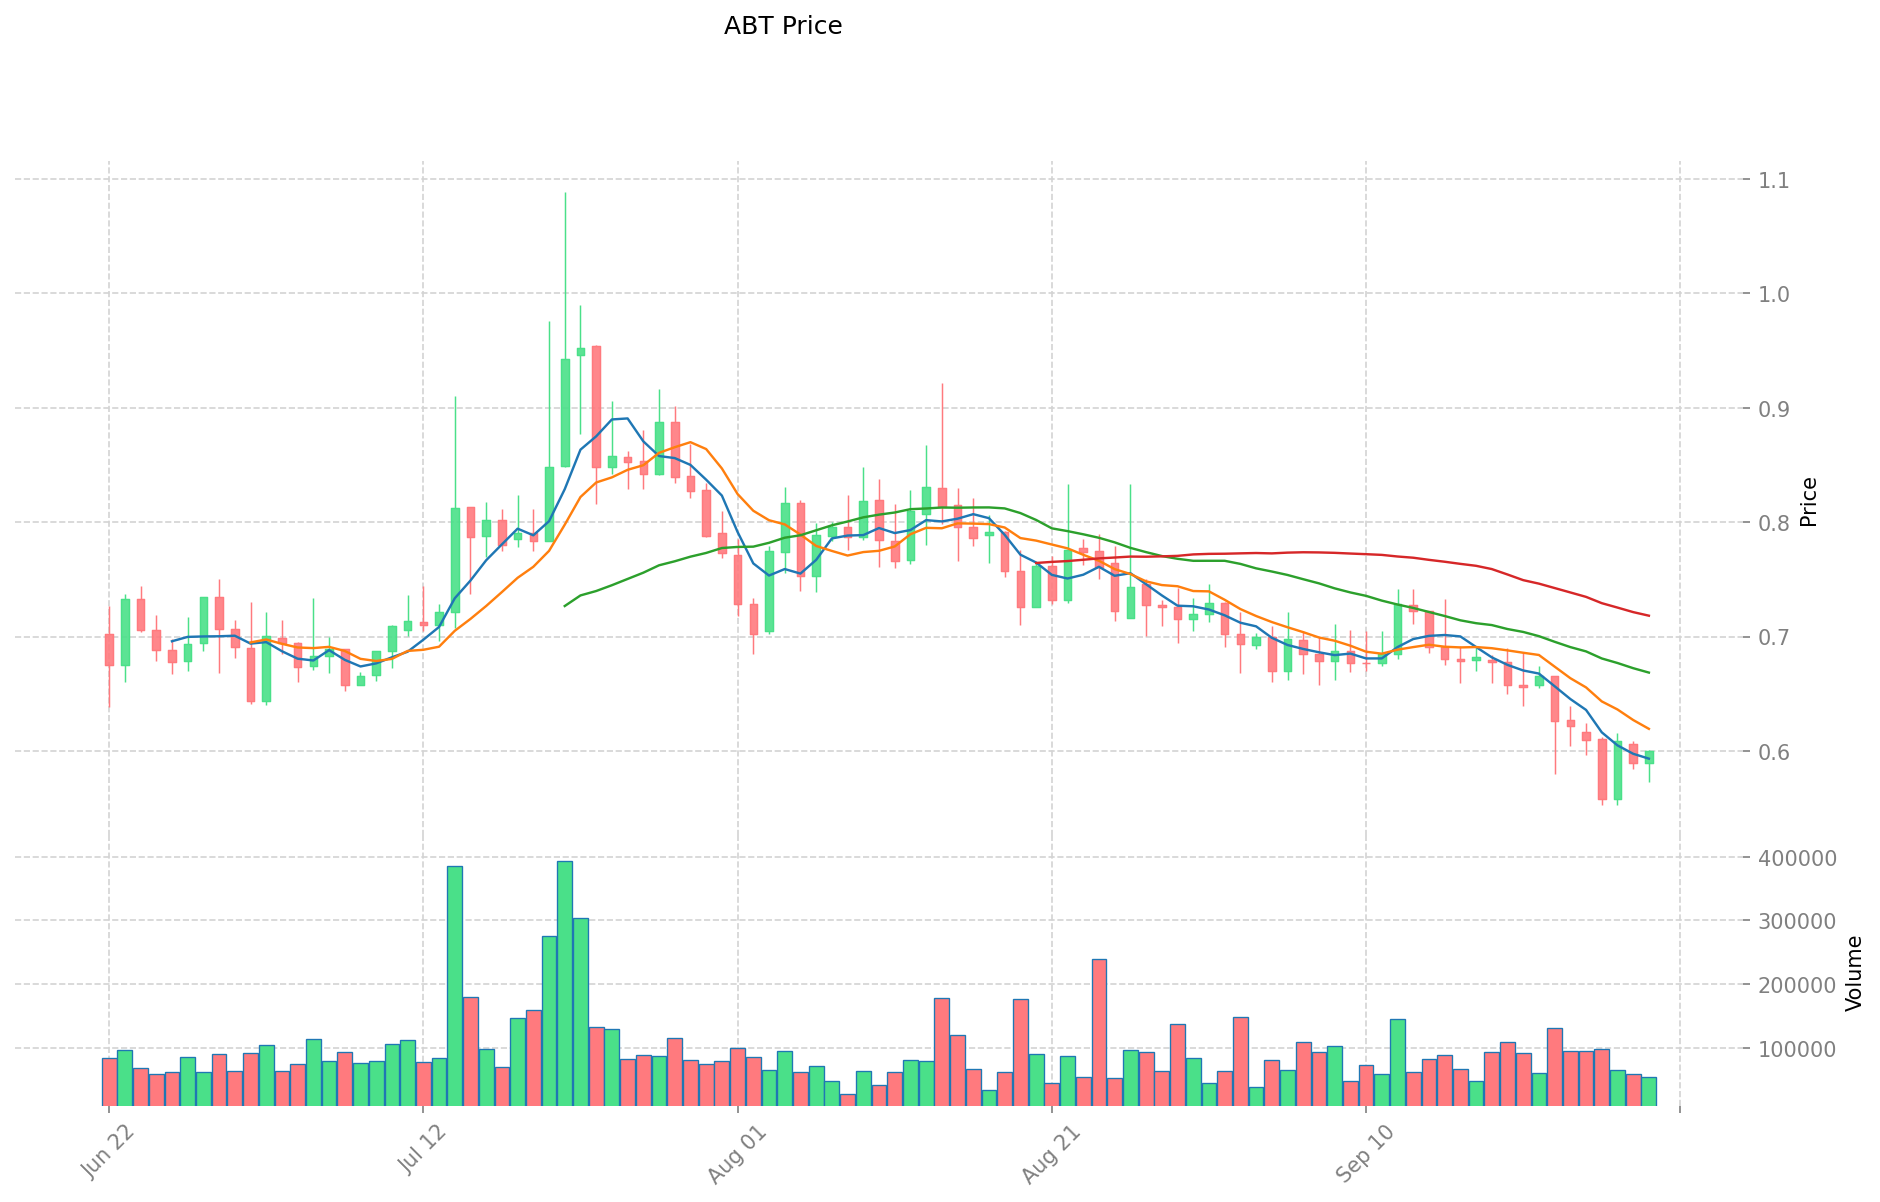
ABT Current Market Situation
As of September 29, 2025, ABT is trading at $0.5872. The token has experienced a slight increase of 0.41% in the past 24 hours, with a trading volume of $36,361.65. ABT's market capitalization currently stands at $57,886,176, ranking it 631st in the overall cryptocurrency market. The circulating supply is 98,580,000 ABT, which represents 53% of the total supply of 186,000,000 tokens. Despite the recent positive daily performance, ABT has shown a negative trend over longer periods, with a 6.72% decrease in the past week and an 18.86% decline over the last month.
Click to view the current ABT market price
ABT Market Sentiment Indicator
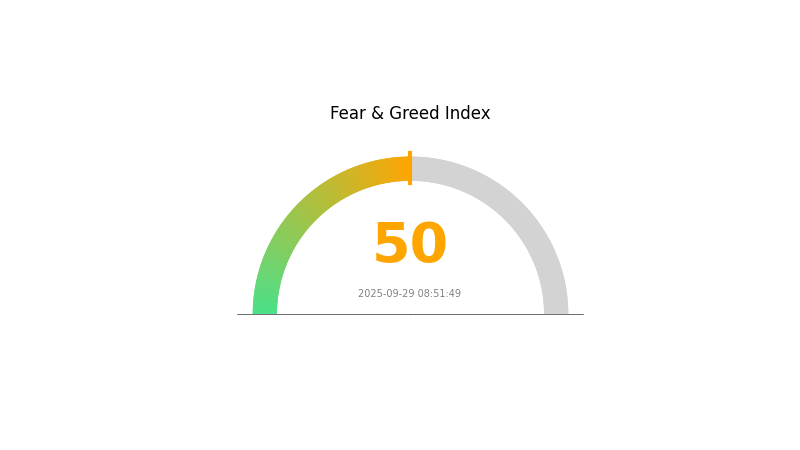
2025-09-29 Fear and Greed Index: 50 (Neutral)
Click to view the current Fear & Greed Index
The cryptocurrency market sentiment remains balanced today, with the Fear and Greed Index at 50, indicating a neutral stance. This equilibrium suggests that investors are neither overly pessimistic nor excessively optimistic about the market's direction. Such a neutral reading often presents opportunities for careful analysis and strategic decision-making. Traders and investors should stay vigilant, as market conditions can shift rapidly in either direction from this balanced state.
ABT Holdings Distribution
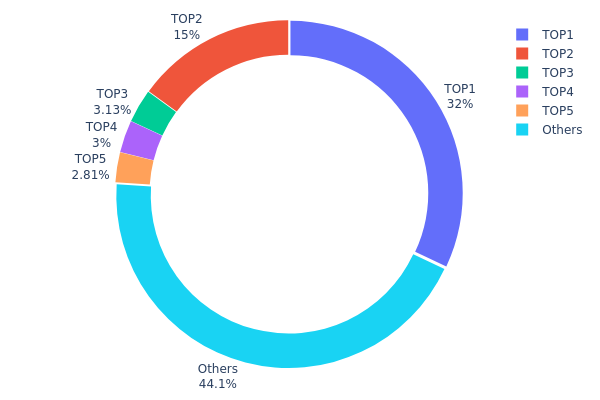
The address holdings distribution data provides insights into the concentration of ABT tokens across different wallet addresses. Analyzing this data reveals a significant concentration of ABT tokens among the top holders. The top address holds 32% of the total supply, while the second-largest holder possesses 15%. Together, the top two addresses control 47% of all ABT tokens, indicating a high degree of centralization.
This concentration pattern raises concerns about potential market manipulation and price volatility. With nearly half of the tokens controlled by just two addresses, any significant movement from these wallets could have a substantial impact on ABT's market dynamics. The remaining top holders (3rd to 5th) each control between 2.81% to 3.13%, which, while smaller, still represent significant stakes.
The distribution data suggests a relatively low level of decentralization for ABT, with 55.94% of tokens held by the top 5 addresses. This concentration could potentially affect the token's on-chain governance and overall market stability. However, the 44.06% held by other addresses indicates some level of distribution among smaller holders, which could provide some balance to the ecosystem.
Click to view the current ABT Holdings Distribution
| Top | Address | Holding Qty | Holding (%) |
|---|---|---|---|
| 1 | 0x58f2...017484 | 59520.00K | 32.00% |
| 2 | 0xa63f...ae5508 | 27900.00K | 15.00% |
| 3 | 0xc205...3fc6f5 | 5825.21K | 3.13% |
| 4 | 0x3586...f10d20 | 5584.28K | 3.00% |
| 5 | 0xc635...af0b40 | 5231.63K | 2.81% |
| - | Others | 81938.88K | 44.06% |
II. Key Factors Influencing ABT's Future Price
Institutional and Whale Dynamics
- Institutional Holdings: Analysts predict moderate growth for ABT, with current target prices ranging from $135 to $155.
- Corporate Adoption: Abbott Laboratories continues to be a key player in the healthcare sector, with its FreeStyle Libre continuous glucose monitoring system driving growth.
- Government Policies: Volume-based procurement (VBP) projects in China remain a factor affecting diagnostic sales.
Macroeconomic Environment
- Monetary Policy Impact: Market volatility can affect account access and trade execution, potentially impacting ABT's performance.
- Geopolitical Factors: Economic, competitive, governmental, and technological factors may influence Abbott's operations.
Technical Development and Ecosystem Building
- Diabetes Care: The FreeStyle Libre system is a crucial growth driver, with analysts forecasting a 17.5% year-over-year increase in diabetes care sales.
- Emerging Markets: Continued double-digit organic growth is expected in key emerging markets such as Southeast Asia, the Middle East, and Africa, driving performance in the Established Pharmaceuticals Division (EPD).
- Ecosystem Applications: Abbott's focus on nutrition, especially in the U.S. pediatric and adult nutrition segments, is expected to contribute to growth despite the discontinuation of ZonePerfect® production in March 2024.
III. ABT Price Prediction for 2025-2030
2025 Outlook
- Conservative prediction: $0.45809 - $0.5873
- Neutral prediction: $0.5873 - $0.72532
- Optimistic prediction: $0.72532 - $0.86333 (requires favorable market conditions)
2027-2028 Outlook
- Market phase expectation: Potential growth phase
- Price range forecast:
- 2027: $0.5194 - $1.0388
- 2028: $0.76 - $1.27604
- Key catalysts: Increasing adoption and technological advancements
2029-2030 Long-term Outlook
- Base scenario: $0.84864 - $1.16251 (assuming steady market growth)
- Optimistic scenario: $1.16251 - $1.38339 (assuming strong market performance)
- Transformative scenario: Above $1.38339 (extreme favorable conditions)
- 2030-12-31: ABT $1.16251 (97% growth from 2025)
| 年份 | 预测最高价 | 预测平均价格 | 预测最低价 | 涨跌幅 |
|---|---|---|---|---|
| 2025 | 0.86333 | 0.5873 | 0.45809 | 0 |
| 2026 | 0.95016 | 0.72532 | 0.6818 | 23 |
| 2027 | 1.0388 | 0.83774 | 0.5194 | 42 |
| 2028 | 1.27604 | 0.93827 | 0.76 | 59 |
| 2029 | 1.21787 | 1.10716 | 0.77501 | 88 |
| 2030 | 1.38339 | 1.16251 | 0.84864 | 97 |
IV. Professional ABT Investment Strategies and Risk Management
ABT Investment Methodology
(1) Long-term Holding Strategy
- Suitable for: Risk-tolerant investors with a long-term perspective
- Operational suggestions:
- Accumulate ABT during market dips
- Set price targets for partial profit-taking
- Store ABT in secure hardware wallets
(2) Active Trading Strategy
- Technical analysis tools:
- Moving Averages: Use to identify trends and support/resistance levels
- RSI (Relative Strength Index): Gauge overbought/oversold conditions
- Key points for swing trading:
- Monitor market sentiment and news catalysts
- Set stop-loss orders to limit downside risk
ABT Risk Management Framework
(1) Asset Allocation Principles
- Conservative investors: 1-3% of crypto portfolio
- Aggressive investors: 5-10% of crypto portfolio
- Professional investors: Up to 15% of crypto portfolio
(2) Risk Hedging Solutions
- Diversification: Spread investments across multiple crypto assets
- Stop-loss orders: Implement to limit potential losses
(3) Secure Storage Solutions
- Hot wallet recommendation: Gate web3 wallet
- Cold storage solution: Hardware wallets for long-term holdings
- Security precautions: Enable two-factor authentication, use strong passwords
V. Potential Risks and Challenges for ABT
ABT Market Risks
- High volatility: ABT price can experience significant fluctuations
- Limited liquidity: May face challenges in executing large trades
- Market sentiment: Susceptible to broader crypto market trends
ABT Regulatory Risks
- Uncertain regulations: Potential for new laws affecting ABT's operations
- Compliance challenges: Adapting to evolving regulatory requirements
- Cross-border restrictions: Possible limitations on international transactions
ABT Technical Risks
- Smart contract vulnerabilities: Potential for exploits or bugs
- Scalability issues: Challenges in handling increased network load
- Competitive pressures: Emerging blockchain platforms may threaten ABT's market position
VI. Conclusion and Action Recommendations
ABT Investment Value Assessment
ABT presents a high-risk, high-potential investment opportunity within the blockchain ecosystem. While it offers innovative solutions for decentralized applications, investors should be aware of its significant volatility and regulatory uncertainties.
ABT Investment Recommendations
✅ Beginners: Start with small positions, focus on education and risk management ✅ Experienced investors: Consider ABT as part of a diversified crypto portfolio ✅ Institutional investors: Conduct thorough due diligence and implement robust risk controls
ABT Trading Participation Methods
- Spot trading: Buy and hold ABT on Gate.com
- DCA (Dollar-Cost Averaging): Regularly purchase small amounts to mitigate price volatility
- Staking: Participate in ABT staking programs if available to earn passive income
Cryptocurrency investments carry extremely high risks, and this article does not constitute investment advice. Investors should make decisions cautiously based on their own risk tolerance and are advised to consult professional financial advisors. Never invest more than you can afford to lose.
FAQ
What is the price target for ABT in 2025?
Based on current projections, the average price target for ABT in 2025 is $120.48, with a high estimate of $147.28 and a low estimate of $93.69.
Is ABT stock a good buy?
Yes, ABT stock is considered a good buy. Analysts give it a consensus 'Buy' rating, despite a slight projected decline from $132.38 to $127.81.
What are analysts' price targets for Abbott?
Analysts' average price target for Abbott is $145.22, with the highest target at $160, based on current forecasts.
Is arcblock an AI coin?
Yes, ArcBlock is considered an AI-focused cryptocurrency. It emphasizes AI integration in its applications and has not sold coins since its 2018 ICO.
Share
Content
Introduction: ABT's Market Position and Investment Value
I. ABT Price History Review and Current Market Status
II. Key Factors Influencing ABT's Future Price
III. ABT Price Prediction for 2025-2030
IV. Professional ABT Investment Strategies and Risk Management
V. Potential Risks and Challenges for ABT
VI. Conclusion and Action Recommendations
FAQ

