2025 C Price Prediction: Navigating Market Trends and Economic Factors for Future Valuations
Introduction: C's Market Position and Investment Value
Chainbase (C), as a foundational layer for the DataFi era, has made significant strides since its inception. As of 2025, Chainbase's market capitalization has reached $14,577,600, with a circulating supply of approximately 160,000,000 tokens, and a price hovering around $0.09111. This asset, dubbed the "Hyperdata Network for AI," is playing an increasingly crucial role in transforming fragmented onchain signals into structured, verifiable, and AI-ready data.
This article will comprehensively analyze Chainbase's price trends from 2025 to 2030, considering historical patterns, market supply and demand, ecosystem development, and macroeconomic factors to provide investors with professional price predictions and practical investment strategies.
I. C Price History Review and Current Market Status
C Historical Price Evolution
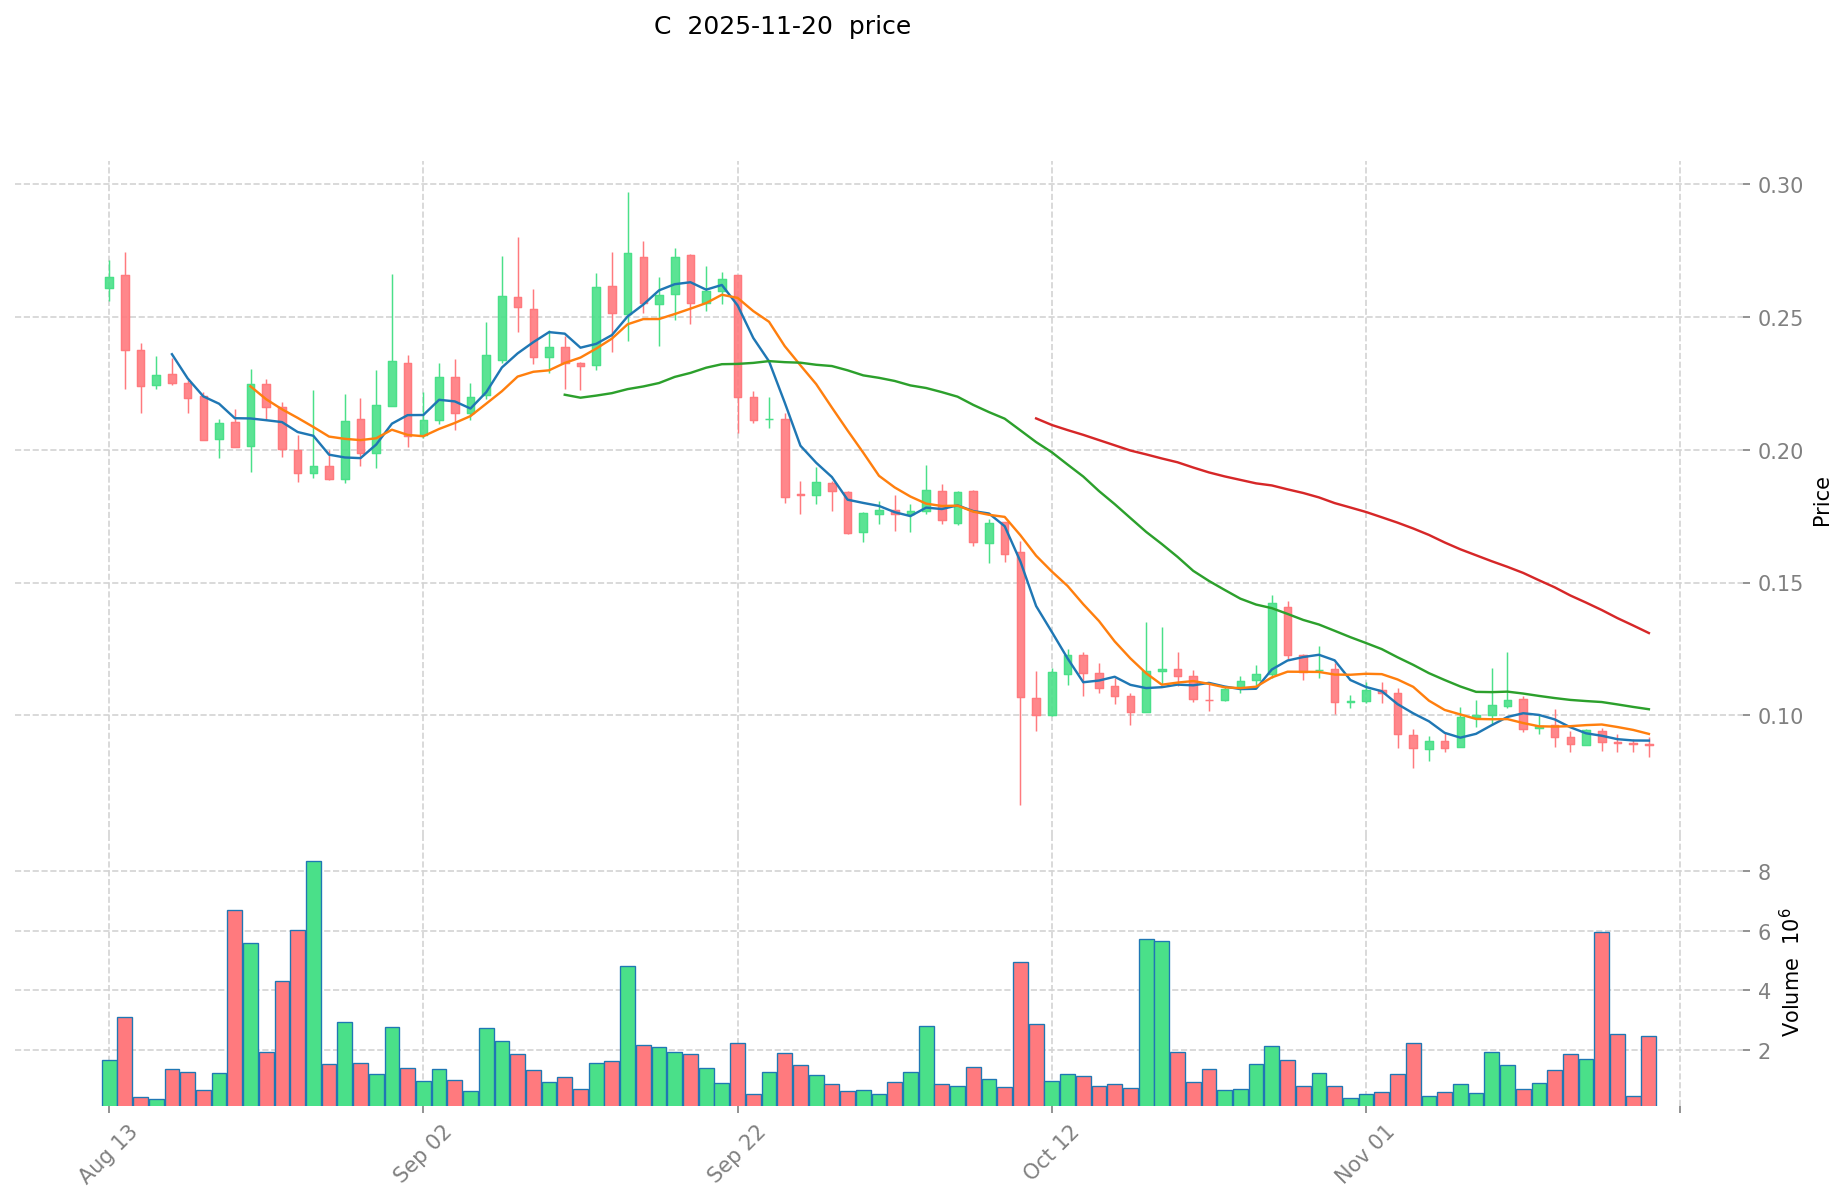
- July 2025: C reached its all-time high of $0.5396, marking a significant milestone for the project.
- October 2025: The token experienced its all-time low of $0.0661, indicating a substantial market correction.
- November 2025: C has shown recovery, with the current price at $0.09111, representing a 66.94% increase over the past year.
C Current Market Situation
As of November 20, 2025, C is trading at $0.09111. The token has experienced mixed performance across different timeframes. In the past 24 hours, C has seen a 2.59% increase, while the 7-day and 30-day trends show declines of 6.23% and 15.95% respectively. The current market cap stands at $14,577,600, with a circulating supply of 160,000,000 C tokens. The 24-hour trading volume is $416,187.21, indicating moderate market activity. C's market dominance is currently at 0.0027%, suggesting it's a relatively small player in the overall cryptocurrency market.
Click to view the current C market price
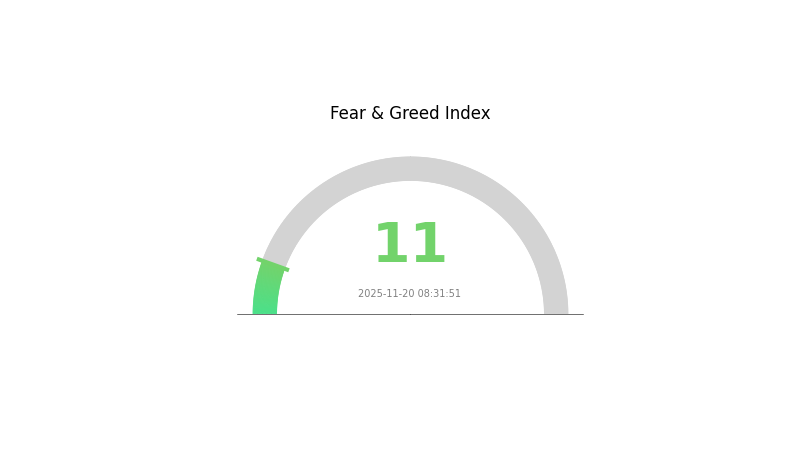
C Market Sentiment Indicator
2025-11-20 Fear and Greed Index: 11 (Extreme Fear)
Click to view the current Fear & Greed Index
The crypto market is gripped by extreme fear, with the index plummeting to 11. This level of pessimism often signals a potential buying opportunity for contrarian investors. However, caution is advised as market volatility may persist. Traders on Gate.com should consider dollar-cost averaging strategies and focus on projects with strong fundamentals. Remember, market cycles are natural, and extreme fear has historically preceded significant rallies. Stay informed and manage your risk carefully in these uncertain times.
C Holding Distribution
The address holding distribution chart for C reveals a highly concentrated ownership structure. The top address holds 28.34% of the total supply, followed by four other significant holders with 17%, 15%, 11.2%, and 8.69% respectively. Collectively, the top five addresses control 80.23% of C's supply, indicating a substantial concentration of assets.
This level of concentration raises concerns about market manipulation and volatility. With such a large portion of the supply controlled by a few addresses, there's potential for significant price swings if any of these major holders decide to sell or accumulate more tokens. The high concentration also suggests a lower degree of decentralization, which could impact the overall stability and fairness of the C ecosystem.
From a market structure perspective, this distribution indicates a relatively immature market with limited liquidity spread across a broader base of holders. The dominance of a few large addresses may deter smaller investors and could lead to reduced market efficiency. However, it's worth noting that 19.77% of the supply is held by other addresses, which provides some level of distribution and potential for future decentralization as the project evolves.
Click to view the current C Holding Distribution
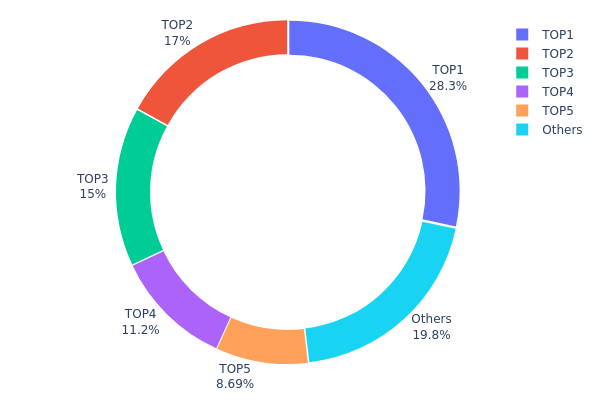
| Top | Address | Holding Qty | Holding (%) |
|---|---|---|---|
| 1 | 0x81e7...fdb2b2 | 283428.57K | 28.34% |
| 2 | 0x2219...4fb170 | 170000.00K | 17.00% |
| 3 | 0xee91...a6504b | 150000.00K | 15.00% |
| 4 | 0xff5a...931888 | 112000.00K | 11.20% |
| 5 | 0x2d49...950ccd | 86939.01K | 8.69% |
| - | Others | 197632.42K | 19.77% |
II. Key Factors Affecting C's Future Price
Supply Mechanism
- Halving: The periodic reduction of block rewards, which decreases the rate of new coin creation.
- Historical Pattern: Previous halvings have generally led to price increases due to reduced supply inflation.
- Current Impact: The upcoming halving is expected to potentially drive price appreciation, assuming demand remains steady or increases.
Macroeconomic Environment
- Monetary Policy Impact: Major central banks' policies on interest rates and quantitative easing will influence cryptocurrency market sentiment.
- Inflation Hedging Properties: C has shown some characteristics of an inflation hedge, potentially attracting investors during high inflation periods.
- Geopolitical Factors: Global political tensions and economic uncertainties may increase C's appeal as a borderless, decentralized asset.
Technical Development and Ecosystem Building
- Scalability Upgrades: Ongoing improvements to transaction throughput and network efficiency.
- Layer 2 Solutions: Development of second-layer protocols to enhance transaction speed and reduce fees.
- Ecosystem Applications: Growth in DeFi, NFTs, and other blockchain-based applications built on C's network.
III. C Price Prediction for 2025-2030
2025 Outlook
- Conservative prediction: $0.05556 - $0.08000
- Neutral prediction: $0.08000 - $0.09500
- Optimistic prediction: $0.09500 - $0.10201 (requires favorable market conditions and increased adoption)
2027-2028 Outlook
- Market stage expectation: Potential growth phase with increased volatility
- Price range forecast:
- 2027: $0.08573 - $0.11574
- 2028: $0.07690 - $0.15938
- Key catalysts: Technological advancements, wider institutional adoption, and potential regulatory clarity
2029-2030 Long-term Outlook
- Base scenario: $0.13541 - $0.16859 (assuming steady market growth and adoption)
- Optimistic scenario: $0.16859 - $0.20177 (assuming strong bullish trends and favorable regulatory environment)
- Transformative scenario: $0.20177 - $0.25000 (assuming breakthrough use cases and mainstream acceptance)
- 2030-11-20: C $0.18882 (potential peak before market correction)
| 年份 | 预测最高价 | 预测平均价格 | 预测最低价 | 涨跌幅 |
|---|---|---|---|---|
| 2025 | 0.10201 | 0.09108 | 0.05556 | 0 |
| 2026 | 0.11778 | 0.09654 | 0.08496 | 5 |
| 2027 | 0.11574 | 0.10716 | 0.08573 | 17 |
| 2028 | 0.15938 | 0.11145 | 0.0769 | 22 |
| 2029 | 0.20177 | 0.13541 | 0.10156 | 48 |
| 2030 | 0.18882 | 0.16859 | 0.1315 | 85 |
IV. Professional Investment Strategies and Risk Management for C
C Investment Methodology
(1) Long-term Holding Strategy
- Suitable for: Long-term value investors
- Operation suggestions:
- Accumulate C tokens during market dips
- Set price targets and stick to the plan
- Store tokens in secure hardware wallets
(2) Active Trading Strategy
- Technical analysis tools:
- Moving Averages: Use to identify trends
- RSI (Relative Strength Index): Monitor overbought/oversold conditions
- Key points for swing trading:
- Monitor market sentiment and news
- Set stop-loss orders to manage risk
C Risk Management Framework
(1) Asset Allocation Principles
- Conservative investors: 1-3%
- Aggressive investors: 5-10%
- Professional investors: 10-15%
(2) Risk Hedging Solutions
- Diversification: Spread investments across multiple cryptocurrencies
- Stop-loss orders: Implement to limit potential losses
(3) Secure Storage Solutions
- Hot wallet recommendation: Gate Web3 Wallet
- Cold storage solution: Hardware wallets for long-term holdings
- Security precautions: Use two-factor authentication, avoid public Wi-Fi for transactions
V. Potential Risks and Challenges for C
C Market Risks
- Volatility: Cryptocurrency markets can experience extreme price swings
- Liquidity: Lower trading volumes may lead to slippage
- Market sentiment: Susceptible to rapid changes based on news and trends
C Regulatory Risks
- Uncertain regulations: Potential for new laws affecting cryptocurrency trading
- Cross-border restrictions: Varying legal status in different jurisdictions
- Tax implications: Evolving tax treatments for cryptocurrency transactions
C Technical Risks
- Smart contract vulnerabilities: Potential for exploits in the underlying code
- Network congestion: Possible transaction delays during high network activity
- Technological obsolescence: Risk of being outpaced by newer blockchain technologies
VI. Conclusion and Action Recommendations
C Investment Value Assessment
C shows potential as a foundation for AI-driven data networks but faces significant market and regulatory uncertainties. Long-term value proposition is promising, but short-term volatility remains a concern.
C Investment Recommendations
✅ Newcomers: Start with small, regular investments to understand market dynamics ✅ Experienced investors: Consider a balanced approach with both long-term holding and active trading ✅ Institutional investors: Explore strategic partnerships and larger positions with proper risk management
C Trading Participation Methods
- Spot trading: Direct purchase and sale of C tokens on Gate.com
- Staking: Participate in staking programs if available for potential passive income
- DeFi integration: Explore decentralized finance options using C tokens
Cryptocurrency investments carry extremely high risks, and this article does not constitute investment advice. Investors should make decisions carefully based on their own risk tolerance and are advised to consult professional financial advisors. Never invest more than you can afford to lose.
FAQ
Is C stock a buy, sell, or hold?
Based on current market trends and potential growth, C stock appears to be a buy. The company's innovative projects and strong financial performance suggest upside potential in the near future.
What is the price target for C in 2025?
Based on current market trends and expert analysis, the price target for C in 2025 is projected to reach $50-$60 per token, reflecting significant growth potential in the coming years.
How much will Costco stock be worth in 2030?
Based on current growth trends, Costco stock could potentially reach $800-$1000 per share by 2030, driven by continued expansion and strong consumer loyalty.
Is Celestica a good buy now?
Yes, Celestica looks promising. Its strong financials and growing market share in the electronics manufacturing sector make it an attractive investment option in 2025.
Share
Content
Introduction: C's Market Position and Investment Value
I. C Price History Review and Current Market Status
II. Key Factors Affecting C's Future Price
III. C Price Prediction for 2025-2030
IV. Professional Investment Strategies and Risk Management for C
V. Potential Risks and Challenges for C
VI. Conclusion and Action Recommendations
FAQ

