2025 CETUS Price Prediction: Analyzing Growth Potential and Market Factors in the Evolving DeFi Landscape
Introduction: CETUS's Market Position and Investment Value
CETUS (CETUS) as a pioneering DEX and concentrated liquidity protocol built on the Sui and Aptos blockchain, has established itself as a significant player in the DeFi space since its inception. As of 2025, CETUS has a market capitalization of $64,612,405, with a circulating supply of approximately 846,376,811 tokens, and a price hovering around $0.07634. This asset, often referred to as the "liquidity efficiency enhancer," is playing an increasingly crucial role in facilitating easier trading for users and assets across blockchain ecosystems.
This article will provide a comprehensive analysis of CETUS's price trends from 2025 to 2030, combining historical patterns, market supply and demand, ecosystem development, and macroeconomic factors to offer professional price predictions and practical investment strategies for investors.
I. CETUS Price History Review and Current Market Status
CETUS Historical Price Evolution
- 2023: Initial launch on May 10, price peaked at $0.5 (all-time high)
- 2023: Market correction, price dropped to $0.021535 (all-time low) on June 10
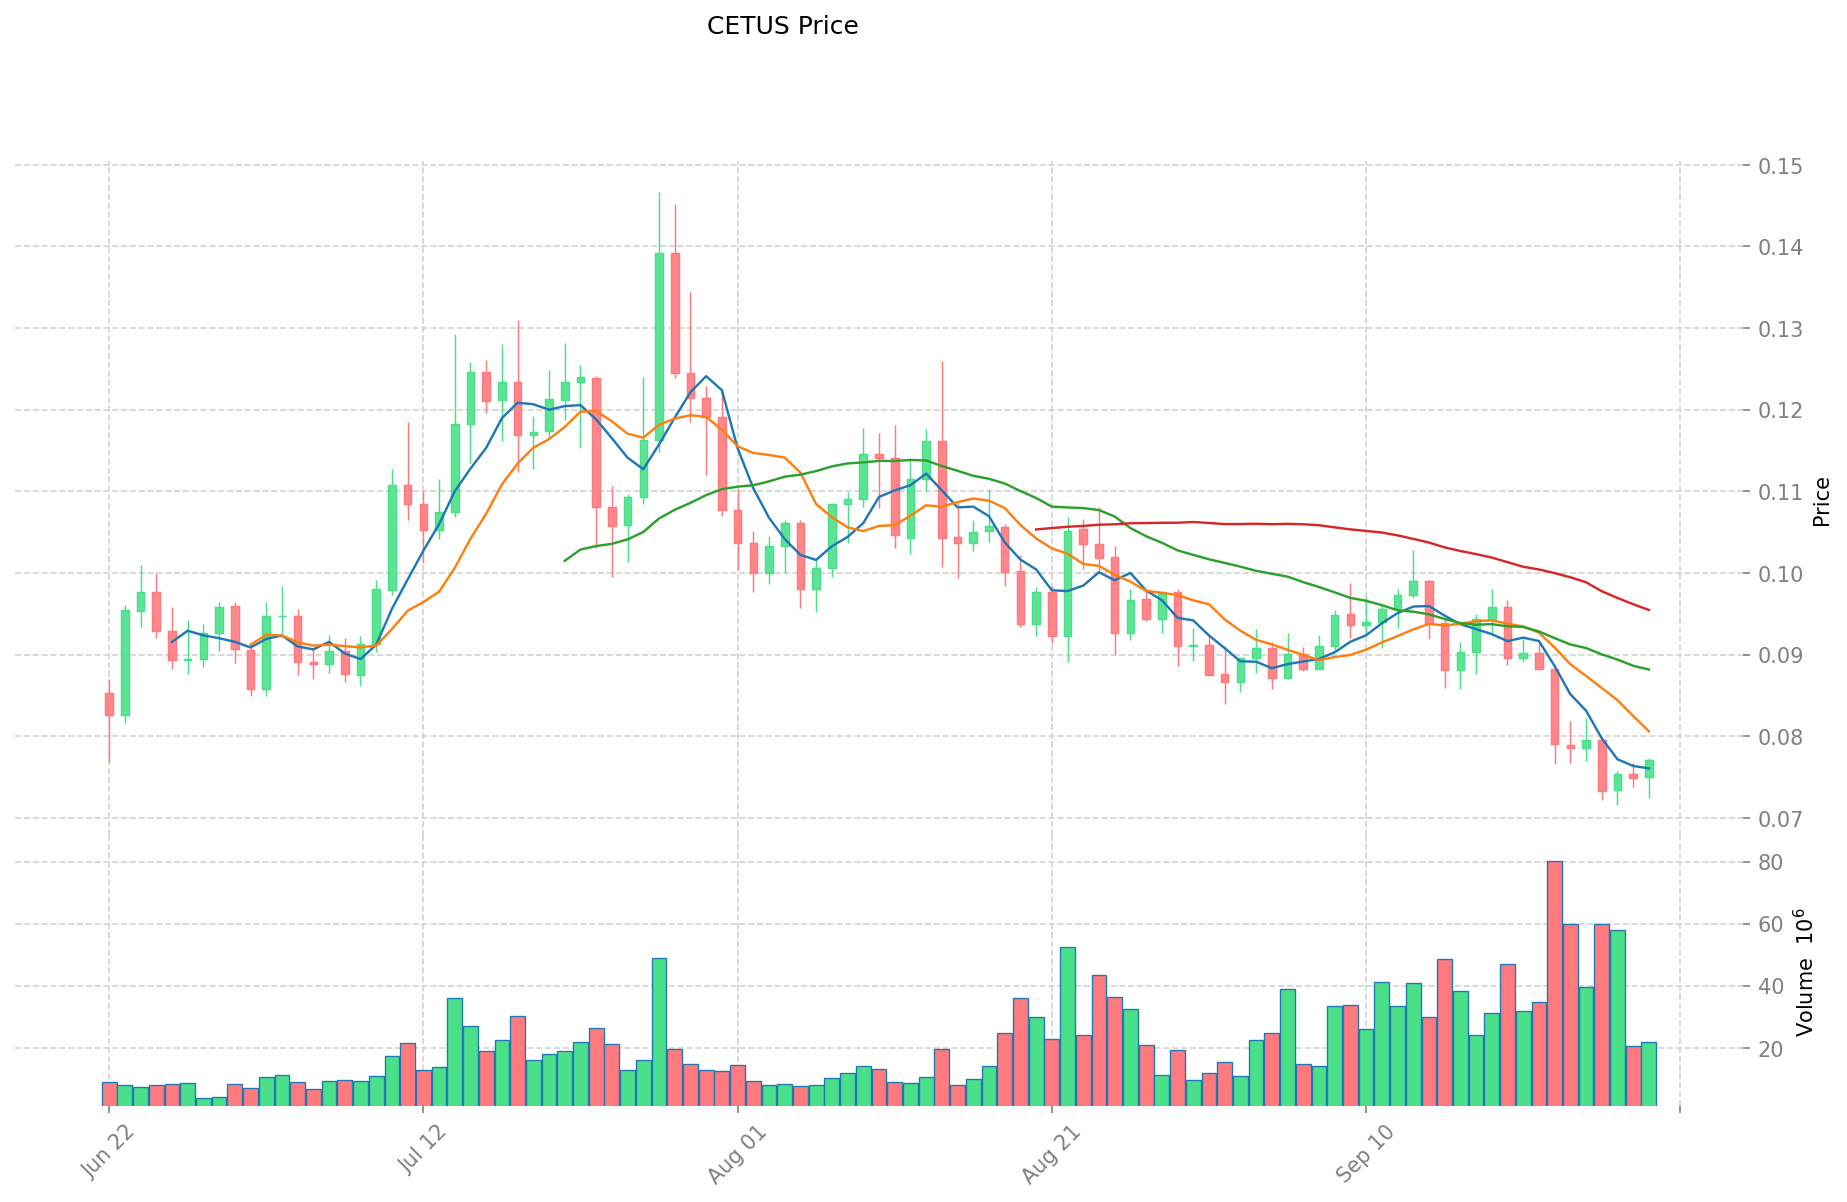
- 2024-2025: Gradual recovery and stabilization, current price at $0.07634
CETUS Current Market Situation
As of September 29, 2025, CETUS is trading at $0.07634, showing a 3.99% increase in the last 24 hours. The token has experienced mixed performance across different timeframes, with a 0.57% gain in the past hour but a 3.88% decrease over the week. The 30-day and 1-year trends indicate more substantial declines of 18.18% and 46.41% respectively.
CETUS has a current market capitalization of $64,612,405, ranking 596th in the overall cryptocurrency market. The circulating supply stands at 846,376,811 CETUS, which is 84.64% of the total supply of 1 billion tokens. The fully diluted market cap is $76,340,000.
Trading volume in the past 24 hours reached $1,816,289, suggesting moderate market activity. The token is currently trading at 84.73% below its all-time high of $0.5, but 254.03% above its all-time low of $0.021535.
Click to view the current CETUS market price
CETUS Market Sentiment Indicator
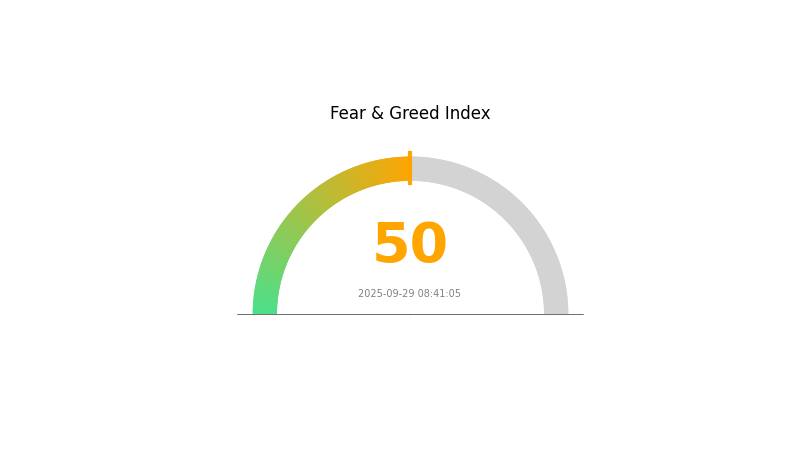
2025-09-29 Fear and Greed Index: 50 (Neutral)
Click to view the current Fear & Greed Index
The cryptocurrency market sentiment has reached a neutral state, with the Fear and Greed Index standing at 50. This balanced sentiment suggests that investors are neither overly pessimistic nor excessively optimistic about the market's current conditions. Such equilibrium often indicates a period of stability and could potentially signal a transitional phase in market dynamics. Traders and investors should remain vigilant, as neutral sentiment can sometimes precede significant market movements in either direction.
CETUS Holdings Distribution
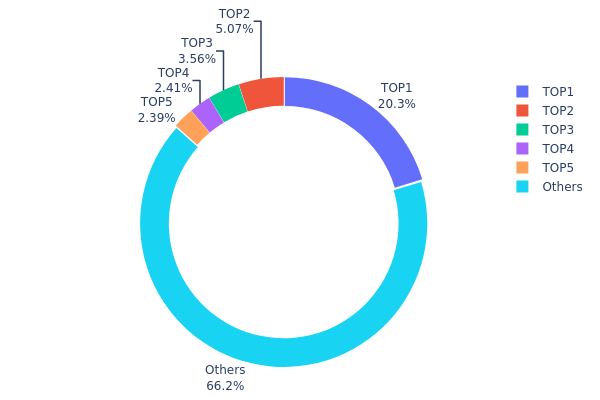
The address holdings distribution chart provides insight into the concentration of CETUS token ownership. Analyzing the data reveals a moderate level of centralization. The top address holds 20.33% of the total supply, while the top 5 addresses collectively control 33.75% of CETUS tokens. This concentration suggests a significant influence from a small group of large holders.
However, it's noteworthy that 66.25% of the tokens are distributed among "Others," indicating a substantial level of dispersion among smaller holders. This distribution pattern presents a mixed picture of centralization and decentralization. While the top holders have considerable weight, the majority of tokens are still spread across a wider base of addresses.
The current distribution structure may contribute to potential price volatility, as large holders have the capacity to impact the market significantly. However, the presence of a diverse "Others" category could provide some stability and resistance to manipulation. This balance reflects a moderate level of decentralization in the CETUS ecosystem, though vigilance is warranted regarding the actions of top holders.
Click to view the current CETUS Holdings Distribution
| Top | Address | Holding Qty | Holding (%) |
|---|---|---|---|
| 1 | 0xac5b...13c33c | 203327.34K | 20.33% |
| 2 | 0xda79...6bf0f3 | 50683.33K | 5.06% |
| 3 | 0xdad8...554b5a | 35629.96K | 3.56% |
| 4 | 0x62f3...fa53ad | 24121.23K | 2.41% |
| 5 | 0x3a15...0b36b7 | 23946.31K | 2.39% |
| - | Others | 662291.82K | 66.25% |
II. Key Factors Influencing CETUS's Future Price
Supply Mechanism
- Concentrated Liquidity: CETUS uses a concentrated liquidity market-making algorithm similar to Uniswap V3, allowing liquidity providers to create multiple positions within the same pool and simulate different price curves by setting various price ranges.
Institutional and Whale Dynamics
- Enterprise Adoption: CETUS is integrated into the Sui blockchain ecosystem, which has seen significant adoption and capital inflow.
Macroeconomic Environment
- Inflation Hedging Properties: As a cryptocurrency, CETUS may be viewed as a potential hedge against inflation, similar to other digital assets.
Technical Development and Ecosystem Building
- Network Security: The security of the Sui network, on which CETUS operates, is crucial. A major security breach in May 2025 resulted in a loss of over $220 million, highlighting the importance of robust security measures.
- Ecosystem Applications: CETUS serves as the largest decentralized exchange (DEX) in the Sui ecosystem, playing a vital role in the network's DeFi landscape.
III. CETUS Price Prediction for 2025-2030
2025 Outlook
- Conservative prediction: $0.0505 - $0.07651
- Neutral prediction: $0.07651 - $0.09334
- Optimistic prediction: $0.09334 - $0.11017 (requires favorable market conditions and increased adoption)
2027-2028 Outlook
- Market phase expectation: Potential growth phase with increased volatility
- Price range forecast:
- 2027: $0.05893 - $0.14482
- 2028: $0.11868 - $0.15171
- Key catalysts: Technological advancements, ecosystem expansion, and broader crypto market trends
2029-2030 Long-term Outlook
- Base scenario: $0.13703 - $0.14868 (assuming steady growth and adoption)
- Optimistic scenario: $0.14868 - $0.16033 (with accelerated ecosystem development)
- Transformative scenario: $0.16033 - $0.16801 (under extremely favorable market conditions and breakthrough use cases)
- 2030-12-31: CETUS $0.16801 (potential peak based on current projections)
| 年份 | 预测最高价 | 预测平均价格 | 预测最低价 | 涨跌幅 |
|---|---|---|---|---|
| 2025 | 0.11017 | 0.07651 | 0.0505 | 0 |
| 2026 | 0.10641 | 0.09334 | 0.05134 | 22 |
| 2027 | 0.14482 | 0.09988 | 0.05893 | 30 |
| 2028 | 0.15171 | 0.12235 | 0.11868 | 59 |
| 2029 | 0.16033 | 0.13703 | 0.09455 | 79 |
| 2030 | 0.16801 | 0.14868 | 0.13232 | 94 |
IV. CETUS Professional Investment Strategies and Risk Management
CETUS Investment Methodology
(1) Long-term Holding Strategy
- Suitable for: Long-term investors and believers in DeFi projects
- Operation suggestions:
- Accumulate CETUS tokens during market dips
- Set price targets for partial profit-taking
- Store tokens in a secure non-custodial wallet
(2) Active Trading Strategy
- Technical analysis tools:
- Moving Averages: Use to identify trends and potential reversal points
- RSI (Relative Strength Index): Identify overbought and oversold conditions
- Key points for swing trading:
- Monitor trading volume for confirmation of price movements
- Set strict stop-loss orders to manage risk
CETUS Risk Management Framework
(1) Asset Allocation Principles
- Conservative investors: 1-3% of crypto portfolio
- Moderate investors: 3-5% of crypto portfolio
- Aggressive investors: 5-10% of crypto portfolio
(2) Risk Hedging Solutions
- Diversification: Spread investments across multiple DeFi projects
- Stop-loss orders: Implement to limit potential losses
(3) Secure Storage Solutions
- Hot wallet recommendation: Gate Web3 Wallet
- Cold storage solution: Hardware wallet for long-term holdings
- Security precautions: Use two-factor authentication, regularly update passwords
V. Potential Risks and Challenges for CETUS
CETUS Market Risks
- Volatility: Cryptocurrency market fluctuations can impact CETUS price
- Competition: Emerging DEX protocols may challenge Cetus' market share
- Liquidity: Potential for reduced liquidity during market downturns
CETUS Regulatory Risks
- Regulatory uncertainty: Changing DeFi regulations could impact operations
- Cross-border compliance: Varying regulations across jurisdictions
- KYC/AML requirements: Potential implementation of stricter user verification
CETUS Technical Risks
- Smart contract vulnerabilities: Potential for exploits or bugs
- Blockchain scalability: Sui and Aptos network congestion could affect performance
- Oracle reliability: Dependence on accurate price feeds for trading
VI. Conclusion and Action Recommendations
CETUS Investment Value Assessment
CETUS presents a promising long-term value proposition as a pioneer DEX on Sui and Aptos blockchains. However, short-term volatility and regulatory uncertainties pose significant risks.
CETUS Investment Recommendations
✅ Beginners: Start with small positions, focus on learning DeFi mechanics ✅ Experienced investors: Consider allocating as part of a diversified DeFi portfolio ✅ Institutional investors: Conduct thorough due diligence, monitor regulatory developments
CETUS Trading Participation Methods
- Spot trading: Buy and sell CETUS tokens on Gate.com
- Liquidity provision: Participate in liquidity pools on the Cetus Protocol
- Yield farming: Explore staking opportunities within the Cetus ecosystem
Cryptocurrency investments carry extremely high risks, and this article does not constitute investment advice. Investors should make decisions carefully based on their own risk tolerance and are advised to consult professional financial advisors. Never invest more than you can afford to lose.
FAQ
What is the prediction for Cetus in 2025?
Based on current market trends, Cetus is predicted to reach $0.055981 by October 27, 2025, representing a 25.30% decrease from its current price.
How much is Cetus crypto worth?
As of September 2025, Cetus crypto is worth approximately $0.15. The price has shown steady growth over the past year, reflecting increased adoption and market interest in the Cetus protocol.
What is the price prediction for Constellation crypto in 2025?
Based on market indicators, Constellation crypto is predicted to trade between $0.071531 and $0.076001 by the end of 2025.
What is the price prediction for a Shiba Inu in 2040?
Based on current trends, Shiba Inu could reach $0.00005 to $0.0001 by 2040. This prediction assumes continued growth and adoption in the crypto market.
Share
Content
Introduction: CETUS's Market Position and Investment Value
I. CETUS Price History Review and Current Market Status
II. Key Factors Influencing CETUS's Future Price
III. CETUS Price Prediction for 2025-2030
IV. CETUS Professional Investment Strategies and Risk Management
V. Potential Risks and Challenges for CETUS
VI. Conclusion and Action Recommendations
FAQ

