2025 EL Price Prediction: Analyzing Market Trends and Potential Growth Factors
Introduction: EL's Market Position and Investment Value
ELYSIA (EL), as a pioneering RWA tokenization protocol, has been enabling the trading of real-world assets on blockchain since its inception in 2020. As of 2025, ELYSIA's market capitalization has reached $16,450,381, with a circulating supply of approximately 6,803,300,704 tokens, and a price hovering around $0.002418. This asset, often referred to as the "real-world asset bridge," is playing an increasingly crucial role in tokenizing and trading global real-world assets on blockchain platforms.
This article will provide a comprehensive analysis of ELYSIA's price trends from 2025 to 2030, combining historical patterns, market supply and demand, ecosystem development, and macroeconomic factors to offer professional price predictions and practical investment strategies for investors.
I. EL Price History Review and Current Market Status
EL Historical Price Evolution Trajectory
- 2020: Initial launch, price opened at $0.0014
- 2024: Reached all-time high of $0.0197 on December 14
- 2024: Market downturn, price dropped to all-time low of $0.000122 on July 25
EL Current Market Situation
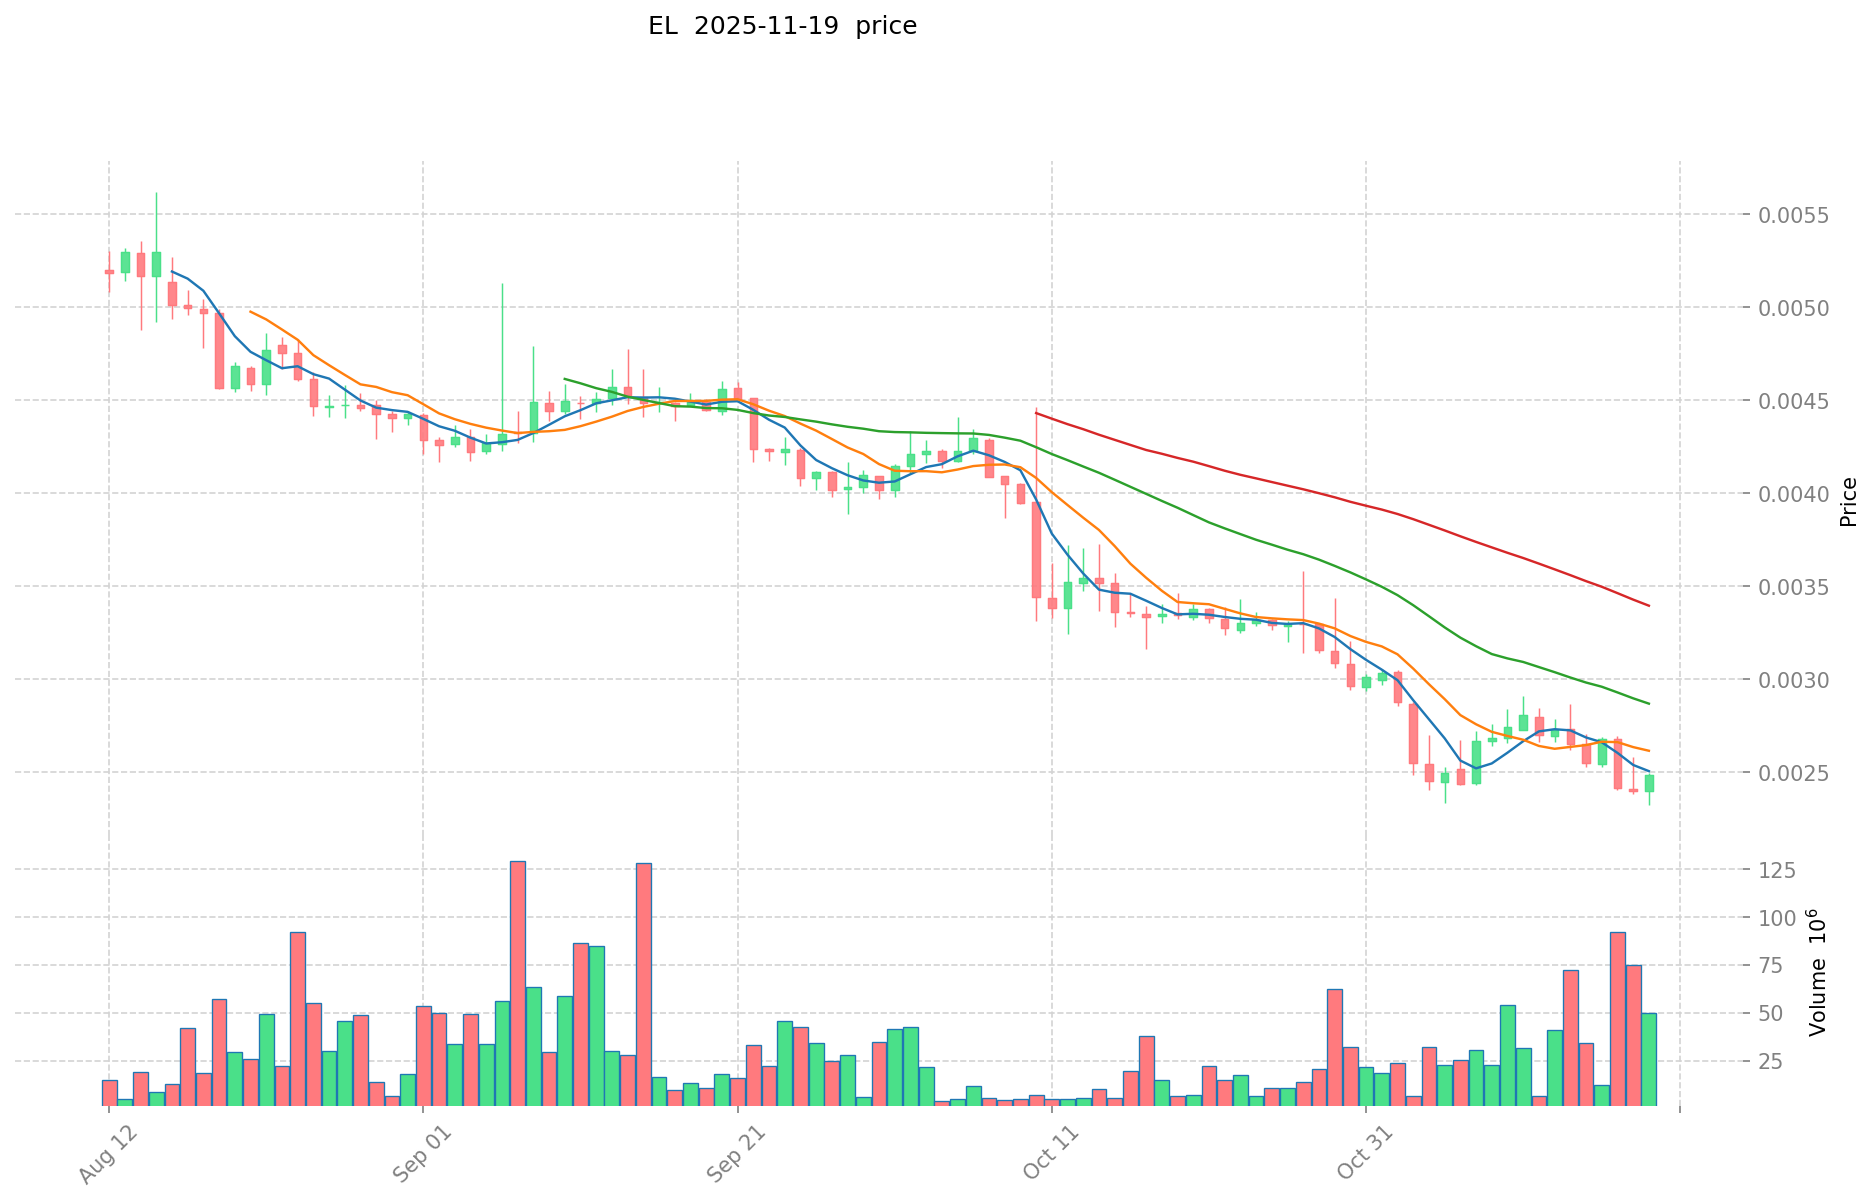
As of November 20, 2025, EL is trading at $0.002418, experiencing a 2.14% decline in the past 24 hours. The token's market cap stands at $16,450,381, ranking it 992nd in the overall cryptocurrency market. EL has seen significant volatility over the past year, with a 46.88% decrease in value. The current price represents a 87.72% drop from its all-time high and a 1881.97% increase from its all-time low. Trading volume in the last 24 hours amounts to $93,899, indicating moderate market activity. The circulating supply of 6,803,300,704 EL tokens represents 97.19% of the total supply, suggesting a high level of token distribution.
Click to view the current EL market price
EL Market Sentiment Indicator
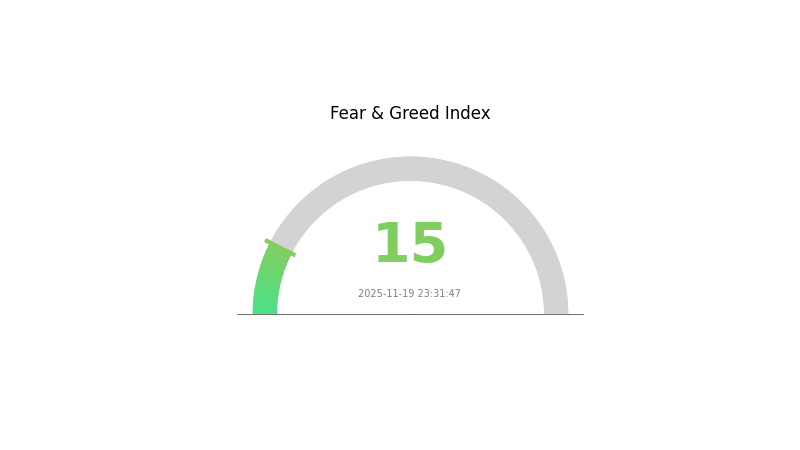
2025-11-19 Fear and Greed Index: 15 (Extreme Fear)
Click to view the current Fear & Greed Index
The crypto market is gripped by extreme fear, with the sentiment index plummeting to 15. This level of pessimism often presents contrarian investment opportunities for the bold. However, caution is advised as market bottoms can be elusive. Savvy investors might consider dollar-cost averaging strategies to mitigate risk while potentially capitalizing on depressed prices. As always, thorough research and risk management are crucial in navigating these turbulent waters.
EL Holdings Distribution
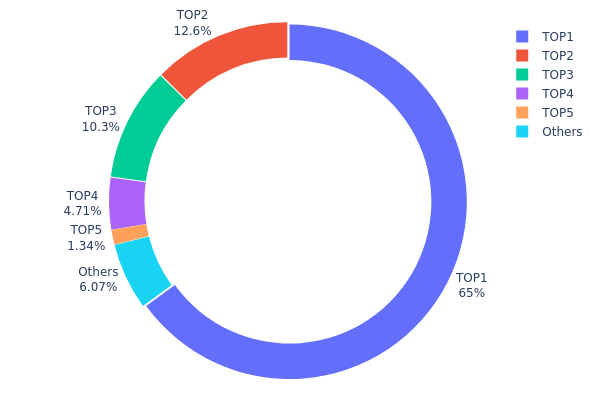
The address holdings distribution data reveals a highly concentrated ownership structure for EL tokens. The top address holds an overwhelming 65% of the total supply, with the next four largest holders accounting for an additional 28.91%. This concentration raises concerns about centralization and potential market manipulation.
Such a high concentration of tokens in a few addresses can significantly impact market dynamics. The top holder, with 65% of the supply, has substantial influence over price movements and liquidity. This concentration may lead to increased volatility and susceptibility to large sell-offs or accumulation events. Furthermore, it suggests a low level of decentralization, which could be concerning for a project aiming for widespread adoption and community governance.
The current distribution reflects a market structure with potential risks. While some concentration is common in early-stage projects, this level may deter new investors concerned about whale dominance. It also indicates that the on-chain structure might be less stable, as significant movements from top holders could dramatically shift the token's economics and market performance.
Click to view the current EL Holdings Distribution
| Top | Address | Holding Qty | Holding (%) |
|---|---|---|---|
| 1 | 0x1b13...a1e452 | 4422391.09K | 65.00% |
| 2 | 0x796b...662674 | 856182.03K | 12.58% |
| 3 | 0xed5d...525b4f | 700000.00K | 10.28% |
| 4 | 0x1be9...778757 | 320571.31K | 4.71% |
| 5 | 0xb342...7d0328 | 91484.76K | 1.34% |
| - | Others | 412671.51K | 6.09% |
II. Key Factors Affecting EL's Future Price
Supply Mechanism
- Interest Rates: Global interest rate trends significantly impact EL's price.
- Historical Pattern: Past supply changes have influenced price movements in response to interest rate shifts.
- Current Impact: The rising global interest rate environment is expected to affect EL's price dynamics.
Institutional and Whale Dynamics
- Institutional Holdings: Investors are increasingly allocating assets to passive funds over actively managed ones.
Macroeconomic Environment
- Monetary Policy Impact: Major central banks' policies are expected to continue influencing EL's price.
- Inflation Hedging Properties: EL's performance in inflationary environments is a key consideration for investors.
- Geopolitical Factors: International tensions and policy changes impact EL's global demand and adoption.
Technological Development and Ecosystem Building
- Market Competition: Advancements in competing technologies may affect EL's market position.
- Ecosystem Applications: The development of DApps and ecosystem projects could drive EL's adoption and value.
III. EL Price Prediction for 2025-2030
2025 Outlook
- Conservative prediction: $0.00222 - $0.00242
- Neutral prediction: $0.00242 - $0.00264
- Optimistic prediction: $0.00264 - $0.00285 (requires positive market sentiment and project developments)
2027-2028 Outlook
- Market stage expectation: Potential growth phase with increasing adoption
- Price range forecast:
- 2027: $0.00224 - $0.00333
- 2028: $0.00191 - $0.00406
- Key catalysts: Technological advancements, broader market trends, and increased utility of EL
2029-2030 Long-term Outlook
- Base scenario: $0.00354 - $0.00409 (assuming steady market growth and project development)
- Optimistic scenario: $0.00464 - $0.00573 (assuming strong market performance and significant project milestones)
- Transformative scenario: $0.00573+ (extreme favorable conditions such as major partnerships or technological breakthroughs)
- 2030-11-20: EL $0.00409 (potential steady growth trajectory)
| 年份 | 预测最高价 | 预测平均价格 | 预测最低价 | 涨跌幅 |
|---|---|---|---|---|
| 2025 | 0.00285 | 0.00242 | 0.00222 | 0 |
| 2026 | 0.00282 | 0.00264 | 0.00163 | 9 |
| 2027 | 0.00333 | 0.00273 | 0.00224 | 12 |
| 2028 | 0.00406 | 0.00303 | 0.00191 | 25 |
| 2029 | 0.00464 | 0.00354 | 0.00262 | 46 |
| 2030 | 0.00573 | 0.00409 | 0.00213 | 69 |
IV. EL Professional Investment Strategies and Risk Management
EL Investment Methodology
(1) Long-term Holding Strategy
- Suitable for: Risk-tolerant investors with a long-term perspective
- Operation suggestions:
- Accumulate EL tokens during market dips
- Set price targets for partial profit-taking
- Store tokens in a secure hardware wallet
(2) Active Trading Strategy
- Technical analysis tools:
- Moving Averages: Use to identify trends and potential reversal points
- Relative Strength Index (RSI): Identify overbought and oversold conditions
- Key points for swing trading:
- Monitor trading volume for confirmation of price movements
- Set stop-loss orders to manage downside risk
EL Risk Management Framework
(1) Asset Allocation Principles
- Conservative investors: 1-3% of crypto portfolio
- Aggressive investors: 5-10% of crypto portfolio
- Professional investors: Up to 15% of crypto portfolio
(2) Risk Hedging Solutions
- Diversification: Spread investments across multiple cryptocurrencies and asset classes
- Stop-loss orders: Implement to limit potential losses
(3) Secure Storage Solutions
- Hot wallet recommendation: Gate Web3 Wallet
- Cold storage solution: Use hardware wallets for long-term holdings
- Security precautions: Enable two-factor authentication, use strong passwords, and regularly update software
V. Potential Risks and Challenges for EL
EL Market Risks
- High volatility: EL price may experience significant fluctuations
- Limited liquidity: Potential difficulties in executing large trades without impacting price
- Market sentiment: Susceptible to broader cryptocurrency market trends
EL Regulatory Risks
- Uncertain regulatory environment: Potential for new regulations affecting RWA tokenization
- Cross-border compliance: Challenges in adhering to various international regulations
- Legal status: Possibility of legal challenges to the tokenization of real-world assets
EL Technical Risks
- Smart contract vulnerabilities: Potential for exploits or bugs in the underlying code
- Scalability issues: Challenges in handling increased transaction volume
- Interoperability: Potential difficulties in integrating with other blockchain networks
VI. Conclusion and Action Recommendations
EL Investment Value Assessment
ELYSIA (EL) presents a unique value proposition in the RWA tokenization space, offering potential long-term growth as the adoption of blockchain technology in real estate increases. However, short-term volatility and regulatory uncertainties pose significant risks.
EL Investment Recommendations
✅ Newcomers: Consider small, long-term positions as part of a diversified crypto portfolio ✅ Experienced investors: Implement dollar-cost averaging strategy and actively monitor market developments ✅ Institutional investors: Conduct thorough due diligence and consider EL as part of a broader RWA tokenization strategy
EL Trading Participation Methods
- Spot trading: Buy and sell EL tokens on Gate.com
- Staking: Participate in staking programs if available to earn passive income
- DeFi integration: Explore decentralized finance opportunities involving EL tokens
Cryptocurrency investments carry extremely high risks, and this article does not constitute investment advice. Investors should make decisions carefully based on their own risk tolerance and are advised to consult professional financial advisors. Never invest more than you can afford to lose.
FAQ
Is EL a strong buy?
Yes, EL is considered a strong buy. 42.86% of analysts recommend it as a Strong Buy, based on consensus among 14 Wall Street analysts. This view remains prevalent as of now.
Is EL a buy, sell, or hold?
Based on current analyst consensus, EL is considered a 'Moderate Buy'. The stock has a mix of buy and hold recommendations, with a slight lean towards buying.
What is the Estee Lauder forecast for 2025?
Based on current projections, Estee Lauder's stock price is forecast to average $151.90 in 2025, with potential highs of $201.81 and lows of $101.99.
What is the price target for EL?
The price target for EL is $105.00, expected within 12 months. This represents a potential 18.64% upside from the current price.
Share
Content
Introduction: EL's Market Position and Investment Value
I. EL Price History Review and Current Market Status
II. Key Factors Affecting EL's Future Price
III. EL Price Prediction for 2025-2030
IV. EL Professional Investment Strategies and Risk Management
V. Potential Risks and Challenges for EL
VI. Conclusion and Action Recommendations
FAQ

