2025 ES Price Prediction: Navigating Market Trends and Economic Factors for Accurate Forecasts
Introduction: ES's Market Position and Investment Value
Eclipse (ES), as Ethereum's first Solana Virtual Machine (SVM) L2 solution, has made significant strides since its inception. As of 2025, Eclipse's market capitalization has reached $13,794,000, with a circulating supply of approximately 150,000,000 tokens, and a price hovering around $0.09196. This asset, dubbed the "Ethereum-Solana Bridge," is playing an increasingly crucial role in enhancing blockchain interoperability and scalability.
This article will comprehensively analyze Eclipse's price trends from 2025 to 2030, considering historical patterns, market supply and demand, ecosystem development, and macroeconomic factors to provide investors with professional price predictions and practical investment strategies.
I. ES Price History Review and Current Market Status
ES Historical Price Evolution
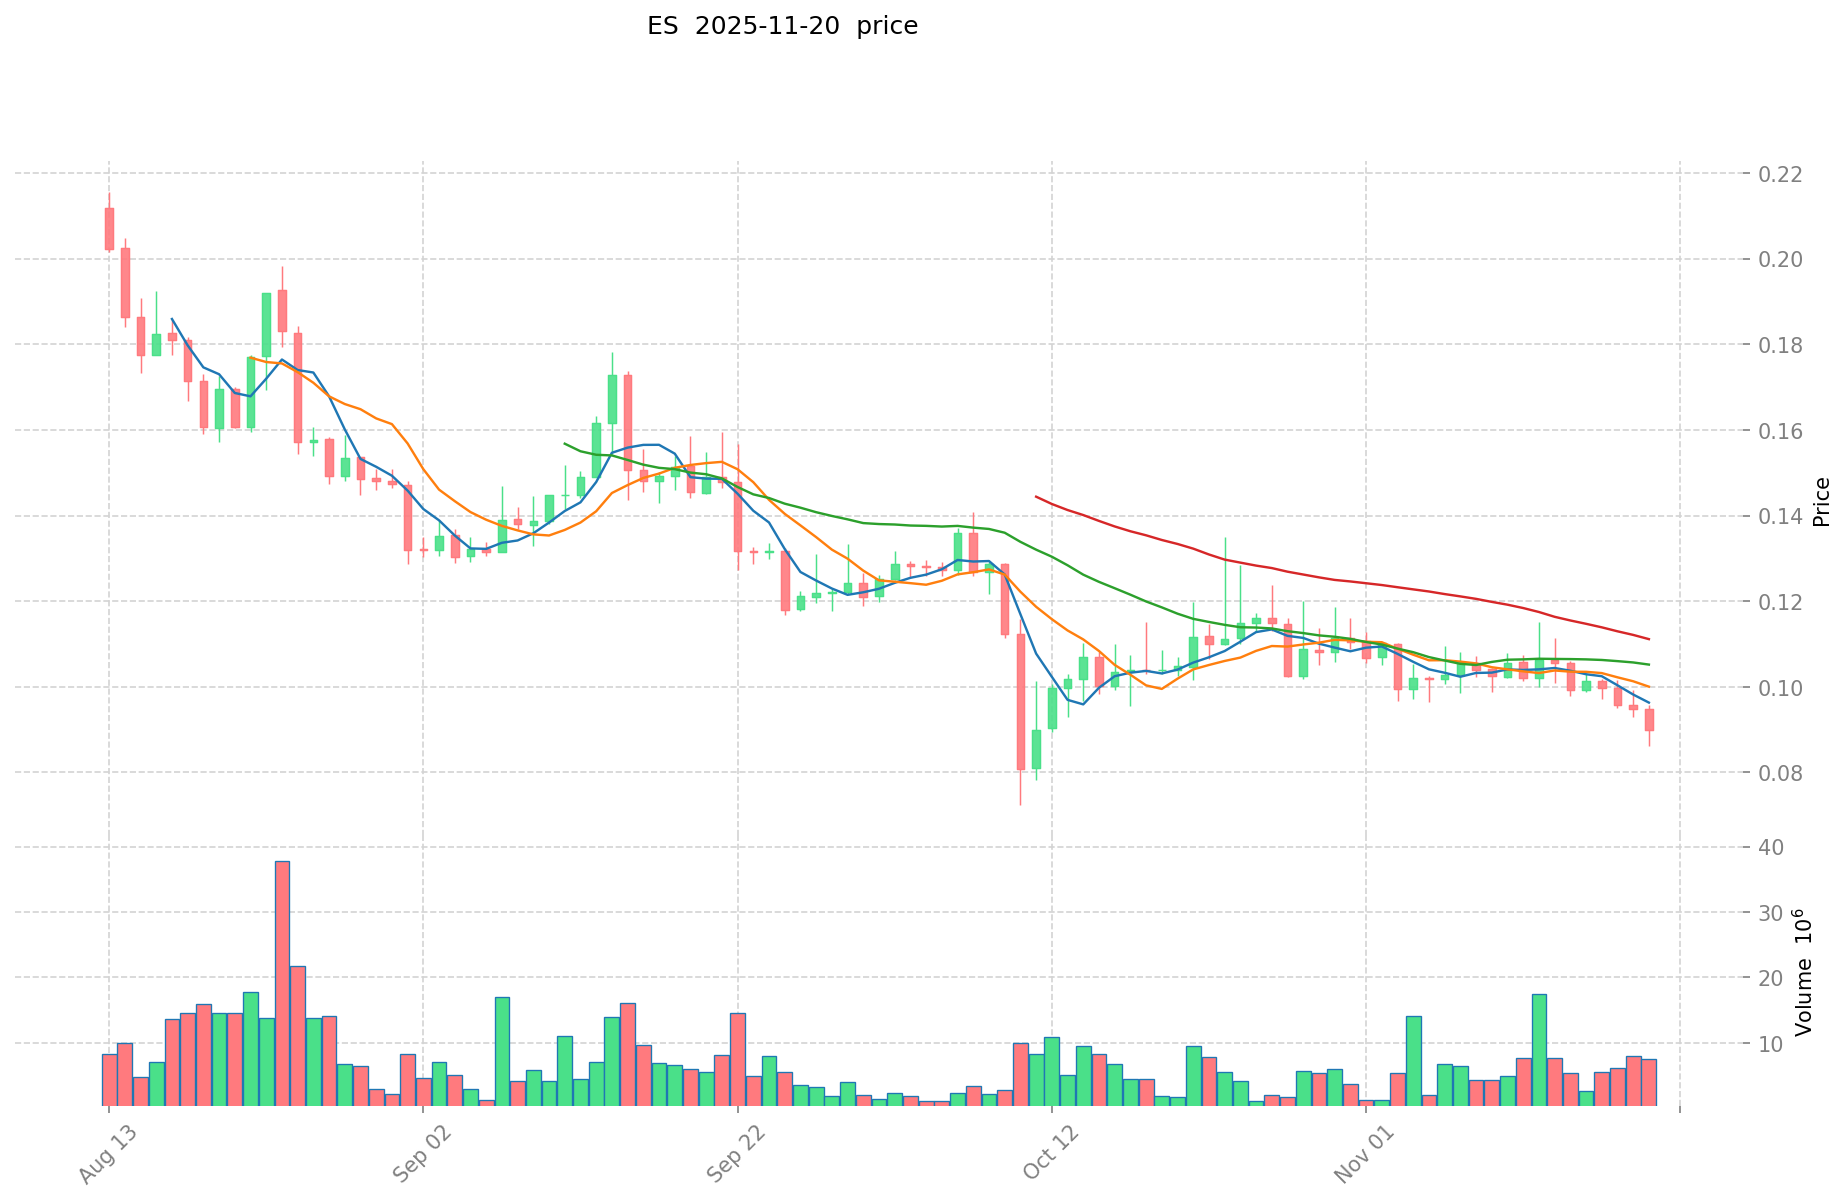
- July 2025: ES reached its all-time high of $0.5, marking a significant milestone for the project
- October 2025: ES experienced its all-time low of $0.0723, indicating a period of market correction
- November 2025: ES has shown signs of recovery, with the current price at $0.09196
ES Current Market Situation
As of November 20, 2025, ES is trading at $0.09196, with a 24-hour trading volume of $433,965.0368. The token has seen a 0.36% increase in the last 24 hours and a 0.71% increase in the last hour. However, ES has experienced a significant decline of 10.81% over the past week and 16.15% over the last 30 days.
The current market capitalization of ES stands at $13,794,000, with a circulating supply of 150,000,000 ES tokens. This represents 15% of the total supply of 1,000,000,000 ES tokens. The fully diluted market cap is $91,960,000.
ES is currently ranked #1087 in the cryptocurrency market, with a market dominance of 0.0027%. The token is listed on 24 exchanges, indicating a moderate level of market presence and liquidity.
Click to view the current ES market price
ES Market Sentiment Indicator
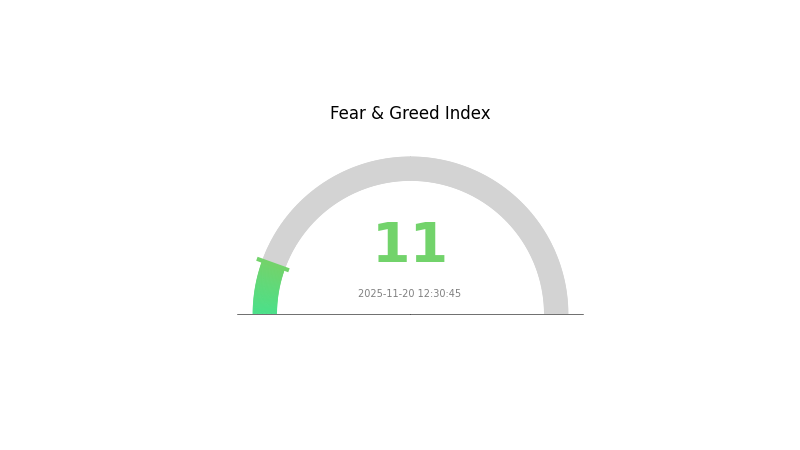
2025-11-20 Fear and Greed Index: 11 (Extreme Fear)
Click to view the current Fear & Greed Index
The crypto market is gripped by extreme fear, with the sentiment index plummeting to 11. This level of pessimism often precedes significant market movements. Savvy investors might view this as a potential buying opportunity, adhering to the adage "be fearful when others are greedy, and greedy when others are fearful." However, caution is advised as market conditions remain volatile. It's crucial to conduct thorough research and consider your risk tolerance before making any investment decisions in this challenging climate.
ES Holdings Distribution
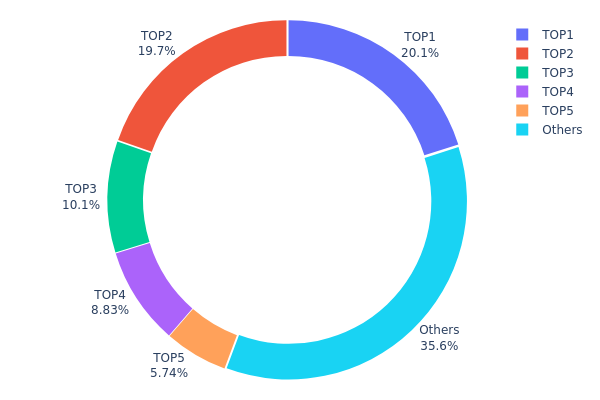
The address holdings distribution chart provides insights into the concentration of ES tokens among different wallet addresses. Analysis of the data reveals a significant level of concentration, with the top 5 addresses holding 64.39% of the total supply. The largest holder possesses 20.08% of ES tokens, followed closely by the second-largest with 19.67%.
This concentration pattern suggests a relatively centralized token distribution, which could have implications for market dynamics. The substantial holdings by a few addresses may potentially influence price movements and liquidity. It also raises concerns about the vulnerability of the token to large-scale sell-offs or potential market manipulation by these major holders.
However, it's worth noting that 35.61% of the tokens are distributed among other addresses, indicating some level of wider distribution. This broader base of smaller holders could provide a degree of stability and resistance to extreme volatility. Overall, the current ES token distribution reflects a market structure with significant centralization, which may impact its overall stability and susceptibility to large holder actions.
Click to view the current ES Holdings Distribution
| Top | Address | Holding Qty | Holding (%) |
|---|---|---|---|
| 1 | 0x2b7d...ef982f | 200833.33K | 20.08% |
| 2 | 0x0bfa...b5e263 | 196786.99K | 19.67% |
| 3 | 0x3ee1...b3dd85 | 100869.99K | 10.08% |
| 4 | 0x4d0a...1c3fcf | 88328.43K | 8.83% |
| 5 | 0x4597...cdab0d | 57366.66K | 5.73% |
| - | Others | 355814.59K | 35.61% |
II. Key Factors Affecting Future ES Price
Supply Mechanism
- Ethereum Staking: Ethereum staking locks up ETH, reducing circulating supply.
- Historical Pattern: Previous supply reductions have generally led to price increases.
- Current Impact: Continued staking is expected to create upward pressure on ETH price.
Institutional and Whale Dynamics
- Institutional Holdings: Major financial institutions have been increasing their ETH holdings.
- Corporate Adoption: Several Fortune 500 companies are exploring Ethereum for blockchain solutions.
- National Policies: Some countries are considering Ethereum for digital currency experiments.
Macroeconomic Environment
- Monetary Policy Impact: Central banks' interest rate decisions may affect ETH as a risk asset.
- Inflation Hedging Properties: ETH has shown some potential as an inflation hedge in recent years.
- Geopolitical Factors: Global economic uncertainties may increase ETH's appeal as a decentralized asset.
Technical Development and Ecosystem Building
- Ethereum 2.0: The ongoing transition to Proof-of-Stake is expected to improve scalability and efficiency.
- Layer 2 Solutions: Continued development of Layer 2 solutions may enhance Ethereum's transaction capacity.
- Ecosystem Applications: DeFi and NFT projects continue to drive adoption and utility on the Ethereum network.
III. ES Price Prediction for 2025-2030
2025 Outlook
- Conservative prediction: $0.06259 - $0.09205
- Neutral prediction: $0.09205 - $0.10494
- Optimistic prediction: $0.10494 - $0.11782 (requires favorable market conditions)
2026-2028 Outlook
- Market stage expectation: Steady growth phase
- Price range forecast:
- 2026: $0.09654 - $0.13537
- 2027: $0.09132 - $0.13457
- 2028: $0.09807 - $0.14901
- Key catalysts: Increased adoption, technological improvements, and market maturation
2029-2030 Long-term Outlook
- Base scenario: $0.13819 - $0.16375 (assuming continued market growth)
- Optimistic scenario: $0.16375 - $0.18932 (assuming strong market performance)
- Transformative scenario: $0.18932 - $0.20469 (assuming exceptional market conditions and widespread adoption)
- 2030-12-31: ES $0.20469 (potential peak price based on optimistic projections)
| 年份 | 预测最高价 | 预测平均价格 | 预测最低价 | 涨跌幅 |
|---|---|---|---|---|
| 2025 | 0.11782 | 0.09205 | 0.06259 | 0 |
| 2026 | 0.13537 | 0.10494 | 0.09654 | 14 |
| 2027 | 0.13457 | 0.12015 | 0.09132 | 30 |
| 2028 | 0.14901 | 0.12736 | 0.09807 | 38 |
| 2029 | 0.18932 | 0.13819 | 0.12575 | 50 |
| 2030 | 0.20469 | 0.16375 | 0.10644 | 78 |
IV. Professional Investment Strategies and Risk Management for ES
ES Investment Methodology
(1) Long-term Holding Strategy
- Suitable for: Investors with a high risk tolerance and belief in Eclipse's long-term potential
- Operational suggestions:
- Accumulate ES tokens during market dips
- Set a target holding period of at least 1-2 years
- Store tokens securely in a hardware wallet or reputable custodial service
(2) Active Trading Strategy
- Technical analysis tools:
- Moving Averages: Use to identify trends and potential entry/exit points
- Relative Strength Index (RSI): Monitor overbought/oversold conditions
- Key points for swing trading:
- Monitor Eclipse development milestones and partnerships
- Set strict stop-loss orders to manage downside risk
ES Risk Management Framework
(1) Asset Allocation Principles
- Conservative investors: 1-3% of crypto portfolio
- Aggressive investors: 5-10% of crypto portfolio
- Professional investors: Up to 15% of crypto portfolio, depending on risk appetite
(2) Risk Hedging Solutions
- Diversification: Spread investments across multiple Layer 2 projects
- Options strategies: Consider using put options for downside protection
(3) Secure Storage Solutions
- Hot wallet recommendation: Gate Web3 wallet
- Cold storage solution: Use hardware wallets for long-term holdings
- Security precautions: Enable two-factor authentication, use unique strong passwords
V. Potential Risks and Challenges for ES
ES Market Risks
- High volatility: ES price may experience significant fluctuations
- Competitive landscape: Other Layer 2 solutions may gain market share
- Market sentiment: Overall crypto market conditions can impact ES performance
ES Regulatory Risks
- Uncertain regulatory environment: Potential for increased scrutiny of Layer 2 solutions
- Compliance challenges: Possible need for adaptations to meet future regulations
- Cross-border restrictions: Varying legal status in different jurisdictions
ES Technical Risks
- Smart contract vulnerabilities: Potential for exploits or bugs in the protocol
- Scalability challenges: Unforeseen issues in handling increased network load
- Integration complexities: Possible difficulties in seamless integration with Ethereum and Solana ecosystems
VI. Conclusion and Action Recommendations
ES Investment Value Assessment
Eclipse (ES) presents a unique value proposition as Ethereum's first Solana Virtual Machine (SVM) L2 solution. Its modular architecture and strong backing from industry leaders suggest long-term potential. However, investors should be aware of short-term volatility and the evolving nature of the Layer 2 ecosystem.
ES Investment Recommendations
✅ Beginners: Consider small, regular investments to build a position over time ✅ Experienced investors: Implement a balanced approach with both long-term holdings and active trading ✅ Institutional investors: Conduct thorough due diligence and consider ES as part of a diversified Layer 2 portfolio
ES Trading Participation Methods
- Spot trading: Purchase ES tokens on Gate.com
- Staking: Participate in staking programs if offered by the Eclipse ecosystem
- DeFi integration: Explore decentralized finance opportunities within the Eclipse network as they become available
Cryptocurrency investments carry extremely high risks, and this article does not constitute investment advice. Investors should make decisions carefully based on their own risk tolerance and are advised to consult professional financial advisors. Never invest more than you can afford to lose.
FAQ
Is es a buy or sell?
Based on current market trends, ES appears to be a buy. The project shows potential for growth in the Web3 space, making it an attractive investment option for 2025.
What is the target price for ES stock?
Based on current market trends and expert analysis, the target price for ES stock is projected to reach $75-$80 by the end of 2026.
What is the price prediction for Eclipse Metals in 2030?
Based on current market trends and potential growth, Eclipse Metals could reach $0.50 to $1.00 per token by 2030, representing significant upside from current levels.
What is the S&P 500 forecast for 2025?
Based on current market trends and economic projections, the S&P 500 is forecasted to reach around 5,500 to 5,800 points by the end of 2025, representing a potential 15-20% increase from current levels.
Share
Content
Introduction: ES's Market Position and Investment Value
I. ES Price History Review and Current Market Status
II. Key Factors Affecting Future ES Price
III. ES Price Prediction for 2025-2030
IV. Professional Investment Strategies and Risk Management for ES
V. Potential Risks and Challenges for ES
VI. Conclusion and Action Recommendations
FAQ

