2025 MLN Price Prediction: Analyzing Market Trends and Potential Growth Factors for Melon Token
Introduction: MLN's Market Position and Investment Value
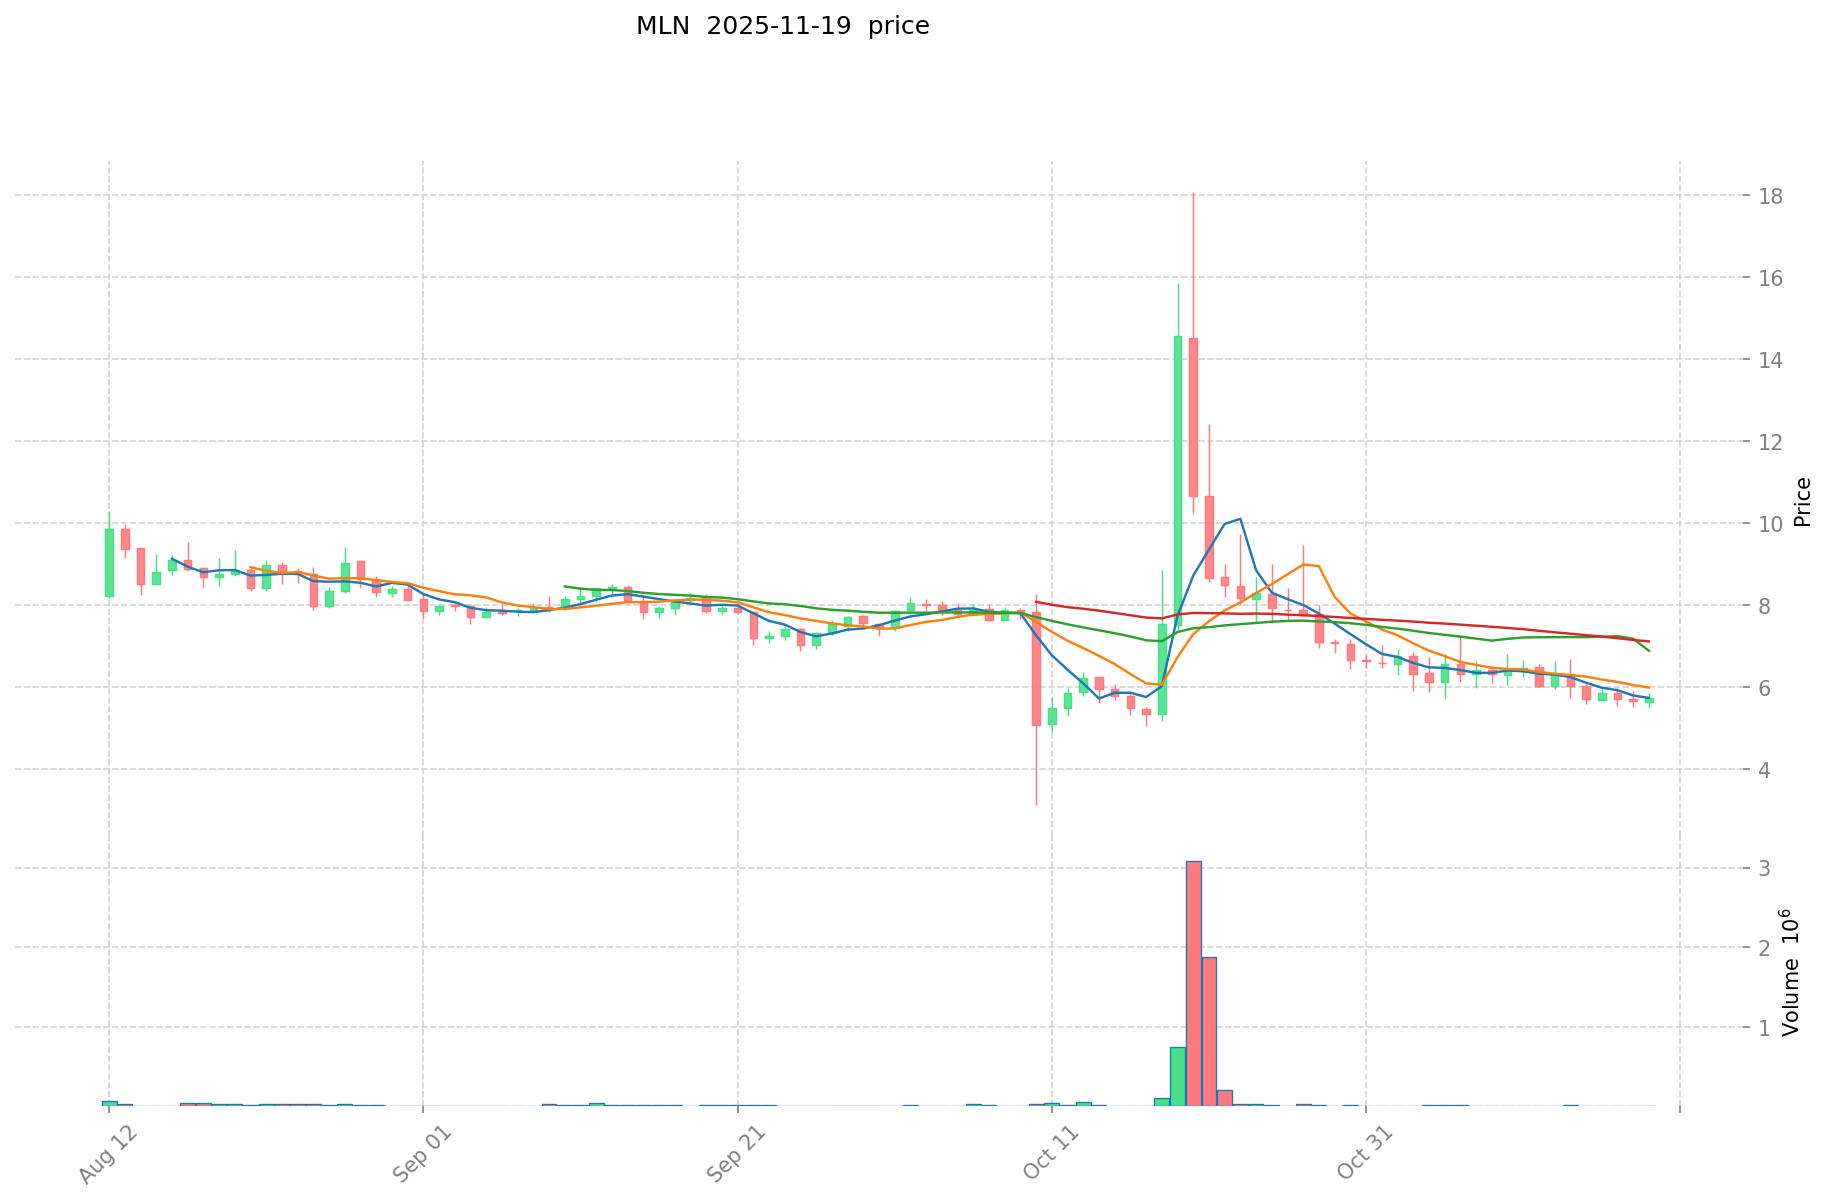
Enzyme (MLN), as a key player in the DeFi ecosystem for on-chain asset management, has made significant strides since its inception in 2017. As of 2025, MLN's market capitalization has reached $16,523,043, with a circulating supply of approximately 2,988,432 tokens, and a price hovering around $5.529. This asset, often referred to as the "DeFi asset management enabler," is playing an increasingly crucial role in facilitating decentralized investment strategies and portfolio management.
This article will comprehensively analyze MLN's price trends from 2025 to 2030, considering historical patterns, market supply and demand, ecosystem development, and macroeconomic factors to provide investors with professional price predictions and practical investment strategies.
I. MLN Price History Review and Current Market Status
MLN Historical Price Evolution
- 2018: MLN reached its all-time high of $258.26 on January 4th
- 2020: MLN hit its all-time low of $1.79 on March 13th during the crypto market crash
- 2021-2022: MLN experienced significant price volatility during the bull and bear market cycles
MLN Current Market Situation
As of November 20, 2025, MLN is trading at $5.529, with a market cap of $16,523,043. The token has seen a 3.12% decrease in the last 24 hours and a significant 47.75% drop over the past 30 days. The current price is 97.86% below its all-time high and 208.88% above its all-time low. The circulating supply of 2,988,432 MLN tokens represents 100% of the total supply, indicating full distribution. The trading volume in the last 24 hours stands at $13,045, suggesting moderate market activity. The current market sentiment for MLN appears bearish in the short term, reflecting the broader crypto market conditions.
Click to view the current MLN market price
MLN Market Sentiment Indicator
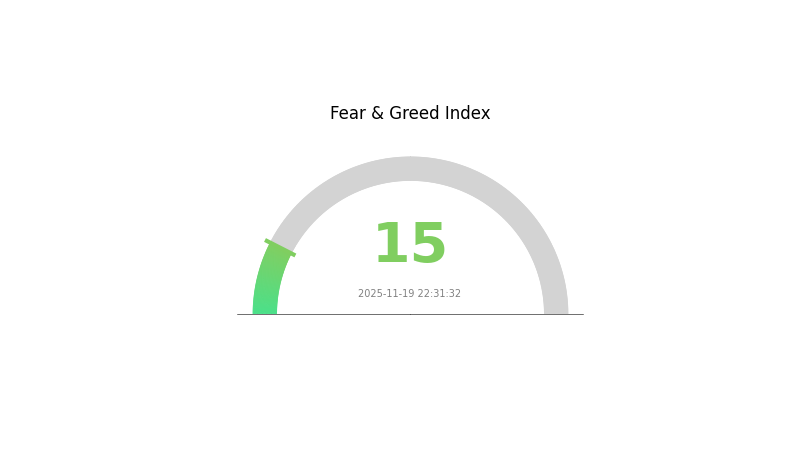
2025-11-19 Fear and Greed Index: 15 (Extreme Fear)
Click to view the current Fear & Greed Index
The crypto market is currently experiencing extreme fear, with the Fear and Greed Index plummeting to 15. This suggests a highly pessimistic sentiment among investors, potentially creating oversold conditions. However, historical data shows that such extreme fear often precedes market bottoms, presenting potential buying opportunities for contrarian investors. As always, it's crucial to conduct thorough research and manage risk appropriately before making any investment decisions in this volatile market.
MLN Holdings Distribution
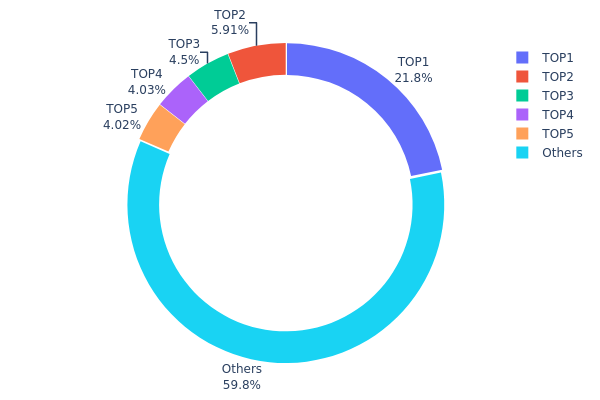
The address holdings distribution data for MLN reveals a moderately concentrated ownership structure. The top address holds a significant 21.75% of the total supply, with 644,810 MLN tokens. The subsequent four largest holders possess between 4% and 6% each, collectively accounting for 18.44% of the supply. This distribution pattern indicates a notable level of concentration among the top holders.
However, it's important to note that 59.81% of MLN tokens are distributed among other addresses, suggesting a degree of decentralization beyond the top holders. This split between major holders and a more dispersed ownership base could impact market dynamics. The concentration in top addresses may lead to increased price volatility if large holders decide to trade significant portions of their holdings. Conversely, the substantial distribution among other addresses could provide some stability and resistance to market manipulation.
Overall, the current MLN address distribution reflects a balance between centralized influence and wider market participation. While the presence of large holders suggests potential for price swings, the broader distribution among other addresses indicates a developing ecosystem with diverse stakeholders, which is crucial for long-term stability and growth in the MLN market.
Click to view the current MLN Holdings Distribution
| Top | Address | Holding Qty | Holding (%) |
|---|---|---|---|
| 1 | 0xf977...41acec | 644.81K | 21.75% |
| 2 | 0x1c36...37d2c7 | 175.31K | 5.91% |
| 3 | 0xa64e...24f61d | 133.32K | 4.49% |
| 4 | 0x3c75...383a6a | 119.59K | 4.03% |
| 5 | 0xd2dd...e6869f | 119.08K | 4.01% |
| - | Others | 1771.92K | 59.81% |
II. Key Factors Influencing MLN's Future Price
Supply Mechanism
- Halving mechanism: Similar to Bitcoin, MLN may have a halving mechanism that affects its supply and potentially impacts its price.
Technical Development and Ecosystem Building
- DeFi development: The growth and adoption of decentralized finance (DeFi) will significantly influence MLN's future prospects, as it is a decentralized asset management protocol token.
- Technology maturity: The maturity and market acceptance of Melon Protocol as a decentralized asset management platform is a crucial factor in determining MLN's price.
- Ecosystem applications: The development of DApps and ecosystem projects within the Melon network will play a role in driving MLN's value.
III. MLN Price Prediction for 2025-2030
2025 Outlook
- Conservative prediction: $4.50 - $5.00
- Neutral prediction: $5.50 - $6.00
- Optimistic prediction: $6.00 - $6.17 (requires positive market sentiment and increased adoption)
2027-2028 Outlook
- Market stage expectation: Potential growth phase with increased volatility
- Price range forecast:
- 2027: $5.60 - $8.37
- 2028: $7.27 - $8.66
- Key catalysts: Technological advancements, wider institutional adoption, and favorable regulatory developments
2030 Long-term Outlook
- Base scenario: $8.00 - $10.00 (assuming steady market growth and adoption)
- Optimistic scenario: $10.00 - $11.69 (assuming accelerated adoption and favorable market conditions)
- Transformative scenario: $11.69+ (in case of groundbreaking technological breakthroughs or mass adoption)
- 2030-12-31: MLN $9.06 (potential year-end average price)
| 年份 | 预测最高价 | 预测平均价格 | 预测最低价 | 涨跌幅 |
|---|---|---|---|---|
| 2025 | 6.17271 | 5.561 | 4.50441 | 0 |
| 2026 | 8.33093 | 5.86686 | 3.87212 | 6 |
| 2027 | 8.3767 | 7.09889 | 5.60813 | 28 |
| 2028 | 8.66633 | 7.7378 | 7.27353 | 39 |
| 2029 | 9.9245 | 8.20206 | 5.41336 | 48 |
| 2030 | 11.69163 | 9.06328 | 4.62227 | 63 |
IV. MLN Professional Investment Strategies and Risk Management
MLN Investment Methodology
(1) Long-term Holding Strategy
- Suitable for: Long-term investors with high risk tolerance
- Operation suggestions:
- Accumulate MLN tokens during market dips
- Hold for at least 2-3 years to ride out market volatility
- Store tokens in a secure non-custodial wallet
(2) Active Trading Strategy
- Technical analysis tools:
- Moving Averages: Use to identify trends and potential reversal points
- Relative Strength Index (RSI): Helps determine overbought or oversold conditions
- Key points for swing trading:
- Monitor MLN's correlation with larger market trends
- Set strict stop-loss orders to manage downside risk
MLN Risk Management Framework
(1) Asset Allocation Principles
- Conservative investors: 1-3% of crypto portfolio
- Aggressive investors: 5-8% of crypto portfolio
- Professional investors: Up to 15% of crypto portfolio
(2) Risk Hedging Solutions
- Diversification: Spread investments across different DeFi projects
- Use of stablecoins: Allocate a portion of portfolio to stablecoins during high volatility periods
(3) Secure Storage Solutions
- Hot wallet recommendation: Gate web3 wallet
- Cold storage solution: Hardware wallet for long-term holdings
- Security precautions: Enable two-factor authentication, use strong passwords, and regularly update software
V. Potential Risks and Challenges for MLN
MLN Market Risks
- High volatility: MLN price can experience significant fluctuations
- Limited liquidity: May face challenges in large volume trades
- Competition: Other DeFi asset management platforms may gain market share
MLN Regulatory Risks
- Uncertain regulatory environment: DeFi regulations are still evolving
- Cross-border compliance: Different jurisdictions may have varying stances on MLN
- Potential for increased scrutiny: As DeFi grows, regulators may impose stricter rules
MLN Technical Risks
- Smart contract vulnerabilities: Potential for exploits in the Enzyme protocol
- Scalability issues: Ethereum network congestion could affect MLN transactions
- Technological obsolescence: Rapid innovations in DeFi may challenge MLN's relevance
VI. Conclusion and Action Recommendations
MLN Investment Value Assessment
MLN offers long-term potential in the DeFi asset management space but faces short-term volatility and regulatory uncertainties. Its value proposition lies in its on-chain investment strategy capabilities, but investors should be prepared for significant price fluctuations.
MLN Investment Recommendations
✅ Beginners: Start with small positions and focus on learning about DeFi and on-chain asset management ✅ Experienced investors: Consider MLN as part of a diversified DeFi portfolio, employing dollar-cost averaging ✅ Institutional investors: Explore MLN for exposure to innovative DeFi asset management solutions, while closely monitoring regulatory developments
MLN Trading Participation Methods
- Spot trading: Buy and hold MLN tokens on Gate.com
- DeFi participation: Use MLN to create or invest in on-chain investment vaults
- Yield farming: Explore liquidity provision opportunities involving MLN tokens
Cryptocurrency investments carry extremely high risks, and this article does not constitute investment advice. Investors should make decisions carefully based on their own risk tolerance and are advised to consult professional financial advisors. Never invest more than you can afford to lose.
FAQ
Will meme coin reach $1?
It's unlikely for most meme coins to reach $1. However, some with strong communities and ecosystems might achieve significant growth, potentially approaching this target in the long term.
How high will Melanie Coin go?
Based on current market analysis, Melanie Coin is predicted to reach between $0.001508 and $0.001515 by 2030.
Can Solana reach $1000 in 2025?
Yes, Solana reached $1000 in 2025. Its high-speed blockchain and scalability drove growth. Institutional and developer interest fueled its rise.
Which coin will reach $1 in 2030?
Bitcoin is projected to reach $1 million by 2030, based on mathematical analysis and market valuation frameworks. This forecast is grounded in data, not speculation, considering Bitcoin's potential market capture in the global store-of-value market.
Share
Content
Introduction: MLN's Market Position and Investment Value
I. MLN Price History Review and Current Market Status
II. Key Factors Influencing MLN's Future Price
III. MLN Price Prediction for 2025-2030
IV. MLN Professional Investment Strategies and Risk Management
V. Potential Risks and Challenges for MLN
VI. Conclusion and Action Recommendations
FAQ

