2025 Q Price Prediction: Analyzing Market Trends and Economic Factors Shaping Future Valuations
Introduction: Q's Market Position and Investment Value
Quack AI (Q), as the AI-native governance layer for Web3, has transformed fragmented governance into automated, auditable workflows since its inception. As of 2025, Quack AI's market capitalization has reached $23,055,472, with a circulating supply of approximately 1,616,000,000 tokens, and a price hovering around $0.014267. This asset, hailed as the "Web3 Governance Innovator," is playing an increasingly crucial role in decentralized decision-making and community management.
This article will comprehensively analyze Quack AI's price trends from 2025 to 2030, combining historical patterns, market supply and demand, ecosystem development, and macroeconomic factors to provide investors with professional price predictions and practical investment strategies.
I. Q Price History Review and Current Market Status
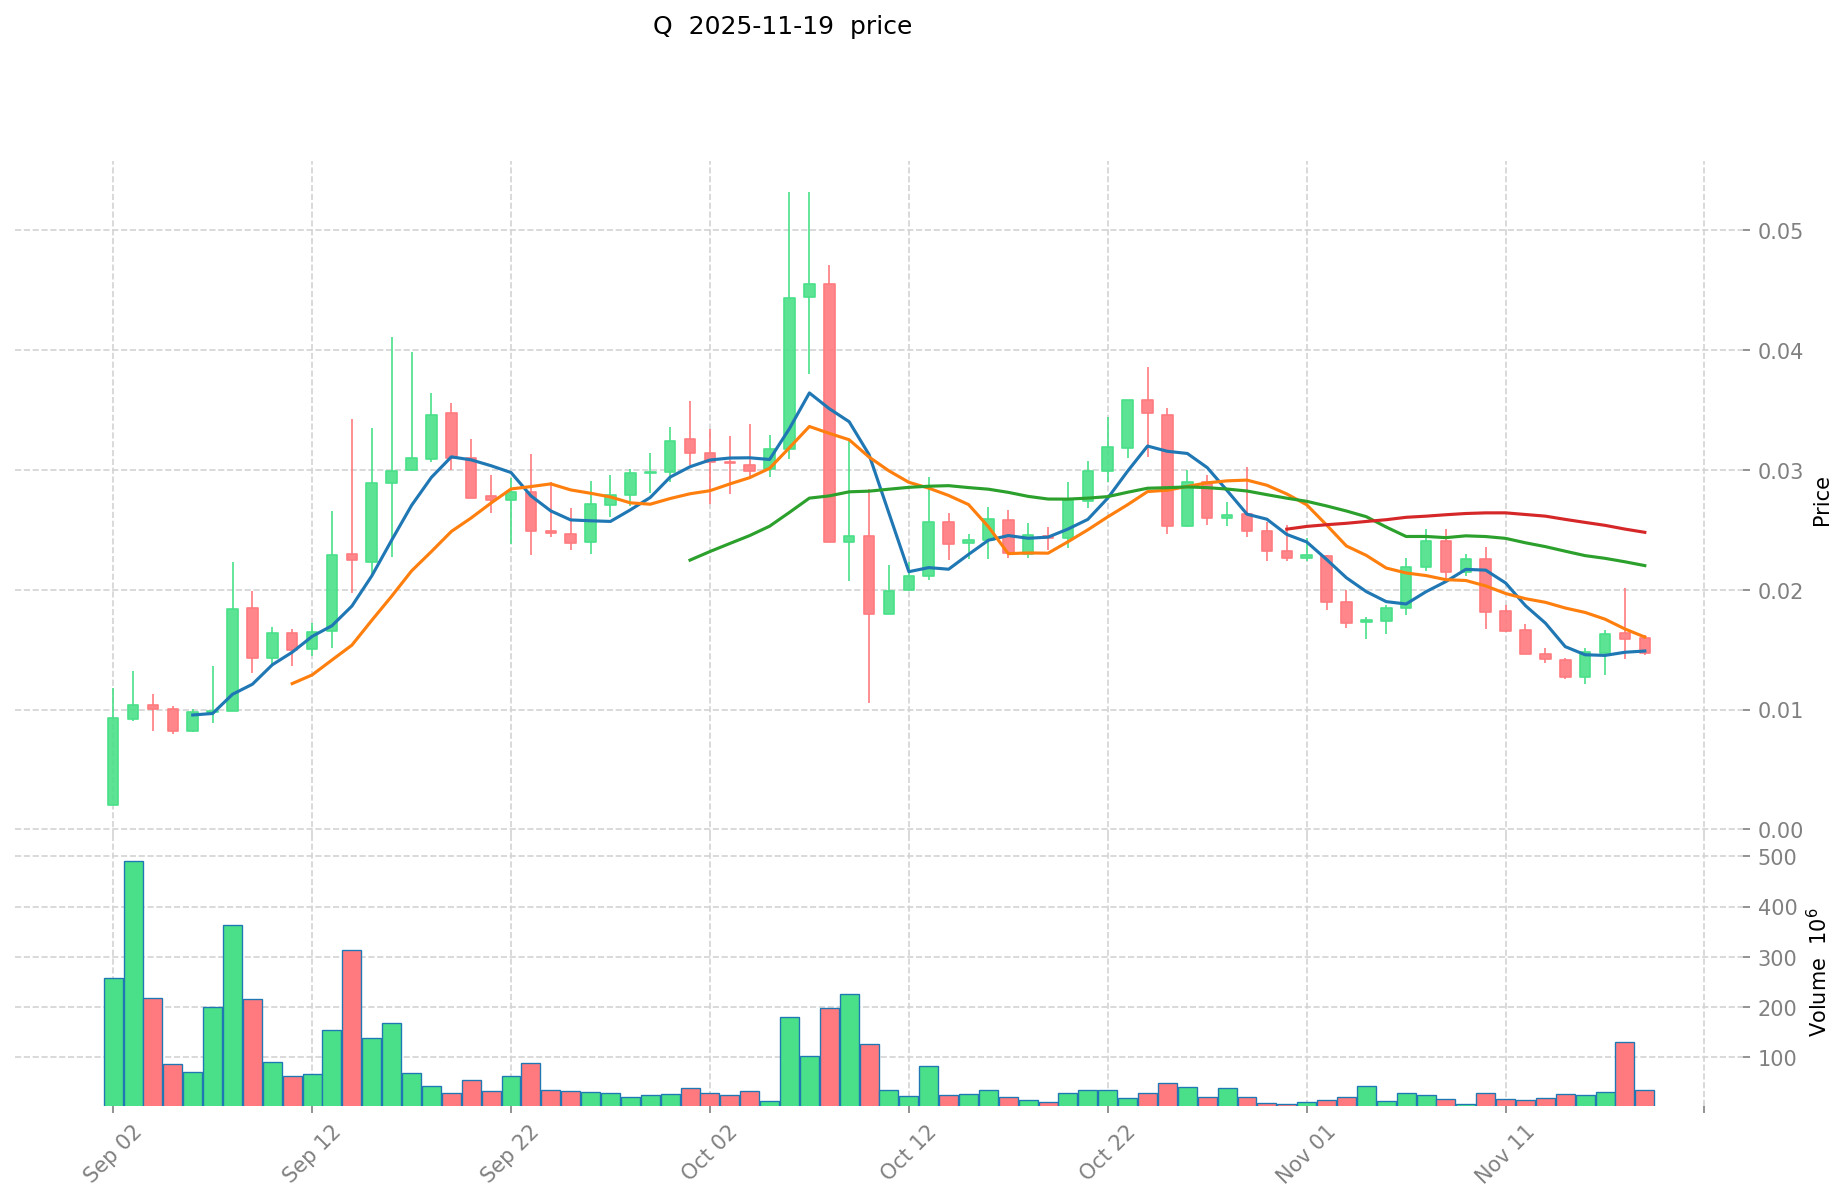
Q Historical Price Evolution
- 2025: Project launch, price started at $0.01
- September 2025: Reached all-time low of $0.002
- October 2025: Surged to all-time high of $0.053205
Q Current Market Situation
As of November 19, 2025, Q is trading at $0.014267. The token has experienced a significant decline from its all-time high, currently down 73.18% from its peak. In the past 24 hours, Q has seen a 6.25% decrease in price, with the daily trading volume reaching $408,327.03.
The market capitalization of Q stands at $23,055,472, ranking it 864th in the overall cryptocurrency market. The circulating supply is 1,616,000,000 Q tokens, representing 16.16% of the total supply of 10,000,000,000 tokens.
Short-term price trends show mixed signals, with a 0.5% increase in the last hour but declines of 15.55% over the past week and 41.94% over the last month. The current market sentiment appears bearish, reflecting broader cryptocurrency market conditions.
Click to view the current Q market price
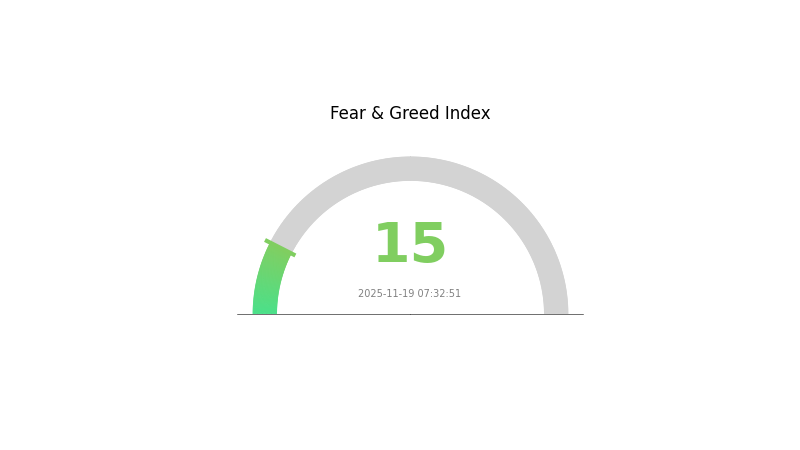
Q Market Sentiment Indicator
2025-11-19 Fear and Greed Index: 15 (Extreme Fear)
Click to view the current Fear & Greed Index
The crypto market is gripped by extreme fear, with the sentiment index plummeting to 15. This level of pessimism often precedes potential buying opportunities, as assets may be undervalued. However, caution is advised as market volatility could persist. Savvy investors might consider dollar-cost averaging or exploring stable assets on Gate.com to navigate this uncertain terrain. Remember, market sentiment can shift rapidly, so stay informed and adjust your strategy accordingly.
Q Holdings Distribution
The address holdings distribution data provides crucial insights into the concentration of Q tokens among different wallet addresses. Analysis of this data reveals a significant concentration of Q tokens in a few top addresses. The top address holds 24.06% of the total supply, while the top 5 addresses collectively control 64.81% of all Q tokens.
This high concentration of holdings raises concerns about potential market manipulation and volatility. With such a large portion of tokens in few hands, any significant movement from these addresses could cause substantial price fluctuations. Moreover, this concentration may impact the overall decentralization of the Q ecosystem, as major decisions or governance actions could be disproportionately influenced by these large holders.
The current distribution structure suggests a relatively centralized ownership pattern, which may pose challenges to the long-term stability and equitable growth of the Q network. However, it's worth noting that 35.19% of tokens are distributed among other addresses, indicating some level of broader participation. Monitoring changes in this distribution over time will be crucial for assessing the evolving health and decentralization of the Q ecosystem.
Click to view the current Q Holdings Distribution
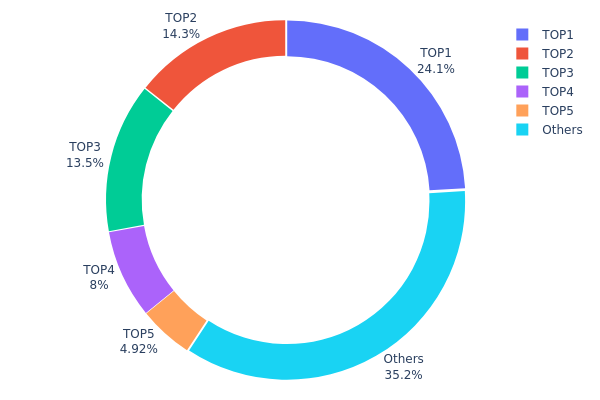
| Top | Address | Holding Qty | Holding (%) |
|---|---|---|---|
| 1 | 0x74d8...633f55 | 1203222.22K | 24.06% |
| 2 | 0x78ac...c2671e | 716666.67K | 14.33% |
| 3 | 0x5214...852638 | 675000.00K | 13.50% |
| 4 | 0x8cac...49cedf | 400000.00K | 8.00% |
| 5 | 0x7084...5a7169 | 246000.00K | 4.92% |
| - | Others | 1759102.61K | 35.19% |
II. Key Factors Influencing Q's Future Price
Macroeconomic Environment
- Impact of Monetary Policy: The Bank of England is expected to potentially cut interest rates in December, responding to cooling inflation and sluggish economic growth.
- Inflation Hedging Properties: Core CPI in China has shown consecutive increases, supported by above-seasonal price rises in medical services and household appliances.
- Geopolitical Factors: Global geopolitical tensions are driving increased "safety demand," particularly affecting metal prices.
Technical Development and Ecosystem Building
- Metal Price Trends: Metal prices are likely to exhibit sustained wave-like increases, influenced by underinvestment in global mining capital expenditure and heightened geopolitical tensions.
III. Q Price Prediction for 2025-2030
2025 Outlook
- Conservative prediction: $0.00907 - $0.01417
- Neutral prediction: $0.01417 - $0.01587
- Optimistic prediction: $0.01587 - $0.01757 (requires positive market sentiment)
2027 Outlook
- Market phase expectation: Potential growth phase
- Price range forecast:
- 2026: $0.0092 - $0.02317
- 2027: $0.01054 - $0.02518
- Key catalysts: Increased adoption and technological advancements
2030 Long-term Outlook
- Base scenario: $0.02039 - $0.02756 (assuming steady market growth)
- Optimistic scenario: $0.02756 - $0.03362 (assuming strong market performance)
- Transformative scenario: $0.03362+ (assuming breakthrough innovations and mass adoption)
- 2030-12-31: Q $0.03362 (potential peak price)
| 年份 | 预测最高价 | 预测平均价格 | 预测最低价 | 涨跌幅 |
|---|---|---|---|---|
| 2025 | 0.01757 | 0.01417 | 0.00907 | 0 |
| 2026 | 0.02317 | 0.01587 | 0.0092 | 11 |
| 2027 | 0.02518 | 0.01952 | 0.01054 | 36 |
| 2028 | 0.02302 | 0.02235 | 0.02011 | 56 |
| 2029 | 0.03244 | 0.02268 | 0.0152 | 58 |
| 2030 | 0.03362 | 0.02756 | 0.02039 | 93 |
IV. Q Professional Investment Strategies and Risk Management
Q Investment Methodology
(1) Long-term Holding Strategy
- Suitable for: Risk-tolerant investors with a belief in Web3 governance
- Operation suggestions:
- Accumulate Q tokens during market dips
- Stay informed about QuackAI's development and adoption in the DAO ecosystem
- Store tokens securely in a non-custodial wallet
(2) Active Trading Strategy
- Technical analysis tools:
- Moving Averages: Use to identify trends and potential reversal points
- Relative Strength Index (RSI): Monitor overbought/oversold conditions
- Key points for swing trading:
- Monitor governance proposal activities and their impact on token price
- Track adoption rates of QuackAI among DAOs and RWA projects
Q Risk Management Framework
(1) Asset Allocation Principles
- Conservative investors: 1-3% of crypto portfolio
- Aggressive investors: 5-10% of crypto portfolio
- Professional investors: Up to 15% of crypto portfolio
(2) Risk Hedging Plans
- Diversification: Spread investments across multiple governance tokens
- Stop-loss orders: Implement to limit potential losses
(3) Secure Storage Solutions
- Hot wallet recommendation: Gate Web3 Wallet
- Cold storage solution: Hardware wallet for long-term holdings
- Security precautions: Enable two-factor authentication, use strong passwords, and regularly update software
V. Q Potential Risks and Challenges
Q Market Risks
- Volatility: High price fluctuations common in emerging crypto assets
- Liquidity: Potential challenges in large-volume trades
- Competition: Emergence of rival AI-powered governance platforms
Q Regulatory Risks
- Uncertain regulatory landscape for AI-powered governance tools
- Potential compliance issues for DAOs using automated decision-making
- Cross-border regulatory challenges for multi-chain operations
Q Technical Risks
- Smart contract vulnerabilities: Potential for exploits or bugs
- AI model limitations: Accuracy and bias concerns in decision-making
- Scalability issues: Challenges in handling increased network load
VI. Conclusion and Action Recommendations
Q Investment Value Assessment
QuackAI (Q) presents a unique value proposition in the growing field of Web3 governance. While it offers potential for long-term growth as DAOs and RWA projects adopt AI-powered decision-making, short-term volatility and regulatory uncertainties pose significant risks.
Q Investment Recommendations
✅ Beginners: Consider small, exploratory positions after thorough research ✅ Experienced investors: Implement dollar-cost averaging strategy with strict risk management ✅ Institutional investors: Evaluate Q as part of a diversified Web3 governance portfolio
Q Trading Participation Methods
- Spot trading: Direct purchase and holding of Q tokens
- Staking: Participate in governance and earn rewards, if available
- DAO participation: Engage with QuackAI-powered DAOs to gain practical insights
Cryptocurrency investments carry extremely high risks, and this article does not constitute investment advice. Investors should make decisions carefully based on their own risk tolerance, and it is advisable to consult professional financial advisors. Never invest more than you can afford to lose.
FAQ
Will QNT reach $1000?
Yes, QNT is projected to reach $1000 by 2035. The long-term outlook for Quant is bullish, driven by its innovative blockchain interoperability solutions.
How much will 1 QNT be worth in 2030?
Based on current projections, 1 QNT could be worth around $75.83 by mid-2030 and approximately $81.94 by the end of 2030.
What is the target price for QCOM in 2025?
Based on analyst consensus as of November 19, 2025, the target price for QCOM in 2025 is $186.94, indicating a potential 0.00% increase from the current price.
Can quant reach $50,000?
While unlikely, it's not impossible. Quant reaching $50,000 would require significant market growth, widespread adoption, and favorable regulatory conditions.
Share
Content
Introduction: Q's Market Position and Investment Value
I. Q Price History Review and Current Market Status
II. Key Factors Influencing Q's Future Price
III. Q Price Prediction for 2025-2030
IV. Q Professional Investment Strategies and Risk Management
V. Q Potential Risks and Challenges
VI. Conclusion and Action Recommendations
FAQ

