2025 RDNT Price Prediction: Analyzing Market Trends and Potential Growth Factors
Introduction: RDNT's Market Position and Investment Value
Radiant (RDNT), as the first omnipotent chain currency market based on LayerZero, has achieved significant milestones since its inception. As of 2025, RDNT's market capitalization has reached $15,982,954, with a circulating supply of approximately 1,292,073,967 tokens, and a price hovering around $0.01237. This asset, known as the "cross-chain lending pioneer," is playing an increasingly crucial role in decentralized finance (DeFi) and cross-chain interactions.
This article will comprehensively analyze RDNT's price trends from 2025 to 2030, combining historical patterns, market supply and demand, ecosystem development, and macroeconomic environment to provide investors with professional price predictions and practical investment strategies.
I. RDNT Price History Review and Current Market Status
RDNT Historical Price Evolution
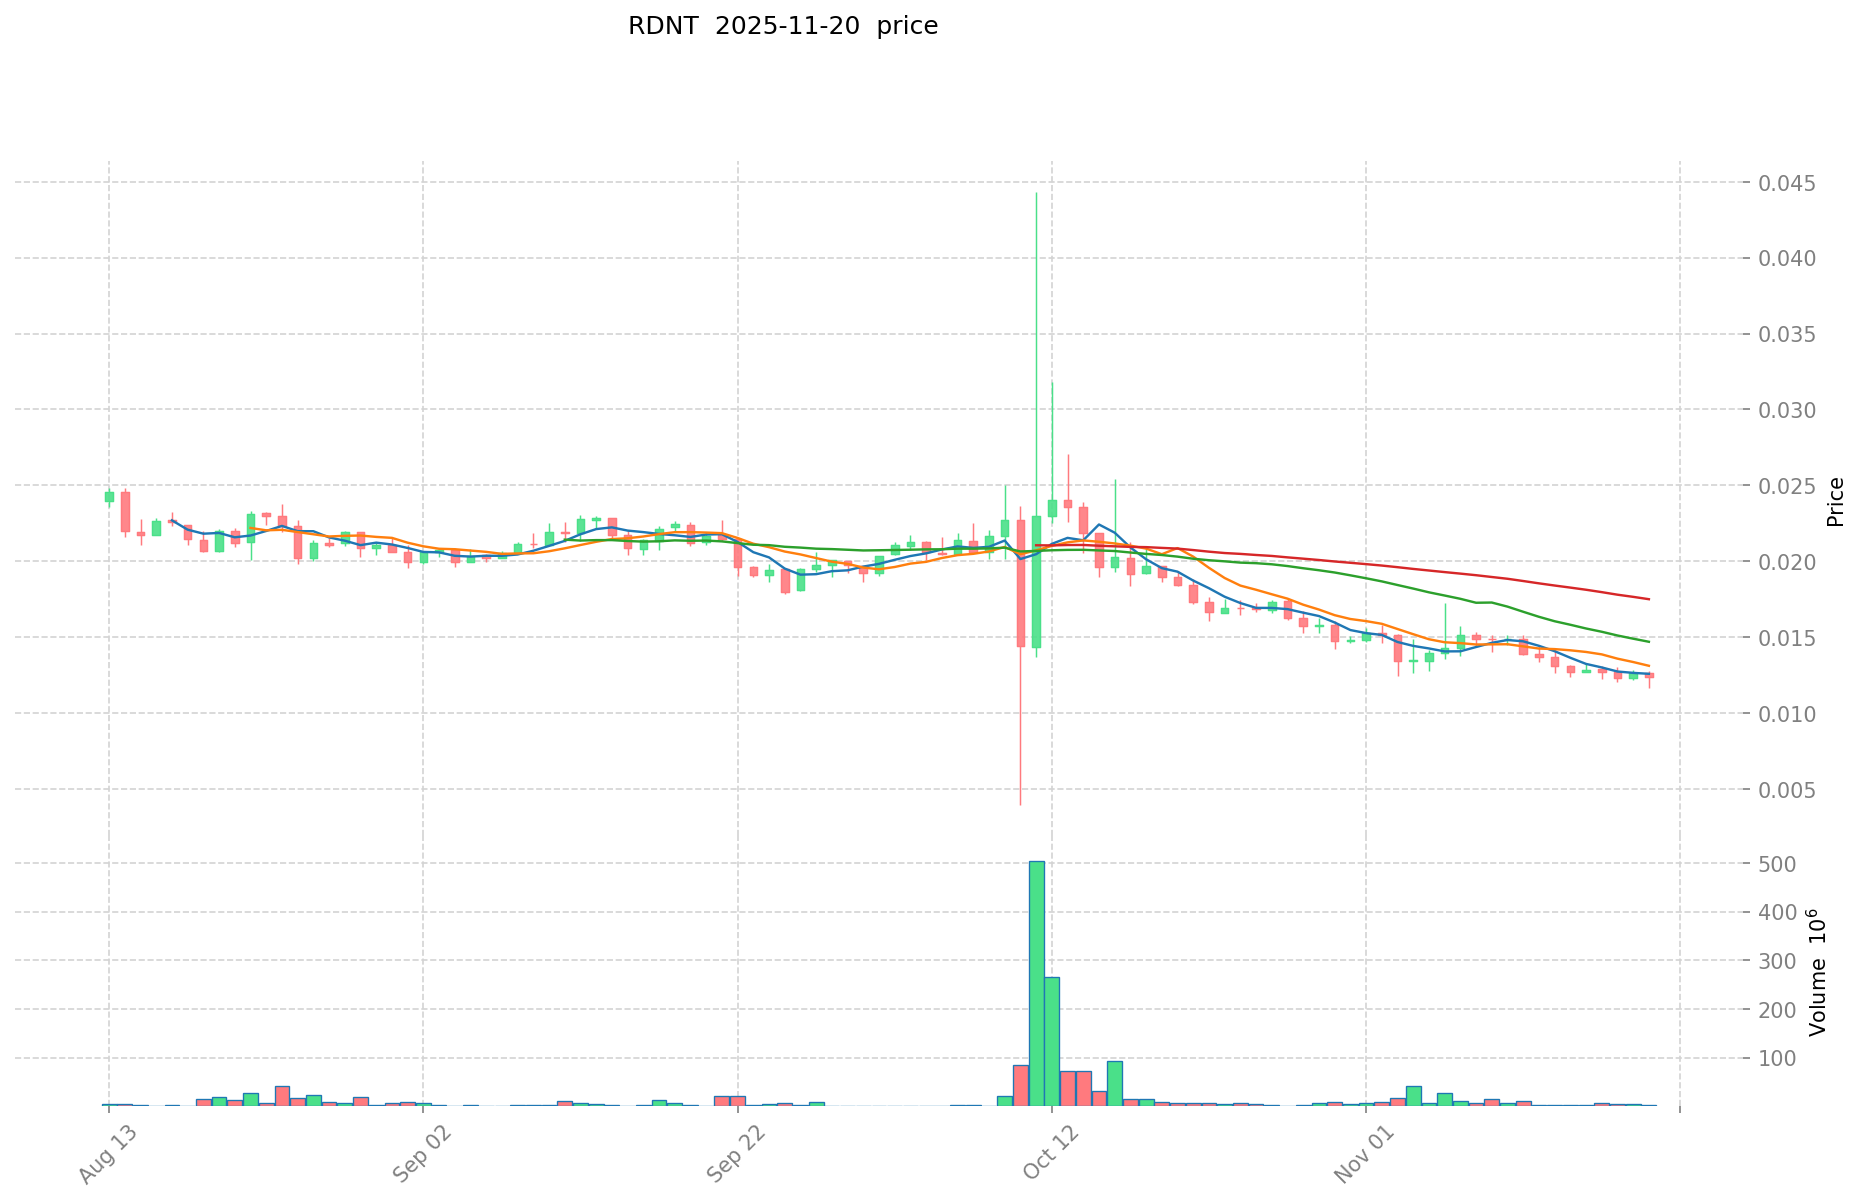
- 2022: All-time high reached, price peaked at $0.585268 on September 16
- 2023: Market correction phase, price experienced significant volatility
- 2025: Bearish trend continued, price dropped to an all-time low of $0.0091192 on October 11
RDNT Current Market Situation
RDNT is currently trading at $0.01237, showing a 24-hour decrease of 2.51%. The token has experienced a significant decline over the past year, with a 78.8% drop in value. In the short term, RDNT has shown mixed performance, with a 0.41% increase in the last hour but a 10.02% decrease over the past week. The 30-day trend indicates a substantial downturn of 32.41%. With a market capitalization of $15,982,954.97 and a fully diluted valuation of $18,555,000, RDNT currently ranks 1012th in the cryptocurrency market. The circulating supply stands at 1,292,073,967 RDNT, which represents 86.14% of the total supply of 1,500,000,000 tokens.
Click to view the current RDNT market price
RDNT Market Sentiment Indicator
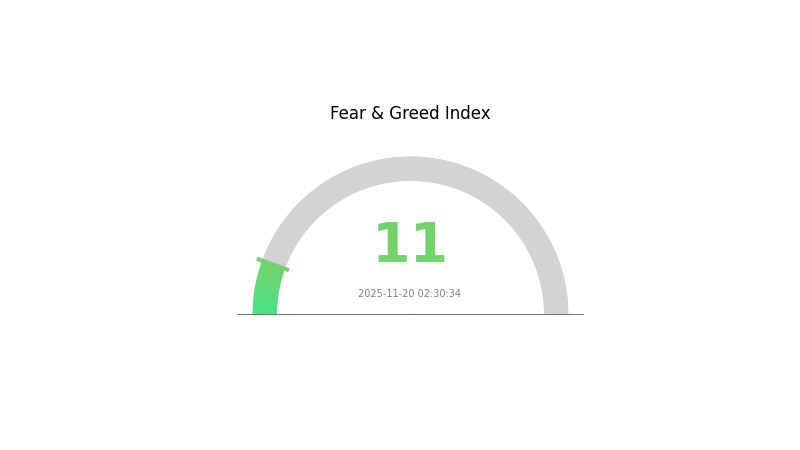
2025-11-20 Fear and Greed Index: 11 (Extreme Fear)
Click to view the current Fear & Greed Index
The crypto market is experiencing extreme fear, with the sentiment indicator plummeting to 11. This level of pessimism often signals a potential buying opportunity for contrarian investors. However, it's crucial to approach with caution and conduct thorough research. While fear grips the market, savvy traders may find undervalued assets. Remember, market cycles are natural, and extreme sentiment often precedes significant price movements. Stay informed and consider diversifying your portfolio to navigate these turbulent times.
RDNT Holdings Distribution
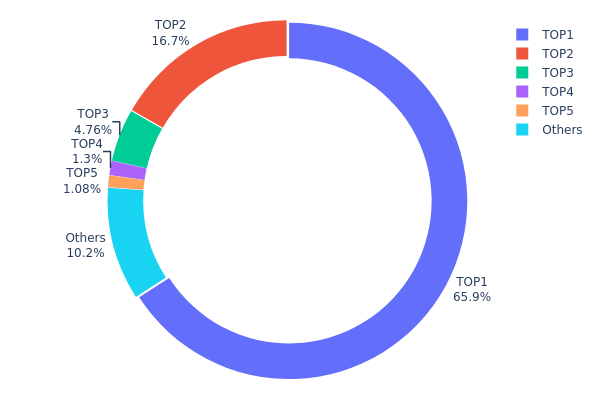
The address holdings distribution data provides crucial insights into the concentration of RDNT tokens among different wallet addresses. Analysis of this data reveals a highly centralized distribution pattern for RDNT. The top address holds a staggering 65.89% of the total supply, while the second-largest holder accounts for 16.74%. Together, these two addresses control over 82% of all RDNT tokens.
This extreme concentration raises significant concerns about market stability and potential price manipulation. With such a large portion of tokens held by a few addresses, there is an increased risk of sudden large-scale sell-offs or buying pressure that could dramatically impact RDNT's price. Moreover, this centralization undermines the principle of decentralization often associated with cryptocurrency projects.
The current distribution structure suggests a relatively low level of on-chain diversity and limited retail participation. This concentration could potentially deter new investors and hinder broader market adoption. It also indicates that RDNT's on-chain structure may be less stable and more susceptible to significant shifts if major holders decide to alter their positions.
Click to view the current RDNT Holdings Distribution
| Top | Address | Holding Qty | Holding (%) |
|---|---|---|---|
| 1 | 0xf977...41acec | 79506.90K | 65.89% |
| 2 | 0xba12...6bf2c8 | 20200.15K | 16.74% |
| 3 | 0x14b0...f30919 | 5743.52K | 4.76% |
| 4 | 0x0529...c553b7 | 1562.56K | 1.29% |
| 5 | 0x28e3...4e3797 | 1297.03K | 1.07% |
| - | Others | 12339.05K | 10.25% |
II. Key Factors Influencing RDNT's Future Price
Supply Mechanism
- Token Release Schedule: The gradual release of RDNT tokens may affect price dynamics
- Current Impact: Token release rhythm needs to be considered when analyzing price fluctuations
Institutional and Whale Dynamics
- Whale Concentration: High concentration of tokens among large holders may impact market operations and governance
- Market Risks: Investors should be cautious of potential market risks and reduced liquidity due to whale concentration
Macroeconomic Environment
- Monetary Policy Impact: Global economic conditions and monetary policies may indirectly influence RDNT price
- Regulatory Factors: The development of DeFi-supportive regulatory policies could impact RDNT's growth potential
Technical Development and Ecosystem Building
- V2 Version Upgrade: Potential resolution of high gas fees and liquidity fragmentation issues
- Cross-chain Compatibility: Deepening multi-chain compatibility to support long-term development
- Ecosystem Applications: Expansion of Total Value Locked (TVL) and improvement in protocol utilization rate
- Community Governance: Ongoing progress in community governance to support long-term growth
III. RDNT Price Prediction for 2025-2030
2025 Outlook
- Conservative forecast: $0.00867 - $0.01238
- Neutral forecast: $0.01238 - $0.01325
- Optimistic forecast: $0.01325 - $0.01411 (requires favorable market conditions)
2027-2028 Outlook
- Market phase expectation: Potential growth phase
- Price range forecast:
- 2027: $0.01281 - $0.0207
- 2028: $0.01411 - $0.02506
- Key catalysts: Increasing adoption and technological advancements
2029-2030 Long-term Outlook
- Base scenario: $0.02181 - $0.02574 (assuming steady market growth)
- Optimistic scenario: $0.02574 - $0.03809 (assuming strong market performance)
- Transformative scenario: $0.03809+ (assuming exceptional market conditions and widespread adoption)
- 2030-12-31: RDNT $0.03809 (potential peak price)
| 年份 | 预测最高价 | 预测平均价格 | 预测最低价 | 涨跌幅 |
|---|---|---|---|---|
| 2025 | 0.01411 | 0.01238 | 0.00867 | 0 |
| 2026 | 0.0196 | 0.01325 | 0.00901 | 7 |
| 2027 | 0.0207 | 0.01643 | 0.01281 | 32 |
| 2028 | 0.02506 | 0.01856 | 0.01411 | 50 |
| 2029 | 0.02966 | 0.02181 | 0.01134 | 76 |
| 2030 | 0.03809 | 0.02574 | 0.02239 | 108 |
IV. RDNT Professional Investment Strategies and Risk Management
RDNT Investment Methodology
(1) Long-term Holding Strategy
- Suitable for: Risk-tolerant investors with a long-term perspective
- Operation suggestions:
- Accumulate RDNT tokens during market dips
- Set price targets for partial profit-taking
- Store tokens in secure wallets with private key control
(2) Active Trading Strategy
- Technical analysis tools:
- Moving Averages: Use to identify trends and potential reversal points
- Relative Strength Index (RSI): Monitor overbought/oversold conditions
- Key points for swing trading:
- Monitor market sentiment and project developments
- Set strict stop-loss orders to manage downside risk
RDNT Risk Management Framework
(1) Asset Allocation Principles
- Conservative investors: 1-3% of crypto portfolio
- Aggressive investors: 5-10% of crypto portfolio
- Professional investors: Up to 15% of crypto portfolio
(2) Risk Hedging Solutions
- Diversification: Spread investments across multiple crypto assets
- Stop-loss orders: Implement to limit potential losses
(3) Secure Storage Solutions
- Hardware wallet recommendation: Gate Web3 Wallet
- Cold storage option: Paper wallet for long-term holdings
- Security precautions: Use two-factor authentication, avoid sharing private keys
V. Potential Risks and Challenges for RDNT
RDNT Market Risks
- High volatility: RDNT price may experience significant fluctuations
- Competition: Other DeFi projects may impact Radiant's market share
- Liquidity risk: Low trading volume may lead to price slippage
RDNT Regulatory Risks
- Uncertain regulatory environment: Potential for increased scrutiny of DeFi projects
- Cross-chain compliance: Challenges in adhering to regulations across multiple blockchains
- KYC/AML requirements: Possible implementation of stricter user verification processes
RDNT Technical Risks
- Smart contract vulnerabilities: Potential for exploits or bugs in the protocol
- Cross-chain risks: Challenges in maintaining security across multiple blockchains
- Scalability issues: Possible network congestion during high demand periods
VI. Conclusion and Action Recommendations
RDNT Investment Value Assessment
RDNT presents a unique value proposition in the cross-chain DeFi space but faces significant short-term volatility and regulatory uncertainties. Long-term potential is balanced by technical and market risks.
RDNT Investment Recommendations
✅ Beginners: Consider small, long-term positions after thorough research ✅ Experienced investors: Implement dollar-cost averaging strategy with strict risk management ✅ Institutional investors: Explore strategic partnerships and conduct comprehensive due diligence
RDNT Trading Participation Methods
- Spot trading: Purchase RDNT tokens on Gate.com
- Yield farming: Participate in Radiant's liquidity mining programs
- Lending/borrowing: Utilize Radiant's cross-chain money market features
Cryptocurrency investments carry extremely high risks, and this article does not constitute investment advice. Investors should make decisions carefully based on their own risk tolerance and are advised to consult professional financial advisors. Never invest more than you can afford to lose.
FAQ
Is RDNT a good investment?
RDNT shows promise with a 45.3% stock price increase in six months, reaching $76.10. Its strong performance suggests potential for good returns, making it an attractive investment option in the current market.
What is the all time high for RDNT coin?
The all-time high for RDNT coin is $0.5196, reached on June 9, 2023.
What is the price target for RadNet?
The average price target for RadNet is $84.00, with a high of $95.00 based on recent analyst forecasts.
Does RNDR have a future?
Yes, RNDR has a promising future. Growing demand for decentralized GPU rendering and AI advancements support its potential for long-term growth and adoption.
Share
Content
Introduction: RDNT's Market Position and Investment Value
I. RDNT Price History Review and Current Market Status
II. Key Factors Influencing RDNT's Future Price
III. RDNT Price Prediction for 2025-2030
IV. RDNT Professional Investment Strategies and Risk Management
V. Potential Risks and Challenges for RDNT
VI. Conclusion and Action Recommendations
FAQ

