2025 REP Price Prediction: Augur's Token Set to Surge Amid Growing Decentralized Prediction Markets
Introduction: REP's Market Position and Investment Value
Augur (REP), as a decentralized prediction market platform, has achieved significant milestones since its inception in 2015. As of 2025, Augur's market capitalization has reached $10,673,160, with a circulating supply of approximately 8,149,317 tokens, and a price hovering around $1.3097. This asset, often referred to as the "Oracle of the Crowd," is playing an increasingly crucial role in forecasting and decision-making processes across various industries.
This article will comprehensively analyze Augur's price trends from 2025 to 2030, taking into account historical patterns, market supply and demand, ecosystem development, and macroeconomic factors, to provide investors with professional price predictions and practical investment strategies.
I. REP Price History Review and Current Market Status
REP Historical Price Evolution
- 2016: Initial launch, price peaked at $341.85 on February 10
- 2016: Market correction, price dropped to all-time low of $0.21 on January 22
- 2024-2025: Bull market cycle, price surged 98.92% year-over-year
REP Current Market Situation
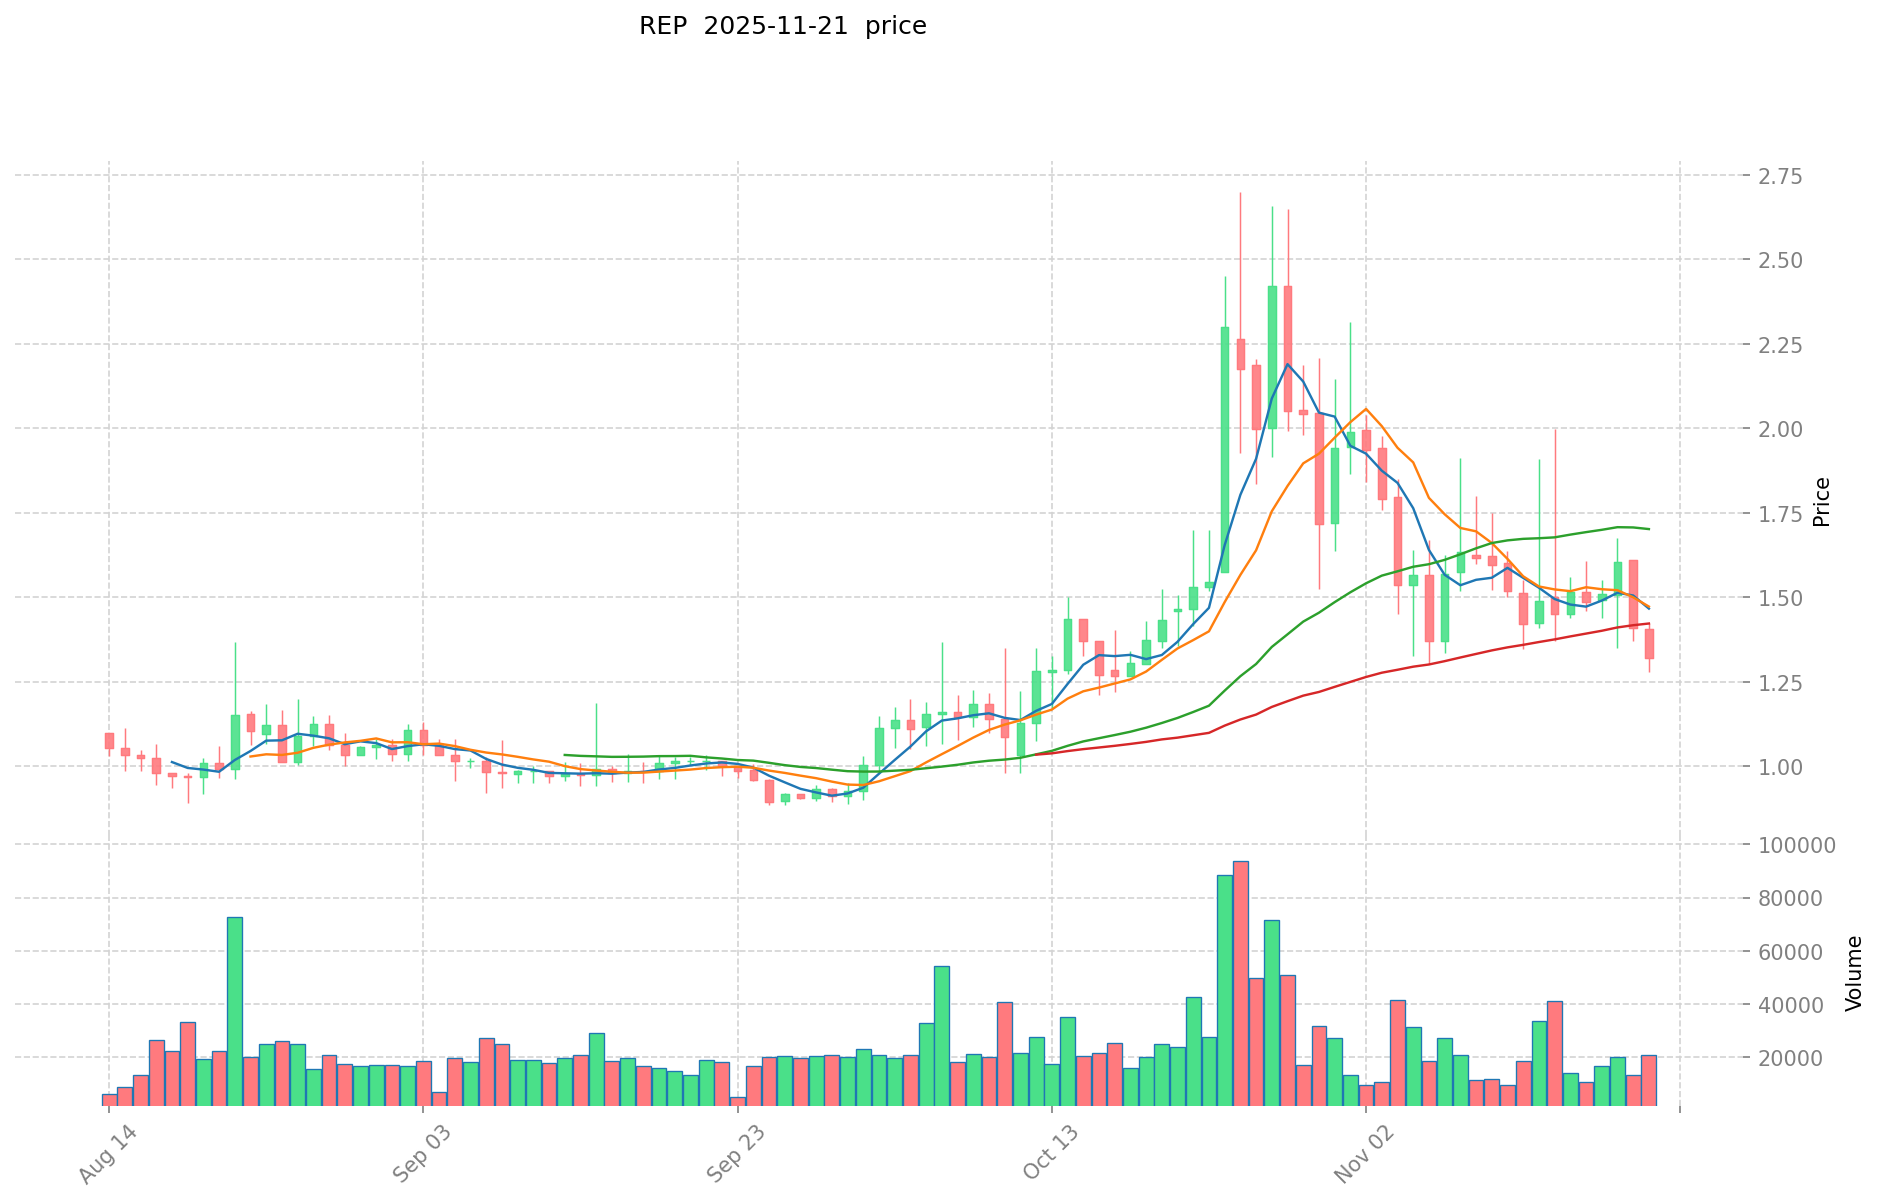
As of November 21, 2025, REP is trading at $1.3097, experiencing a 6.48% decline in the past 24 hours. The token has seen a significant pullback in recent periods, with a 12.21% decrease over the last 7 days and a 10.13% drop in the past 30 days. Despite these short-term setbacks, REP has shown impressive long-term growth, boasting a 98.92% increase over the past year.
REP's market capitalization currently stands at $10,673,160, ranking it 1187th in the overall cryptocurrency market. The token's circulating supply of 8,149,317 REP matches its total and maximum supply, indicating no future inflation through additional token issuance.
Trading volume for REP in the last 24 hours amounts to $28,327, suggesting moderate market activity. The token is trading well below its all-time high of $341.85, presenting a significant gap from its peak valuation.
Click to view the current REP market price
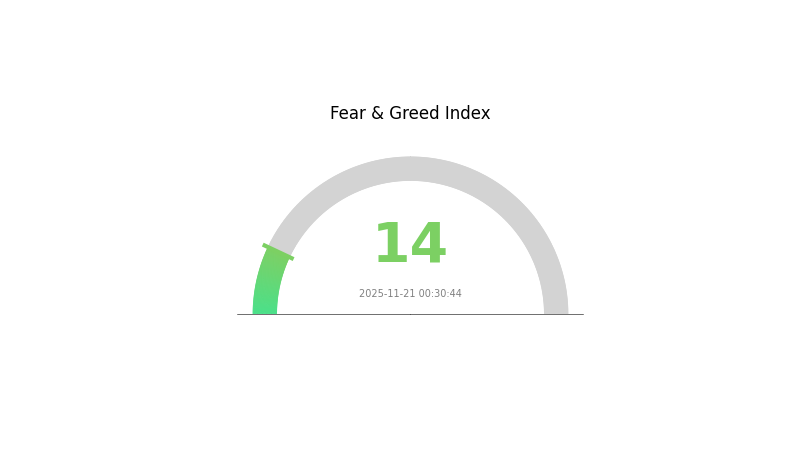
REP Market Sentiment Indicator
2025-11-21 Fear and Greed Index: 14 (Extreme Fear)
Click to view the current Fear & Greed Index
The crypto market sentiment has plunged into extreme fear territory, with the Fear and Greed Index registering a low of 14. This indicates a high level of pessimism and uncertainty among investors. Such extreme fear often presents potential buying opportunities for contrarian investors, as markets may be oversold. However, it's crucial to conduct thorough research and exercise caution before making any investment decisions. Keep an eye on market trends and use Gate.com's tools to stay informed during these volatile times.
REP Holdings Distribution
The address holdings distribution chart for REP reveals a moderate level of concentration among top holders. The top five addresses collectively control 39.93% of the total REP supply, with individual holdings ranging from 6.63% to 9.62%. This concentration, while notable, does not indicate extreme centralization.
The distribution pattern suggests a relatively balanced market structure, with the majority (60.07%) of REP tokens held by addresses outside the top five. This distribution may contribute to market stability, as no single address holds an overwhelmingly large portion that could exert undue influence on price movements. However, coordinated actions by the top holders could still potentially impact market dynamics.
Overall, the current REP holdings distribution reflects a moderate level of decentralization. While there is some concentration among top addresses, the significant portion held by smaller holders contributes to a more diverse on-chain structure, potentially enhancing network resilience and reducing the risk of market manipulation by individual large holders.
Click to view the current REP Holdings Distribution
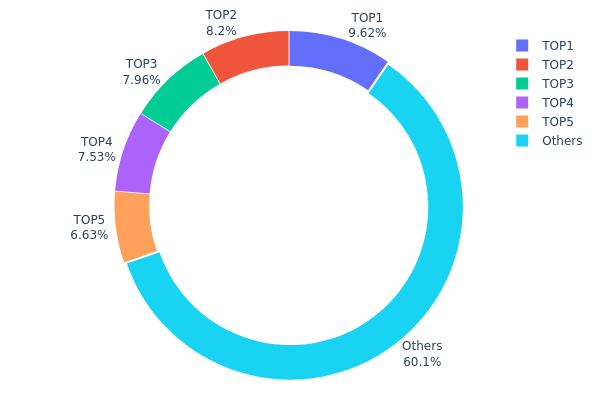
| Top | Address | Holding Qty | Holding (%) |
|---|---|---|---|
| 1 | 0x98ed...eadad8 | 784.13K | 9.62% |
| 2 | 0x981f...2f030e | 668.10K | 8.19% |
| 3 | 0x7daf...706f83 | 648.79K | 7.96% |
| 4 | 0xd2dd...e6869f | 613.86K | 7.53% |
| 5 | 0x5d65...22d918 | 540.59K | 6.63% |
| - | Others | 4893.84K | 60.07% |
II. Core Factors Affecting REP's Future Price
Macroeconomic Environment
- Inflation Hedging Properties: As a decentralized cryptocurrency, REP may potentially serve as a hedge against inflation in certain economic conditions.
Technical Development and Ecosystem Building
- Ecosystem Applications: The Augur platform, which uses REP as its native token, provides a decentralized prediction market for users to create and trade on various events.
III. REP Price Prediction for 2025-2030
2025 Outlook
- Conservative forecast: $1.03 - $1.20
- Neutral forecast: $1.20 - $1.50
- Optimistic forecast: $1.50 - $1.85 (requires positive market sentiment and increased adoption)
2027-2028 Outlook
- Market phase expectation: Potential growth phase with increased volatility
- Price range forecast:
- 2027: $1.50 - $2.12
- 2028: $1.55 - $2.16
- Key catalysts: Technological advancements, wider acceptance of decentralized prediction markets
2029-2030 Long-term Outlook
- Base scenario: $1.80 - $2.30 (assuming steady market growth and adoption)
- Optimistic scenario: $2.30 - $2.80 (assuming accelerated adoption and favorable regulatory environment)
- Transformative scenario: $2.80 - $3.20 (assuming breakthrough use cases and mainstream integration)
- 2030-12-31: REP $2.82 (potential peak price under highly favorable conditions)
| 年份 | 预测最高价 | 预测平均价格 | 预测最低价 | 涨跌幅 |
|---|---|---|---|---|
| 2025 | 1.85556 | 1.316 | 1.03964 | 0 |
| 2026 | 1.8395 | 1.58578 | 1.39549 | 21 |
| 2027 | 2.12368 | 1.71264 | 1.50713 | 30 |
| 2028 | 2.16752 | 1.91816 | 1.55371 | 46 |
| 2029 | 2.14498 | 2.04284 | 1.49127 | 55 |
| 2030 | 2.82678 | 2.09391 | 1.80076 | 59 |
IV. Professional Investment Strategies and Risk Management for REP
REP Investment Methodology
(1) Long-term Holding Strategy
- Suitable for: Long-term investors interested in prediction markets
- Operation suggestions:
- Accumulate REP during market dips
- Hold for at least 2-3 years to ride out market volatility
- Store in a secure hardware wallet or Gate Web3 wallet
(2) Active Trading Strategy
- Technical analysis tools:
- Moving Averages: Use 50-day and 200-day MAs to identify trends
- RSI: Monitor overbought/oversold conditions
- Swing trading tips:
- Set stop-loss orders to limit potential losses
- Take profits at predetermined price targets
REP Risk Management Framework
(1) Asset Allocation Principles
- Conservative investors: 1-3% of crypto portfolio
- Moderate investors: 3-5% of crypto portfolio
- Aggressive investors: 5-10% of crypto portfolio
(2) Risk Hedging Solutions
- Diversification: Spread investments across multiple prediction market projects
- Options: Consider using REP options for downside protection
(3) Secure Storage Solutions
- Hot wallet recommendation: Gate Web3 wallet
- Cold storage option: Hardware wallet for long-term holdings
- Security precautions: Enable 2FA, use strong passwords, and keep private keys offline
V. Potential Risks and Challenges for REP
REP Market Risks
- High volatility: REP price can experience significant swings
- Low liquidity: Limited trading volume may lead to slippage
- Competition: Other prediction market platforms may gain market share
REP Regulatory Risks
- Uncertain regulatory landscape: Prediction markets may face legal challenges
- Potential restrictions: Some jurisdictions may limit or ban prediction market activities
- Compliance costs: Adapting to evolving regulations may incur additional expenses
REP Technical Risks
- Smart contract vulnerabilities: Potential bugs in the Augur protocol
- Scalability issues: Ethereum network congestion may affect performance
- Oracle manipulation: Risk of inaccurate or manipulated event outcomes
VI. Conclusion and Action Recommendations
REP Investment Value Assessment
REP offers long-term potential in the growing prediction market sector but faces short-term volatility and regulatory uncertainties. The project's decentralized nature and first-mover advantage provide a strong value proposition, although competition remains a concern.
REP Investment Recommendations
✅ Beginners: Start with small positions and focus on learning about prediction markets ✅ Experienced investors: Consider a balanced approach with both long-term holding and active trading ✅ Institutional investors: Explore strategic partnerships and potential integration of Augur technology
REP Trading Participation Methods
- Spot trading: Buy and sell REP on Gate.com
- Staking: Participate in REP staking programs if available
- Prediction markets: Engage directly with the Augur platform to gain practical experience
Cryptocurrency investments carry extremely high risks, and this article does not constitute investment advice. Investors should make decisions carefully based on their own risk tolerance and are advised to consult professional financial advisors. Never invest more than you can afford to lose.
FAQ
Which crypto will reach $1000 in 2030?
Bitcoin is the most likely cryptocurrency to reach $1000 by 2030, with Ethereum also having a strong chance. Other potential candidates include Cardano, Solana, and Polkadot, depending on their technological advancements and adoption rates.
What will TRX be worth in 5 years?
Based on market trends and potential growth, TRX could reach $0.50 to $1 in 5 years, driven by increased adoption and blockchain advancements.
Is XRP will reach $100?
While XRP has potential for growth, reaching $100 is unlikely in the near future due to its large supply and market cap limitations. A more realistic target might be $5-10 in the next few years, depending on market conditions and adoption.
Can Solana reach $1000 in 2025?
Yes, Solana could potentially reach $1000 in 2025. With its high-speed blockchain and growing ecosystem, Solana has the potential for significant price appreciation, especially if crypto adoption continues to increase.
Share
Content
Introduction: REP's Market Position and Investment Value
I. REP Price History Review and Current Market Status
II. Core Factors Affecting REP's Future Price
III. REP Price Prediction for 2025-2030
IV. Professional Investment Strategies and Risk Management for REP
V. Potential Risks and Challenges for REP
VI. Conclusion and Action Recommendations
FAQ

