2025 SYN Price Prediction: Bullish Outlook as DeFi Adoption Surges
Introduction: SYN's Market Position and Investment Value
Synapse (SYN), as a cross-chain layer ∞ protocol, has been providing frictionless interoperability between blockchains since its inception. As of 2025, Synapse's market capitalization has reached $14,311,616, with a circulating supply of approximately 219,066,529 tokens, and a price hovering around $0.06533. This asset, known as the "interoperability enabler," is playing an increasingly crucial role in facilitating seamless communication across various blockchain networks.
This article will comprehensively analyze Synapse's price trends from 2025 to 2030, combining historical patterns, market supply and demand, ecosystem development, and macroeconomic factors to provide investors with professional price predictions and practical investment strategies.
I. SYN Price History Review and Current Market Status
SYN Historical Price Evolution
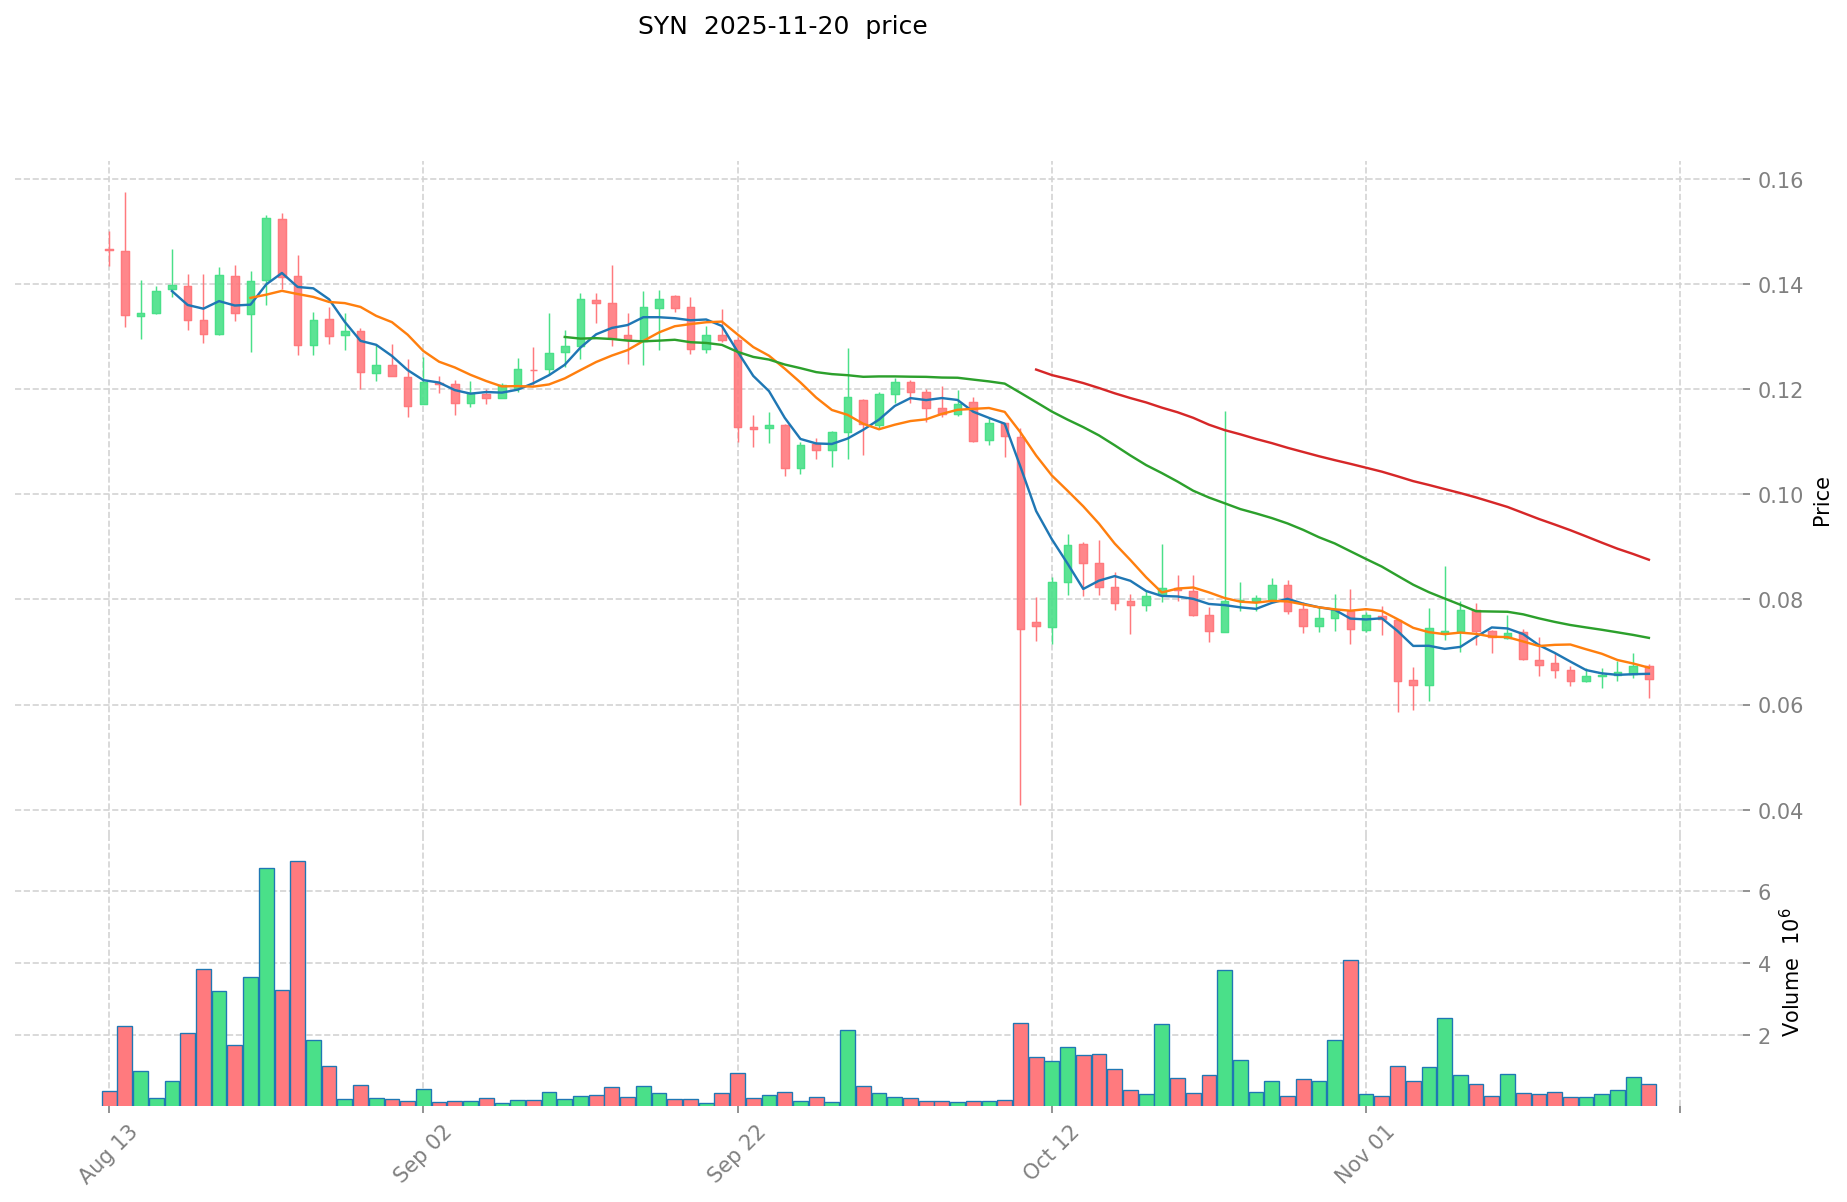
- 2021: SYN reached its all-time high of $4.92 on October 24, marking a significant milestone
- 2025: The market entered a bearish cycle, with SYN price dropping to its all-time low of $0.054098 on October 11
SYN Current Market Situation
As of November 20, 2025, SYN is trading at $0.06533, with a market cap of $14,311,616. The token has experienced a slight 24-hour increase of 0.46%, but shows negative trends across longer time frames. SYN has declined by 4.9% over the past week and 15.62% over the last month. The most significant drop is observed in the yearly performance, with a substantial 87.49% decrease.
The current price represents a 98.67% decline from its all-time high and a 20.76% increase from its all-time low. SYN's trading volume in the last 24 hours stands at $45,857, indicating moderate market activity. With a circulating supply of 219,066,529 SYN tokens out of a total supply of 250,000,000, the token has a circulating ratio of 87.63%.
Click to view the current SYN market price
SYN Market Sentiment Indicator
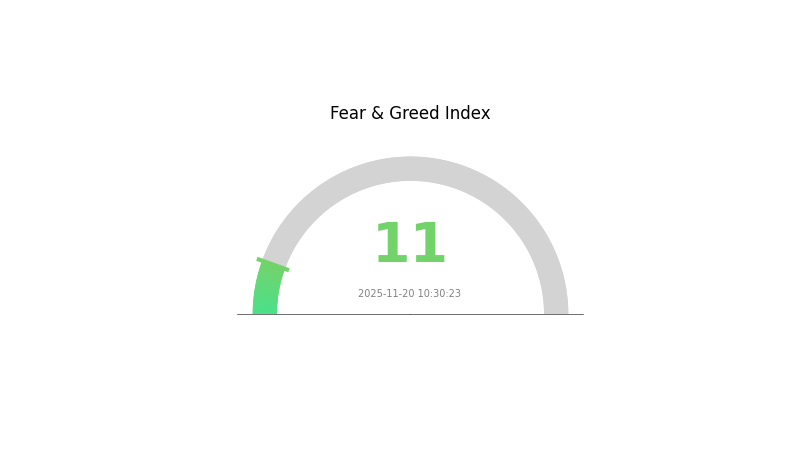
2025-11-20 Fear and Greed Index: 11 (Extreme Fear)
Click to view the current Fear & Greed Index
The crypto market is currently in a state of extreme fear, with the Fear and Greed Index registering a low 11. This suggests investors are highly cautious and pessimistic about market conditions. During such periods, assets may be undervalued due to panic selling. However, as Warren Buffett famously said, "Be fearful when others are greedy, and greedy when others are fearful." Savvy investors might see this as an opportunity to accumulate quality assets at discounted prices, while remaining mindful of the risks involved in volatile markets.
SYN Holdings Distribution
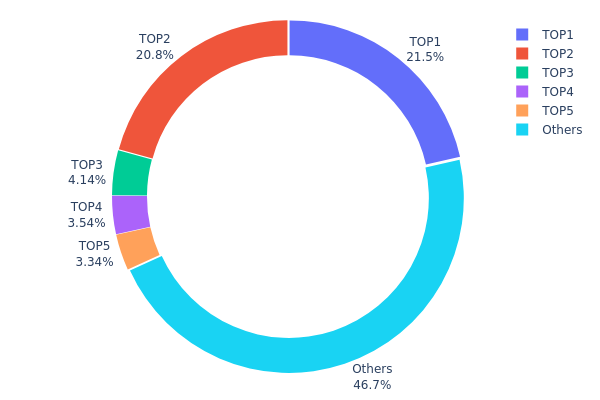
The address holdings distribution data for SYN reveals a significant concentration of tokens among a few top addresses. The top two addresses hold 21.47% and 20.76% of the total supply, respectively, accounting for over 42% of all SYN tokens. The next three largest holders collectively possess about 11% of the supply, while the remaining 46.76% is distributed among other addresses.
This concentration pattern indicates a relatively centralized token distribution for SYN. With nearly half of the total supply controlled by just five addresses, there is a potential for these large holders to exert substantial influence on the market. Such concentration could lead to increased volatility and susceptibility to price manipulation, as significant moves by these major holders could have outsized impacts on the token's value and liquidity.
The current distribution structure suggests a lower degree of decentralization for SYN, which may raise concerns about the token's resilience to market shocks and its overall stability. However, it's worth noting that the "Others" category still represents a significant portion of the supply, indicating some level of distribution among smaller holders. Monitoring changes in this distribution over time will be crucial for assessing the evolving market dynamics and potential risks associated with SYN.
Click to view the current SYN Holdings Distribution
| Top | Address | Holding Qty | Holding (%) |
|---|---|---|---|
| 1 | 0xf977...41acec | 37732.79K | 21.47% |
| 2 | 0x0000...43e60f | 36493.37K | 20.76% |
| 3 | 0xa9d1...1d3e43 | 7275.42K | 4.14% |
| 4 | 0xecc2...c05b97 | 6226.86K | 3.54% |
| 5 | 0xc368...816880 | 5866.86K | 3.33% |
| - | Others | 82121.08K | 46.76% |
II. Key Factors Affecting SYN's Future Price
Technical Development and Ecosystem Building
- Ecosystem Applications: DApps and ecosystem projects within the Synapse Network include cross-chain bridges, decentralized exchanges, and other DeFi protocols that utilize SYN tokens for governance and utility purposes.
III. SYN Price Prediction for 2025-2030
2025 Outlook
- Conservative forecast: $0.04322 - $0.05500
- Neutral forecast: $0.05500 - $0.06549
- Optimistic forecast: $0.06549 - $0.06811 (requires positive market sentiment)
2027-2028 Outlook
- Market phase expectation: Potential growth phase
- Price range prediction:
- 2027: $0.06358 - $0.08712
- 2028: $0.06128 - $0.09192
- Key catalysts: Increasing adoption and technological improvements
2029-2030 Long-term Outlook
- Base scenario: $0.08736 - $0.10265 (assuming steady market growth)
- Optimistic scenario: $0.10265 - $0.11794 (assuming strong market performance)
- Transformative scenario: $0.11794 - $0.15000 (assuming breakthrough innovations and widespread adoption)
- 2030-12-31: SYN $0.10881 (potential peak for the year)
| 年份 | 预测最高价 | 预测平均价格 | 预测最低价 | 涨跌幅 |
|---|---|---|---|---|
| 2025 | 0.06811 | 0.06549 | 0.04322 | 0 |
| 2026 | 0.09018 | 0.0668 | 0.03407 | 2 |
| 2027 | 0.08712 | 0.07849 | 0.06358 | 20 |
| 2028 | 0.09192 | 0.08281 | 0.06128 | 26 |
| 2029 | 0.11794 | 0.08736 | 0.05242 | 33 |
| 2030 | 0.10881 | 0.10265 | 0.08315 | 57 |
IV. Professional Investment Strategies and Risk Management for SYN
SYN Investment Methodology
(1) Long-term Holding Strategy
- Suitable for: Long-term investors and believers in cross-chain technology
- Operational suggestions:
- Accumulate SYN tokens during market dips
- Set price targets for partial profit-taking
- Store tokens in secure non-custodial wallets
(2) Active Trading Strategy
- Technical analysis tools:
- Moving Averages: Monitor short-term and long-term trends
- RSI: Identify overbought and oversold conditions
- Key points for swing trading:
- Watch for breakouts from key support and resistance levels
- Monitor trading volume for confirmation of price movements
SYN Risk Management Framework
(1) Asset Allocation Principles
- Conservative investors: 1-3% of crypto portfolio
- Aggressive investors: 5-8% of crypto portfolio
- Professional investors: 10-15% of crypto portfolio
(2) Risk Hedging Solutions
- Diversification: Spread investments across multiple cross-chain projects
- Stop-loss orders: Implement to limit potential losses
(3) Secure Storage Solutions
- Hot wallet recommendation: Gate Web3 wallet
- Cold storage solution: Hardware wallets for long-term holdings
- Security precautions: Enable two-factor authentication, use strong passwords
V. Potential Risks and Challenges for SYN
SYN Market Risks
- High volatility: SYN price can experience significant fluctuations
- Competition: Emerging cross-chain solutions may impact SYN's market share
- Market sentiment: Overall crypto market conditions can affect SYN's performance
SYN Regulatory Risks
- Uncertain regulations: Evolving cross-chain regulations may impact SYN's operations
- Compliance requirements: Potential need for additional licensing or reporting
- Geographical restrictions: Some jurisdictions may limit or ban cross-chain services
SYN Technical Risks
- Smart contract vulnerabilities: Potential for exploits or bugs in the protocol
- Scalability challenges: Increased network usage may lead to congestion
- Interoperability issues: Compatibility problems with new blockchain networks
VI. Conclusion and Action Recommendations
SYN Investment Value Assessment
SYN shows promise in the cross-chain interoperability sector but faces significant competition and regulatory uncertainties. Long-term potential exists, but short-term volatility remains a concern.
SYN Investment Recommendations
✅ Beginners: Start with small positions, focus on learning about cross-chain technology
✅ Experienced investors: Consider allocating a portion of portfolio to SYN, monitor developments closely
✅ Institutional investors: Evaluate SYN as part of a diversified cross-chain technology investment strategy
SYN Trading Participation Methods
- Spot trading: Buy and sell SYN tokens on Gate.com
- Staking: Participate in SYN staking programs for potential rewards
- Liquidity provision: Contribute to liquidity pools on supported platforms
Cryptocurrency investments carry extremely high risks, and this article does not constitute investment advice. Investors should make decisions carefully based on their own risk tolerance and are advised to consult professional financial advisors. Never invest more than you can afford to lose.
FAQ
What is the SYN prediction for 2025?
Based on market analysis and current trends, SYN is predicted to reach around $3.50 to $4.00 by the end of 2025, showing potential for significant growth in the coming years.
Is syn coin a good investment?
SYN coin shows potential for growth in the Web3 ecosystem. Its innovative features and increasing adoption suggest it could be a promising investment for those interested in decentralized finance.
What is the price prediction for SYN crypto in 2030?
Based on market trends and potential growth, SYN crypto could reach $50-$75 by 2030, driven by increased adoption and ecosystem expansion.
Can Solana reach $1000 in 2025?
Yes, Solana could potentially reach $1000 in 2025. With its high-speed blockchain and growing ecosystem, Solana has the potential for significant price appreciation, especially if crypto market conditions remain favorable.
Share
Content
Introduction: SYN's Market Position and Investment Value
I. SYN Price History Review and Current Market Status
II. Key Factors Affecting SYN's Future Price
III. SYN Price Prediction for 2025-2030
IV. Professional Investment Strategies and Risk Management for SYN
V. Potential Risks and Challenges for SYN
VI. Conclusion and Action Recommendations
FAQ

