2025 TRU Price Prediction: Analyzing Market Trends and Potential Growth Factors
Introduction: TRU's Market Position and Investment Value
Archblock (TRU), as a decentralized lending protocol in the DeFi space, has made significant strides since its inception in 2020. As of 2025, TRU's market capitalization stands at $16,991,441, with a circulating supply of approximately 1,329,533,760 tokens, and a price hovering around $0.01278. This asset, often referred to as a "uncollateralized lending solution," is playing an increasingly crucial role in the decentralized finance sector.
This article will provide a comprehensive analysis of TRU's price trends from 2025 to 2030, considering historical patterns, market supply and demand, ecosystem development, and the broader economic environment to offer professional price predictions and practical investment strategies for investors.
I. TRU Price History Review and Current Market Status
TRU Historical Price Evolution
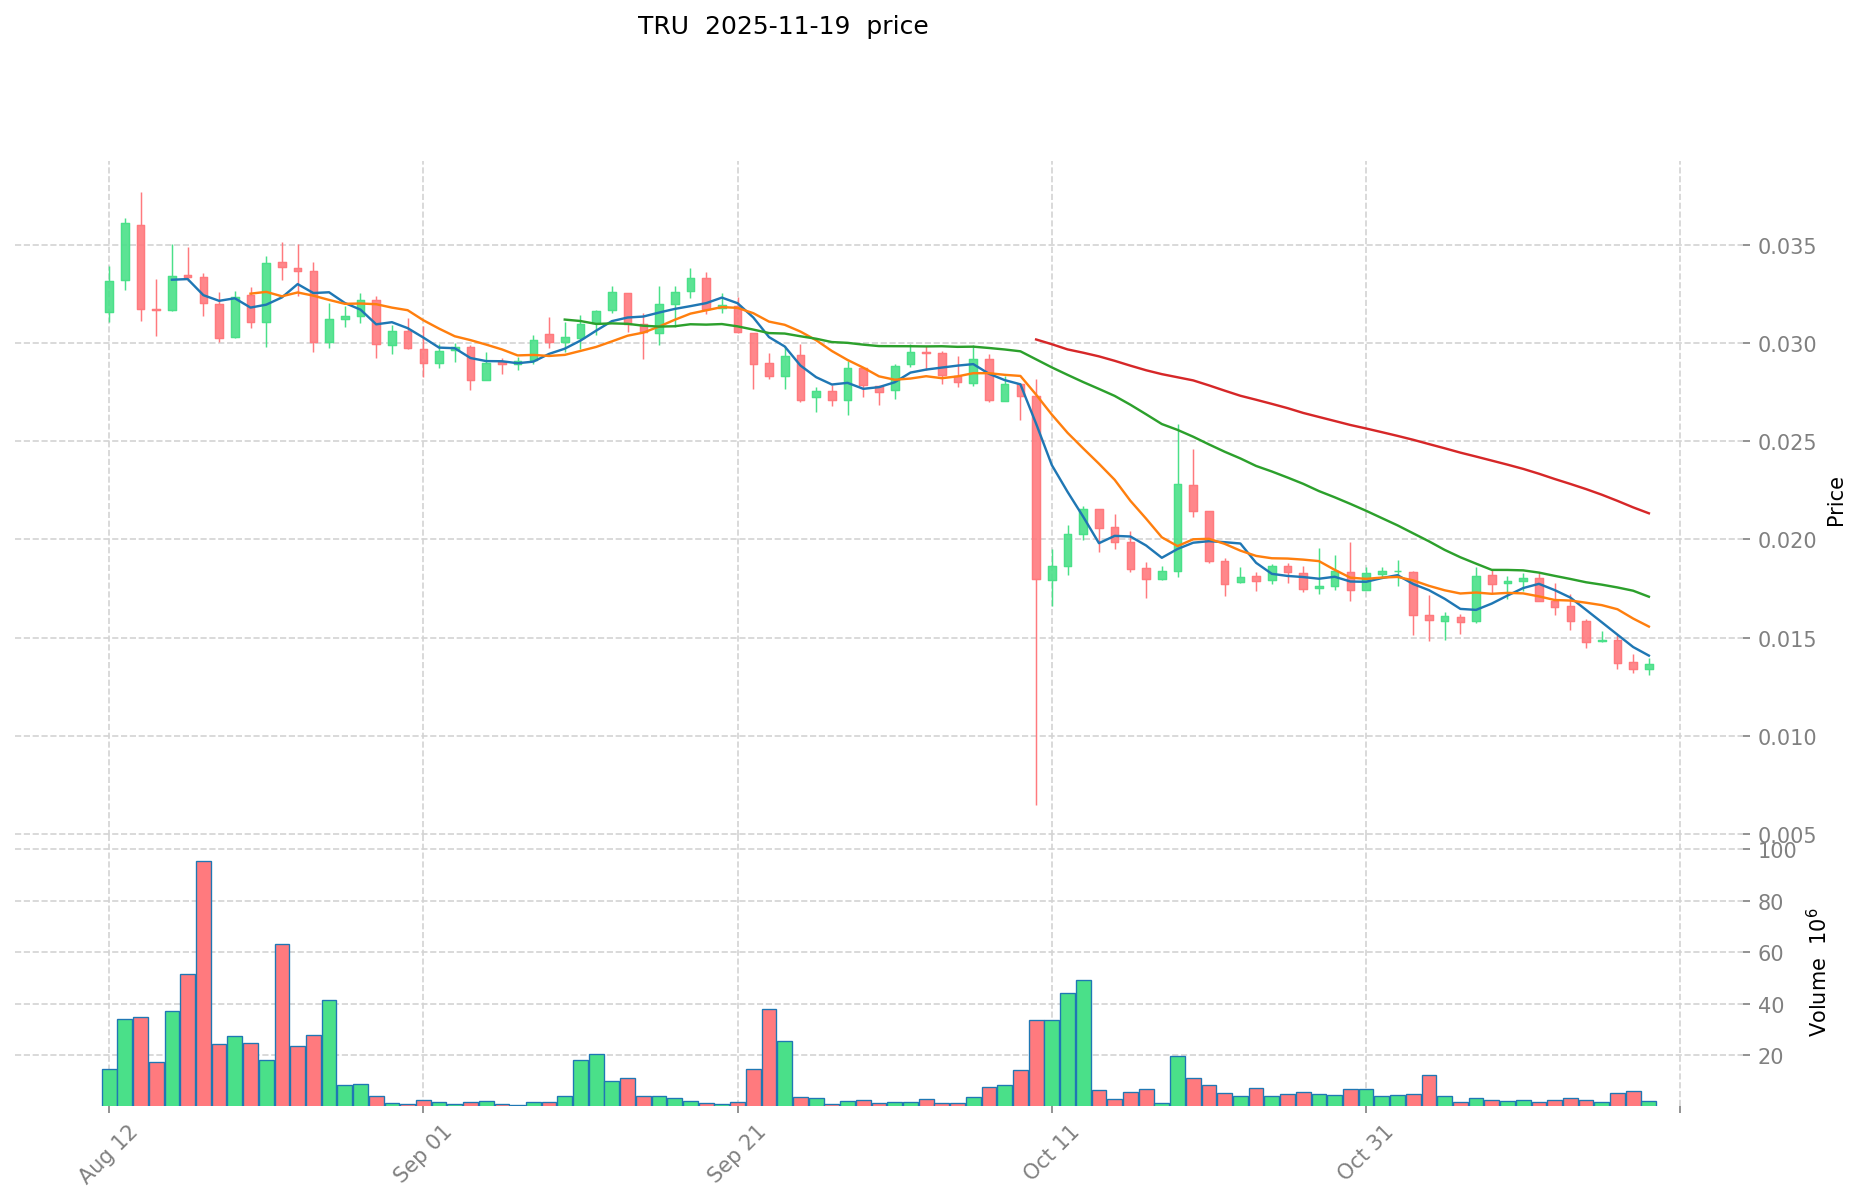
- 2021: TRU reached its all-time high of $1.017 on August 12, marking a significant milestone for the project
- 2022-2024: The cryptocurrency market entered a prolonged bear market, with TRU price gradually declining
- 2025: TRU hit its all-time low of $0.00969713 on October 11, reflecting the overall market downturn
TRU Current Market Situation
As of November 20, 2025, TRU is trading at $0.01278, with a market cap of $16,991,441. The token has experienced a significant decline of 86.03% over the past year, indicating a bearish trend. In the last 24 hours, TRU has seen a 7.72% decrease in price, with the trading volume reaching $39,356.97. The current price is 98.74% below its all-time high and 31.79% above its all-time low. TRU's market dominance stands at 0.00053%, reflecting its relatively small position in the overall cryptocurrency market. The circulating supply of 1,329,533,760 TRU tokens represents 98.91% of the total supply, suggesting a high level of token distribution.
Click to view the current TRU market price
TRU Market Sentiment Indicator
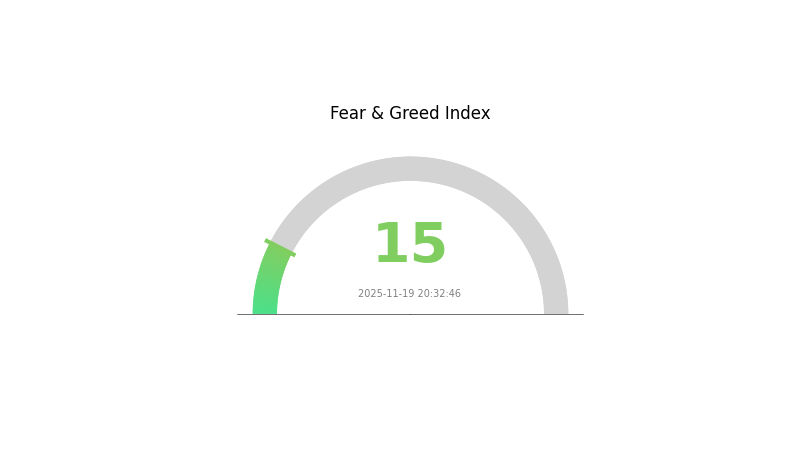
2025-11-19 Fear and Greed Index: 15 (Extreme Fear)
Click to view the current Fear & Greed Index
The crypto market is currently experiencing a period of extreme fear, with the Fear and Greed Index plummeting to 15. This indicates a high level of anxiety among investors, potentially creating opportunities for contrarian traders. While caution is advised, historical data suggests that extreme fear often precedes market rebounds. Savvy investors may consider this a time to research and prepare for potential entry points, keeping in mind that market sentiment can shift rapidly in the volatile crypto space.
TRU Holdings Distribution
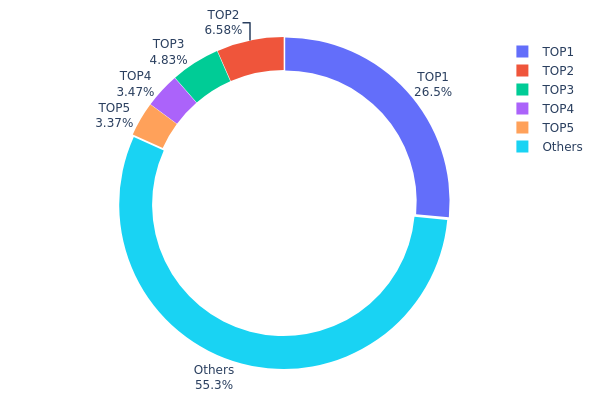
The address holdings distribution data for TRU reveals a significant concentration of tokens among the top holders. The largest address holds 26.48% of the total supply, which is a substantial portion for a single entity. The top five addresses collectively control 44.71% of TRU tokens, indicating a high level of centralization.
This concentration of holdings could have implications for market dynamics. With nearly half of the supply controlled by a few addresses, there's potential for increased price volatility and susceptibility to large-scale market movements initiated by these major holders. The dominance of the top address, in particular, poses a risk of market manipulation if large amounts of tokens were to be moved or sold.
Despite the concentration at the top, it's noteworthy that 55.29% of TRU tokens are distributed among other addresses. This suggests a degree of broader participation in the token ecosystem, which could contribute to some level of market stability. However, the overall distribution pattern indicates a relatively low level of decentralization, which may be a concern for investors seeking a more evenly distributed token economy.
Click to view the current TRU Holdings Distribution
| Top | Address | Holding Qty | Holding (%) |
|---|---|---|---|
| 1 | 0xf977...41acec | 355988.49K | 26.48% |
| 2 | 0x0afc...7651e6 | 88511.51K | 6.58% |
| 3 | 0x5a52...70efcb | 64940.65K | 4.83% |
| 4 | 0x2369...8ee424 | 46613.89K | 3.46% |
| 5 | 0x1ea6...aa6151 | 45284.52K | 3.36% |
| - | Others | 742856.62K | 55.29% |
II. Key Factors Affecting TRU's Future Price
Supply Mechanism
- Total Supply: TRU has a maximum supply cap set by its code.
- Circulating Supply: The amount of TRU in circulation is influenced by the development team and market dynamics.
Institutional and Whale Dynamics
- Enterprise Adoption: TrueFi, the platform behind TRU, aims to provide a transparent and reliable credit market for users, which may attract institutional interest.
Macroeconomic Environment
- Inflation Hedging Properties: As a cryptocurrency, TRU may be viewed as a potential hedge against inflation in certain economic conditions.
Technological Development and Ecosystem Building
- DeFi Integration: TRU is part of the TrueFi platform, which is built on the Ethereum blockchain and focuses on decentralized finance (DeFi) applications.
- Smart Contract Functionality: The use of smart contracts in TrueFi ensures transaction security and efficiency, potentially increasing user trust and adoption.
- Ecosystem Applications: TrueFi allows users to earn yields by providing liquidity and enables borrowers to access loans on the platform.
III. TRU Price Prediction for 2025-2030
2025 Outlook
- Conservative prediction: $0.0092 - $0.01278
- Neutral prediction: $0.01278 - $0.01534
- Optimistic prediction: $0.01534 - $0.01789 (requires favorable market conditions and increased adoption)
2026-2028 Outlook
- Market phase expectation: Gradual growth and consolidation
- Price range forecast:
- 2026: $0.00874 - $0.01595
- 2027: $0.00939 - $0.02018
- 2028: $0.01021 - $0.02436
- Key catalysts: Improved market sentiment, technological advancements, and wider institutional acceptance
2029-2030 Long-term Outlook
- Base scenario: $0.02050 - $0.02198 (assuming steady market growth and continued adoption)
- Optimistic scenario: $0.02283 - $0.02506 (assuming strong market performance and significant technological breakthroughs)
- Transformative scenario: $0.02506 - $0.03000 (assuming widespread adoption and integration into mainstream financial systems)
- 2030-12-31: TRU $0.02506 (potential peak based on current projections)
| 年份 | 预测最高价 | 预测平均价格 | 预测最低价 | 涨跌幅 |
|---|---|---|---|---|
| 2025 | 0.01789 | 0.01278 | 0.0092 | 0 |
| 2026 | 0.01595 | 0.01534 | 0.00874 | 20 |
| 2027 | 0.02018 | 0.01564 | 0.00939 | 22 |
| 2028 | 0.02436 | 0.01791 | 0.01021 | 40 |
| 2029 | 0.02283 | 0.02113 | 0.0205 | 65 |
| 2030 | 0.02506 | 0.02198 | 0.01758 | 71 |
IV. TRU Professional Investment Strategies and Risk Management
TRU Investment Methodology
(1) Long-term Holding Strategy
- Suitable for: Risk-tolerant investors with a long-term perspective
- Operational suggestions:
- Accumulate TRU during market dips
- Set price targets for partial profit-taking
- Store tokens in secure non-custodial wallets
(2) Active Trading Strategy
- Technical analysis tools:
- Moving Averages: Use to identify trends and support/resistance levels
- RSI (Relative Strength Index): Gauge overbought/oversold conditions
- Key points for swing trading:
- Monitor TrueFi platform adoption metrics
- Stay informed about DeFi sector developments
TRU Risk Management Framework
(1) Asset Allocation Principles
- Conservative investors: 1-3% of crypto portfolio
- Aggressive investors: 3-5% of crypto portfolio
- Professional investors: 5-10% of crypto portfolio
(2) Risk Hedging Solutions
- Diversification: Spread investments across multiple DeFi projects
- Stop-loss orders: Implement to limit potential losses
(3) Secure Storage Solutions
- Hot wallet recommendation: Gate Web3 Wallet
- Cold storage solution: Hardware wallet for long-term holdings
- Security precautions: Enable two-factor authentication, use strong passwords
V. Potential Risks and Challenges for TRU
TRU Market Risks
- High volatility: DeFi tokens often experience significant price swings
- Competition: Increasing number of DeFi lending protocols
- Market sentiment: Susceptible to overall crypto market trends
TRU Regulatory Risks
- Unclear regulations: DeFi protocols may face regulatory scrutiny
- Compliance challenges: Potential difficulties in adhering to future regulations
- Cross-border issues: Varying regulatory approaches in different jurisdictions
TRU Technical Risks
- Smart contract vulnerabilities: Potential for exploits or bugs
- Scalability concerns: Ethereum network congestion may impact user experience
- Oracle dependence: Reliance on external data sources for accurate pricing
VI. Conclusion and Action Recommendations
TRU Investment Value Assessment
TRU offers exposure to the growing DeFi lending sector but faces significant competition and regulatory uncertainties. Long-term potential exists if TrueFi can maintain its market position and adapt to regulatory challenges.
TRU Investment Recommendations
✅ Beginners: Consider small, experimental positions to learn about DeFi ✅ Experienced investors: Allocate a portion of DeFi portfolio, monitor closely ✅ Institutional investors: Conduct thorough due diligence, consider as part of broader DeFi strategy
TRU Participation Methods
- Spot trading: Purchase TRU tokens on Gate.com
- Yield farming: Participate in TrueFi liquidity pools if available
- Governance: Stake TRU to participate in protocol governance decisions
Cryptocurrency investments carry extremely high risks, and this article does not constitute investment advice. Investors should make decisions carefully based on their own risk tolerance and are advised to consult professional financial advisors. Never invest more than you can afford to lose.
FAQ
How much will TRX be worth in 2025?
Based on machine-learning models, TRX is projected to reach a minimum of $0.34 and an average of $0.35 by 2025, showing significant growth potential from current levels.
Can TRON hit $5?
While possible, TRON reaching $5 is highly speculative. Market conditions and adoption would need to change dramatically for such a significant price increase.
Does TRON Trx have a future?
Yes, TRON TRX has a promising future. Experts predict positive price trends from 2025 to 2030, based on technical analysis and long-term forecasts. Market analysts remain optimistic about TRX's growth potential.
What is the trust crypto prediction for 2025?
Based on market trends, Trust Wallet Token (TWT) is predicted to reach a maximum of $3.66 and a minimum of $2.51 by the end of 2025.
Share
Content
Introduction: TRU's Market Position and Investment Value
I. TRU Price History Review and Current Market Status
II. Key Factors Affecting TRU's Future Price
III. TRU Price Prediction for 2025-2030
IV. TRU Professional Investment Strategies and Risk Management
V. Potential Risks and Challenges for TRU
VI. Conclusion and Action Recommendations
FAQ

