2025 ZND Price Prediction: Navigating the Cryptocurrency Landscape in an Evolving Market
Introduction: ZND's Market Position and Investment Value
ZND (ZND), as a fully regulated financial ecosystem, has integrated multiple platforms to meet diverse user needs since its launch in December 2023. As of 2025, ZND's market capitalization has reached $15,727,201, with a circulating supply of approximately 172,485,212 tokens, and a price hovering around $0.09118. This asset, known as the "Central European crypto innovator," is playing an increasingly crucial role in simplifying access to the crypto market for both beginners and experienced users.
This article will comprehensively analyze ZND's price trends from 2025 to 2030, combining historical patterns, market supply and demand, ecosystem development, and macroeconomic environment to provide investors with professional price predictions and practical investment strategies.
I. ZND Price History Review and Current Market Status
ZND Historical Price Evolution
- 2023: ZND platform launched in December, price started at $0.31
- 2025 March: ZND reached its all-time high of $0.55
- 2025 May: Market downturn, price dropped to its all-time low of $0.05561
ZND Current Market Situation
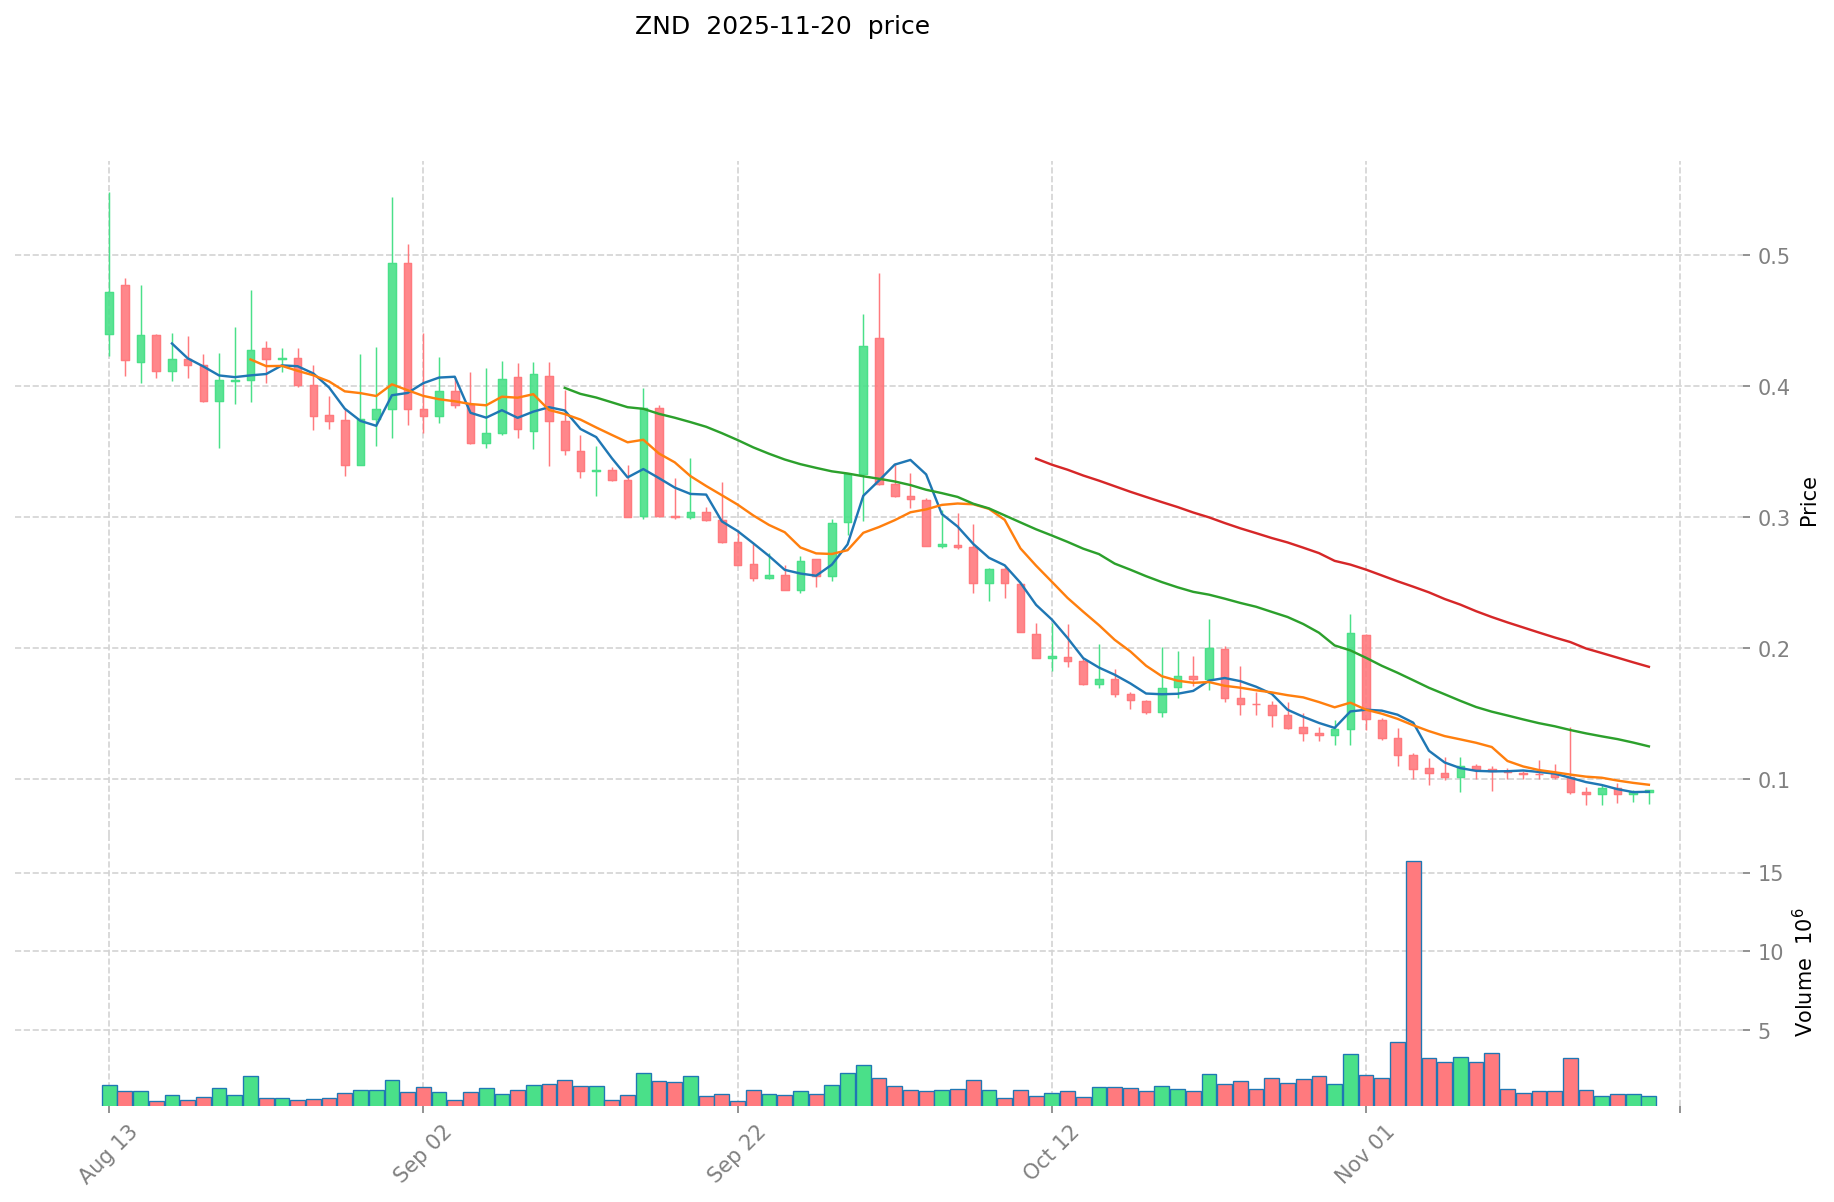
As of November 20, 2025, ZND is trading at $0.09118. The token has seen a 2.54% increase in the last 24 hours, with a trading volume of $63,622.74. ZND's market cap currently stands at $15,727,201.63, ranking it at 1018th in the cryptocurrency market. The token's circulating supply is 172,485,212 ZND, which represents 12.63% of its total supply of 694,349,223 ZND.
Despite the recent 24-hour gain, ZND has experienced significant declines over longer periods. The token is down 12.41% in the past week and has seen a substantial 48.18% decrease over the last 30 days. The yearly performance shows a dramatic 69.93% drop from its value a year ago.
The current price of $0.09118 is considerably lower than ZND's all-time high of $0.55, achieved on March 3, 2025. However, it has recovered from its all-time low of $0.05561, recorded on May 20, 2025.
Click to view the current ZND market price
ZND Market Sentiment Indicator
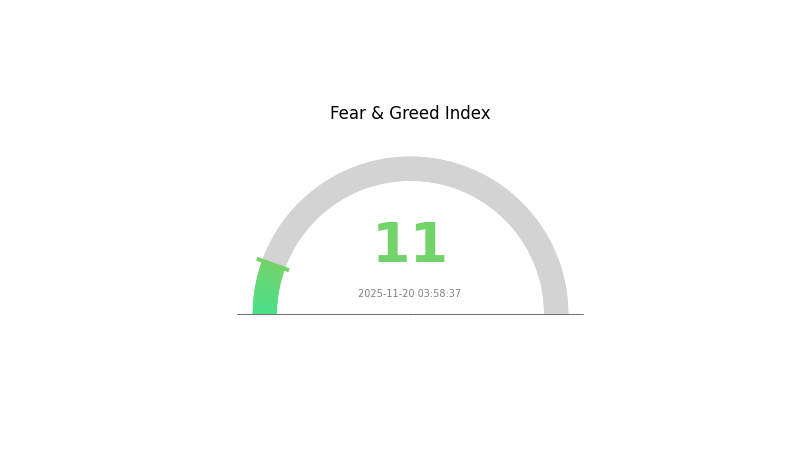
2025-11-20 Fear and Greed Index: 11 (Extreme Fear)
Click to view the current Fear & Greed Index
The crypto market is gripped by extreme fear, with the Fear and Greed Index plummeting to 11. This extreme bearish sentiment often signals a potential buying opportunity for contrarian investors. However, caution is advised as market volatility may persist. Traders on Gate.com should consider dollar-cost averaging strategies and thorough research before making investment decisions. Remember, market sentiment can shift rapidly, and it's crucial to maintain a balanced portfolio aligned with your risk tolerance.
ZND Holdings Distribution
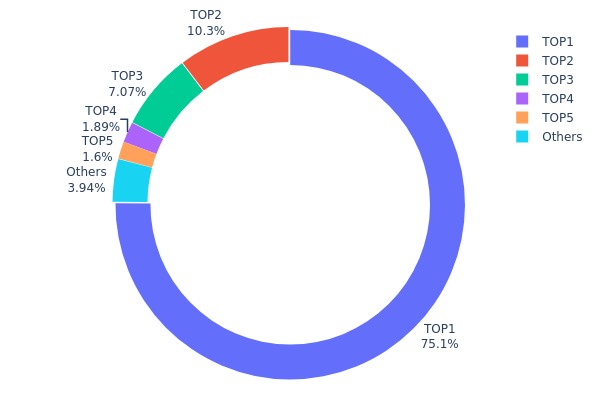
The address holdings distribution data for ZND reveals a highly concentrated ownership structure. The top address holds an overwhelming 75.14% of the total supply, equivalent to 521,447.84K ZND tokens. This extreme concentration is further emphasized by the fact that the top 5 addresses collectively control 96.03% of the total supply, leaving only 3.97% distributed among other holders.
Such a centralized distribution raises concerns about market manipulation and price volatility. With a single address controlling over three-quarters of the supply, there is a significant risk of market instability should this holder decide to liquidate or transfer large portions of their holdings. This concentration also suggests a low level of decentralization within the ZND ecosystem, potentially compromising its resilience and democratic governance.
From a market structure perspective, this distribution indicates a potentially illiquid and easily influenced market. The concentration of tokens in few hands could lead to artificial scarcity and price movements that may not reflect genuine market demand or project fundamentals. Investors and traders should be aware of these structural characteristics when considering ZND in their portfolios or trading strategies.
Click to view the current ZND holdings distribution
| Top | Address | Holding Qty | Holding (%) |
|---|---|---|---|
| 1 | 0xcb3d...dba792 | 521447.84K | 75.14% |
| 2 | 0x7812...d657fc | 71801.00K | 10.34% |
| 3 | 0x6edf...1c5048 | 49057.23K | 7.06% |
| 4 | 0x6fbb...a5b069 | 13145.82K | 1.89% |
| 5 | 0x5342...e02b38 | 11130.00K | 1.60% |
| - | Others | 27351.17K | 3.97% |
II. Key Factors Affecting ZND's Future Price
Supply Mechanism
- Pandemic Impact: The pandemic has constrained supply recovery, making it difficult for supply-demand gaps to narrow quickly.
- Historical Pattern: Previous economic recovery cycles typically saw commodity price increases due to temporary supply-demand imbalances.
- Current Impact: The slow recovery of global supply capacity continues to support upward price pressure.
Institutional and Whale Activity
- Corporate Adoption: Major economies have announced carbon neutrality goals, which could impact industrial demand for commodities.
Macroeconomic Environment
- Monetary Policy Impact: Extremely loose monetary policies, especially by the US Federal Reserve, have provided necessary conditions for global inflation.
- Inflation Hedging Properties: Fiscal stimulus plans have accelerated the transmission of inflation from capital markets to the real economy.
- Geopolitical Factors: Trade policies and international relations, particularly US actions, can significantly influence commodity prices.
Technological Development and Ecosystem Building
- Carbon Neutrality Initiatives: Long-term policies aimed at carbon reduction are reshaping energy consumption structures and industrial processes.
- Industrial Electrification: The transition towards clean energy and industrial electrification is expected to boost demand for certain metals like copper and nickel.
III. ZND Price Prediction for 2025-2030
2025 Outlook
- Conservative prediction: $0.05571 - $0.07000
- Neutral prediction: $0.07000 - $0.09132
- Optimistic prediction: $0.09132 - $0.11141 (requires positive market sentiment and project developments)
2027-2028 Outlook
- Market stage expectation: Potential growth phase with increased volatility
- Price range forecast:
- 2027: $0.07754 - $0.14682
- 2028: $0.07131 - $0.16013
- Key catalysts: Project upgrades, broader crypto market recovery, increased adoption
2029-2030 Long-term Outlook
- Base scenario: $0.14262 - $0.15474 (assuming steady market growth and project development)
- Optimistic scenario: $0.16686 - $0.18724 (assuming strong market conditions and significant project milestones)
- Transformative scenario: $0.20000 - $0.25000 (assuming breakthrough innovations and mass adoption)
- 2030-12-31: ZND $0.18724 (potential peak based on optimistic projections)
| 年份 | 预测最高价 | 预测平均价格 | 预测最低价 | 涨跌幅 |
|---|---|---|---|---|
| 2025 | 0.11141 | 0.09132 | 0.05571 | 0 |
| 2026 | 0.10542 | 0.10137 | 0.08616 | 11 |
| 2027 | 0.14682 | 0.10339 | 0.07754 | 13 |
| 2028 | 0.16013 | 0.1251 | 0.07131 | 37 |
| 2029 | 0.16686 | 0.14262 | 0.09556 | 56 |
| 2030 | 0.18724 | 0.15474 | 0.08047 | 69 |
IV. ZND Professional Investment Strategies and Risk Management
ZND Investment Methodology
(1) Long-term Holding Strategy
- Suitable for: Long-term investors and believers in the ZND ecosystem
- Operation suggestions:
- Accumulate ZND tokens during market dips
- Participate in the ZND ecosystem to maximize token utility
- Store tokens securely in a hardware wallet or Gate Web3 wallet
(2) Active Trading Strategy
- Technical analysis tools:
- Moving Averages: Use to identify trends and potential reversal points
- Relative Strength Index (RSI): Gauge overbought/oversold conditions
- Swing trading key points:
- Monitor ZND's correlation with broader crypto market trends
- Set clear entry and exit points based on technical indicators
ZND Risk Management Framework
(1) Asset Allocation Principles
- Conservative investors: 1-3% of crypto portfolio
- Aggressive investors: 5-10% of crypto portfolio
- Professional investors: Up to 15% of crypto portfolio
(2) Risk Hedging Solutions
- Diversification: Balance ZND with other crypto assets and traditional investments
- Stop-loss orders: Implement to limit potential losses
(3) Secure Storage Solutions
- Hot wallet recommendation: Gate Web3 wallet for active trading
- Cold storage solution: Hardware wallet for long-term holdings
- Security precautions: Enable two-factor authentication, use strong passwords
V. Potential Risks and Challenges for ZND
ZND Market Risks
- Volatility: High price fluctuations common in the crypto market
- Liquidity: Limited trading volume may lead to slippage
- Market sentiment: Susceptible to broader crypto market trends
ZND Regulatory Risks
- Regulatory uncertainty: Changing cryptocurrency regulations may impact ZND
- Compliance challenges: Potential difficulties in adhering to evolving financial regulations
- Cross-border restrictions: Varying legal status in different jurisdictions
ZND Technical Risks
- Smart contract vulnerabilities: Potential for exploits in the token's underlying code
- Network congestion: Ethereum network issues may affect ZND transactions
- Technological obsolescence: Risk of being outpaced by newer blockchain technologies
VI. Conclusion and Action Recommendations
ZND Investment Value Assessment
ZND offers long-term potential as part of a regulated financial ecosystem but faces short-term risks due to market volatility and regulatory uncertainties.
ZND Investment Recommendations
✅ Beginners: Start with small, regular investments to understand the ZND ecosystem ✅ Experienced investors: Consider a balanced approach, mixing long-term holding with active trading ✅ Institutional investors: Conduct thorough due diligence and consider ZND as part of a diversified crypto portfolio
ZND Trading Participation Methods
- Spot trading: Buy and sell ZND tokens on Gate.com
- Staking: Participate in ZND staking programs if available
- Ecosystem participation: Engage with ZND platform features to maximize token utility
Cryptocurrency investments carry extremely high risks, and this article does not constitute investment advice. Investors should make decisions carefully based on their own risk tolerance and are advised to consult professional financial advisors. Never invest more than you can afford to lose.
FAQ
What is the ZND coin prediction?
The ZND coin prediction for 2026 is estimated to be €0.09, based on a 5% price change and current market trends.
Would hamster kombat coin reach $1?
It's possible for Hamster Kombat coin to reach $1, but it depends on market trends and community support. While the potential exists, the future price remains speculative and uncertain.
Which coin will reach $1 in 2030?
Based on current projections, no coin is expected to reach $1 in 2030. PEPE, for example, is forecast to be worth $0.0002733 by that year.
Does Marlin Pond have a future?
Yes, Marlin Pond has a promising future. Its price is projected to reach $0.020919 by 2028, with a 15.76% growth rate.
Share
Content
Introduction: ZND's Market Position and Investment Value
I. ZND Price History Review and Current Market Status
II. Key Factors Affecting ZND's Future Price
III. ZND Price Prediction for 2025-2030
IV. ZND Professional Investment Strategies and Risk Management
V. Potential Risks and Challenges for ZND
VI. Conclusion and Action Recommendations
FAQ

