ACS vs KAVA: A Comparative Analysis of Two Leading Blockchain Platforms for DeFi Applications
Introduction: Investment Comparison of ACS vs KAVA
In the cryptocurrency market, the comparison between Access Protocol (ACS) and Kava (KAVA) has been an unavoidable topic for investors. The two not only show significant differences in market cap ranking, application scenarios, and price performance but also represent different positioning in the crypto asset landscape.
Access Protocol (ACS): Since its launch, it has gained market recognition for providing a new model monetization layer for digital content creators.
KAVA (KAVA): Since its inception, it has been hailed as a cross-chain decentralized finance platform, offering mortgage and stable currency services for mainstream digital assets.
This article will comprehensively analyze the investment value comparison between ACS and KAVA, focusing on historical price trends, supply mechanisms, institutional adoption, technological ecosystems, and future predictions, attempting to answer the question that investors are most concerned about:
"Which is the better buy right now?"
I. Price History Comparison and Current Market Status
Access Protocol (ACS) and Kava (KAVA) Historical Price Trends
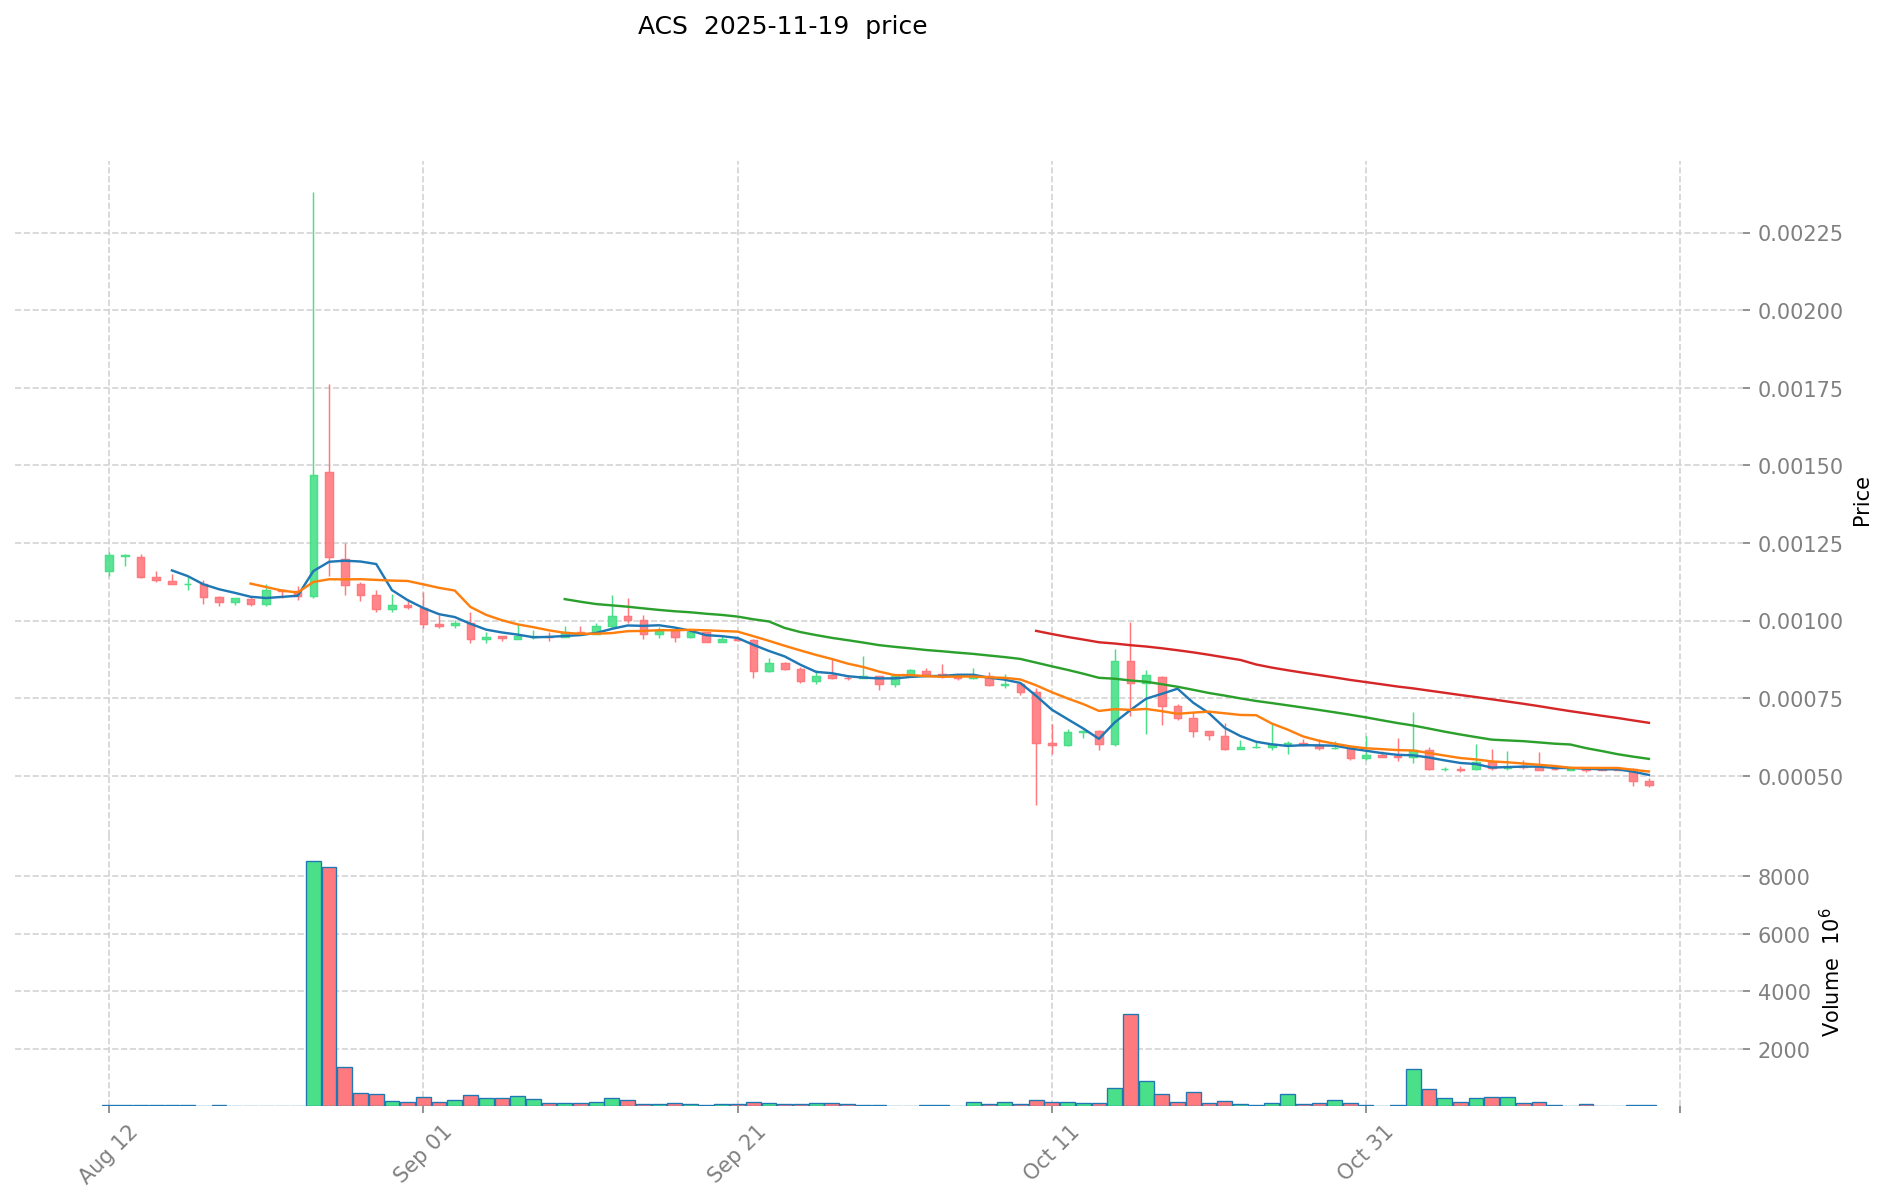
- 2023: ACS reached its all-time high of $0.02687893 on February 16, 2023.
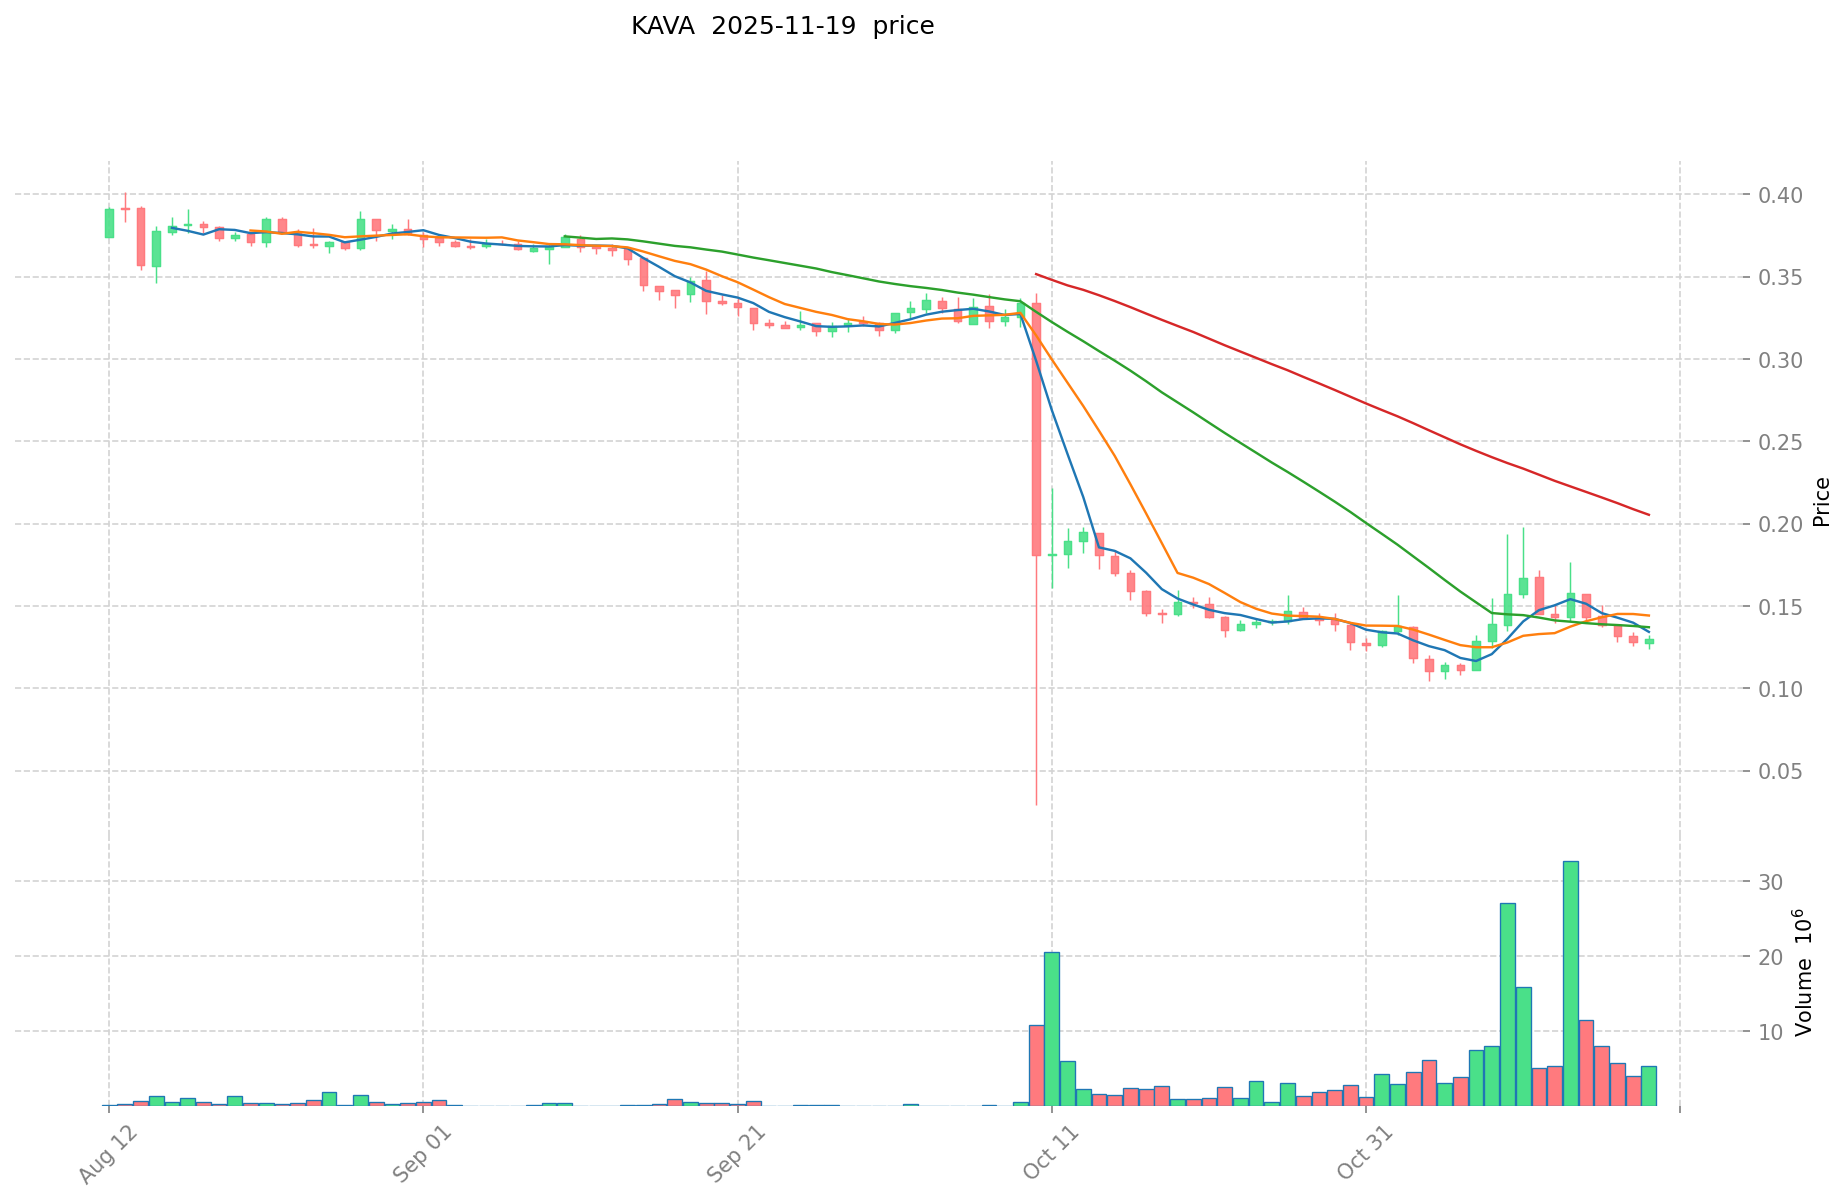
- 2021: KAVA hit its all-time high of $9.12 on August 30, 2021.
- Comparative Analysis: In the current market cycle, ACS has dropped from its all-time high to a current price of $0.0004756, while KAVA has fallen from its peak to $0.12785.
Current Market Situation (2025-11-19)
- ACS current price: $0.0004756
- KAVA current price: $0.12785
- 24-hour trading volume: ACS $31,802.90 vs KAVA $831,400.66
- Market Sentiment Index (Fear & Greed Index): 15 (Extreme Fear)
Click to view real-time prices:
- Check ACS current price Market Price
- Check KAVA current price Market Price
II. Core Factors Affecting ACS vs KAVA Investment Value
Supply Mechanism Comparison (Tokenomics)
- Access Protocol (ACS): Utilizes blockchain technology for content creators and consumers, allowing creators to set ACS token prices for access to their content
- KAVA: Supply affected by its ecosystem development and governance model
- 📌 Historical Pattern: Market volatility and technological advancements drive price cycles for both tokens
Institutional Adoption and Market Applications
- Institutional Holdings: Limited information about institutional preference between these tokens
- Enterprise Adoption: ACS focuses on content creation and access, while KAVA emphasizes DeFi ecosystem functionality
- Regulatory Attitudes: Different countries may have varying regulatory approaches to these tokens, though specific details are not provided
Technical Development and Ecosystem Building
- ACS Technical Upgrades: Focuses on blockchain infrastructure for content creators and consumers
- KAVA Technical Development: Emphasizes ecosystem development and governance mechanisms
- Ecosystem Comparison: Both tokens serve different purposes - ACS targets content creation and access markets while KAVA focuses on its broader DeFi ecosystem
Macroeconomic Factors and Market Cycles
- Performance in Inflationary Environments: Both tokens are subject to market fluctuations
- Macroeconomic Monetary Policy: Interest rates and broader economic policies likely affect both tokens
- Geopolitical Factors: Cross-border transaction demands and international situations impact value and adoption of both tokens
III. 2025-2030 Price Prediction: ACS vs KAVA
Short-term Prediction (2025)
- ACS: Conservative $0.000375171 - $0.0004749 | Optimistic $0.0004749 - $0.000541386
- KAVA: Conservative $0.1168768 - $0.12704 | Optimistic $0.12704 - $0.1727744
Mid-term Prediction (2027)
- ACS may enter a growth phase, with estimated prices ranging from $0.0005175436455 to $0.0006669376875
- KAVA may enter a bullish market, with estimated prices ranging from $0.15389473152 to $0.18396611584
- Key drivers: Institutional capital inflow, ETF, ecosystem development
Long-term Prediction (2030)
- ACS: Base scenario $0.000735929056583 - $0.001045019260348 | Optimistic scenario $0.001045019260348+
- KAVA: Base scenario $0.217271765988864 - $0.321562213663518 | Optimistic scenario $0.321562213663518+
Disclaimer: This analysis is based on historical data and market projections. Cryptocurrency markets are highly volatile and unpredictable. These predictions should not be considered as financial advice. Always conduct your own research before making investment decisions.
ACS:
| 年份 | 预测最高价 | 预测平均价格 | 预测最低价 | 涨跌幅 |
|---|---|---|---|---|
| 2025 | 0.000541386 | 0.0004749 | 0.000375171 | 0 |
| 2026 | 0.0005589573 | 0.000508143 | 0.00028964151 | 6 |
| 2027 | 0.0006669376875 | 0.00053355015 | 0.0005175436455 | 12 |
| 2028 | 0.000702285384937 | 0.00060024391875 | 0.000546221966062 | 26 |
| 2029 | 0.000820593461323 | 0.000651264651843 | 0.00054054966103 | 36 |
| 2030 | 0.001045019260348 | 0.000735929056583 | 0.000544587501871 | 54 |
KAVA:
| 年份 | 预测最高价 | 预测平均价格 | 预测最低价 | 涨跌幅 |
|---|---|---|---|---|
| 2025 | 0.1727744 | 0.12704 | 0.1168768 | 0 |
| 2026 | 0.203873792 | 0.1499072 | 0.128920192 | 17 |
| 2027 | 0.18396611584 | 0.176890496 | 0.15389473152 | 38 |
| 2028 | 0.2219268162816 | 0.18042830592 | 0.1569726261504 | 41 |
| 2029 | 0.233365970876928 | 0.2011775611008 | 0.106624107383424 | 57 |
| 2030 | 0.321562213663518 | 0.217271765988864 | 0.132535777253207 | 69 |
IV. Investment Strategy Comparison: ACS vs KAVA
Long-term vs Short-term Investment Strategy
- ACS: Suitable for investors focused on content creation and monetization potential
- KAVA: Suitable for investors interested in DeFi ecosystem growth and cross-chain functionality
Risk Management and Asset Allocation
- Conservative investors: ACS: 30% vs KAVA: 70%
- Aggressive investors: ACS: 60% vs KAVA: 40%
- Hedging tools: Stablecoin allocation, options, cross-currency portfolio
V. Potential Risk Comparison
Market Risk
- ACS: Volatility in content creation market, competition from other platforms
- KAVA: DeFi market fluctuations, competition from other cross-chain platforms
Technical Risk
- ACS: Scalability, network stability
- KAVA: Centralization of computing power, security vulnerabilities
Regulatory Risk
- Global regulatory policies may have different impacts on both tokens
VI. Conclusion: Which Is the Better Buy?
📌 Investment Value Summary:
- ACS advantages: Unique positioning in content creation market, potential for growth in digital content industry
- KAVA advantages: Established presence in DeFi ecosystem, cross-chain functionality
✅ Investment Advice:
- New investors: Consider a balanced approach, leaning towards KAVA for its more established ecosystem
- Experienced investors: Explore opportunities in both, with a strategic allocation based on risk tolerance
- Institutional investors: Conduct thorough due diligence on both projects, considering KAVA for its DeFi applications and ACS for potential content monetization disruption
⚠️ Risk Warning: The cryptocurrency market is highly volatile, and this article does not constitute investment advice. None
VII. FAQ
Q1: What are the main differences between ACS and KAVA? A: ACS focuses on providing a monetization layer for digital content creators, while KAVA is a cross-chain decentralized finance platform offering mortgage and stable currency services for mainstream digital assets.
Q2: Which token has performed better historically? A: KAVA reached a higher all-time high of $9.12 in August 2021, compared to ACS's all-time high of $0.02687893 in February 2023. However, both have seen significant drops from their peaks.
Q3: How do the current prices and trading volumes compare? A: As of 2025-11-19, ACS is priced at $0.0004756 with a 24-hour trading volume of $31,802.90, while KAVA is priced at $0.12785 with a 24-hour trading volume of $831,400.66.
Q4: What are the key factors affecting the investment value of these tokens? A: Key factors include supply mechanisms, institutional adoption, technical development, ecosystem building, and macroeconomic factors such as inflation and geopolitical events.
Q5: What are the long-term price predictions for ACS and KAVA? A: By 2030, ACS is predicted to reach between $0.000735929056583 and $0.001045019260348 in the base scenario, while KAVA is expected to reach between $0.217271765988864 and $0.321562213663518.
Q6: How should investors allocate their assets between ACS and KAVA? A: Conservative investors might consider 30% ACS and 70% KAVA, while aggressive investors might opt for 60% ACS and 40% KAVA. However, this should be adjusted based on individual risk tolerance and market conditions.
Q7: What are the main risks associated with investing in ACS and KAVA? A: Risks include market volatility, technical challenges such as scalability and security vulnerabilities, and potential regulatory changes affecting the cryptocurrency market.
Q8: Which token is considered the better buy? A: The better buy depends on individual investment goals and risk tolerance. KAVA may be more suitable for those interested in established DeFi ecosystems, while ACS could appeal to investors focused on the potential of content creation markets. New investors might lean towards KAVA, while experienced investors might consider a balanced approach.
Share
Content
Introduction: Investment Comparison of ACS vs KAVA
I. Price History Comparison and Current Market Status
II. Core Factors Affecting ACS vs KAVA Investment Value
III. 2025-2030 Price Prediction: ACS vs KAVA
IV. Investment Strategy Comparison: ACS vs KAVA
V. Potential Risk Comparison
VI. Conclusion: Which Is the Better Buy?
VII. FAQ

