AKE vs MANA: Comparing Two Innovative Approaches to Decentralized Finance
Introduction: AKE vs MANA Investment Comparison
In the cryptocurrency market, the comparison between Akedo (AKE) vs Decentraland (MANA) has always been a topic that investors cannot ignore. The two not only have significant differences in market cap ranking, application scenarios, and price performance, but also represent different positioning in crypto assets.
Akedo (AKE): Since its launch, it has gained market recognition for its vibe coding Game & Content Creation Engine and Launchpad that leverages AI agents.
Decentraland (MANA): Since its inception in 2017, it has been hailed as a virtual world platform based on blockchain, and is one of the cryptocurrencies with the highest global trading volume and market capitalization in its category.
This article will comprehensively analyze the investment value comparison between AKE and MANA, focusing on historical price trends, supply mechanisms, institutional adoption, technological ecosystems, and future predictions, and attempt to answer the question that investors care most about:
"Which is the better buy right now?"
I. Price History Comparison and Current Market Status
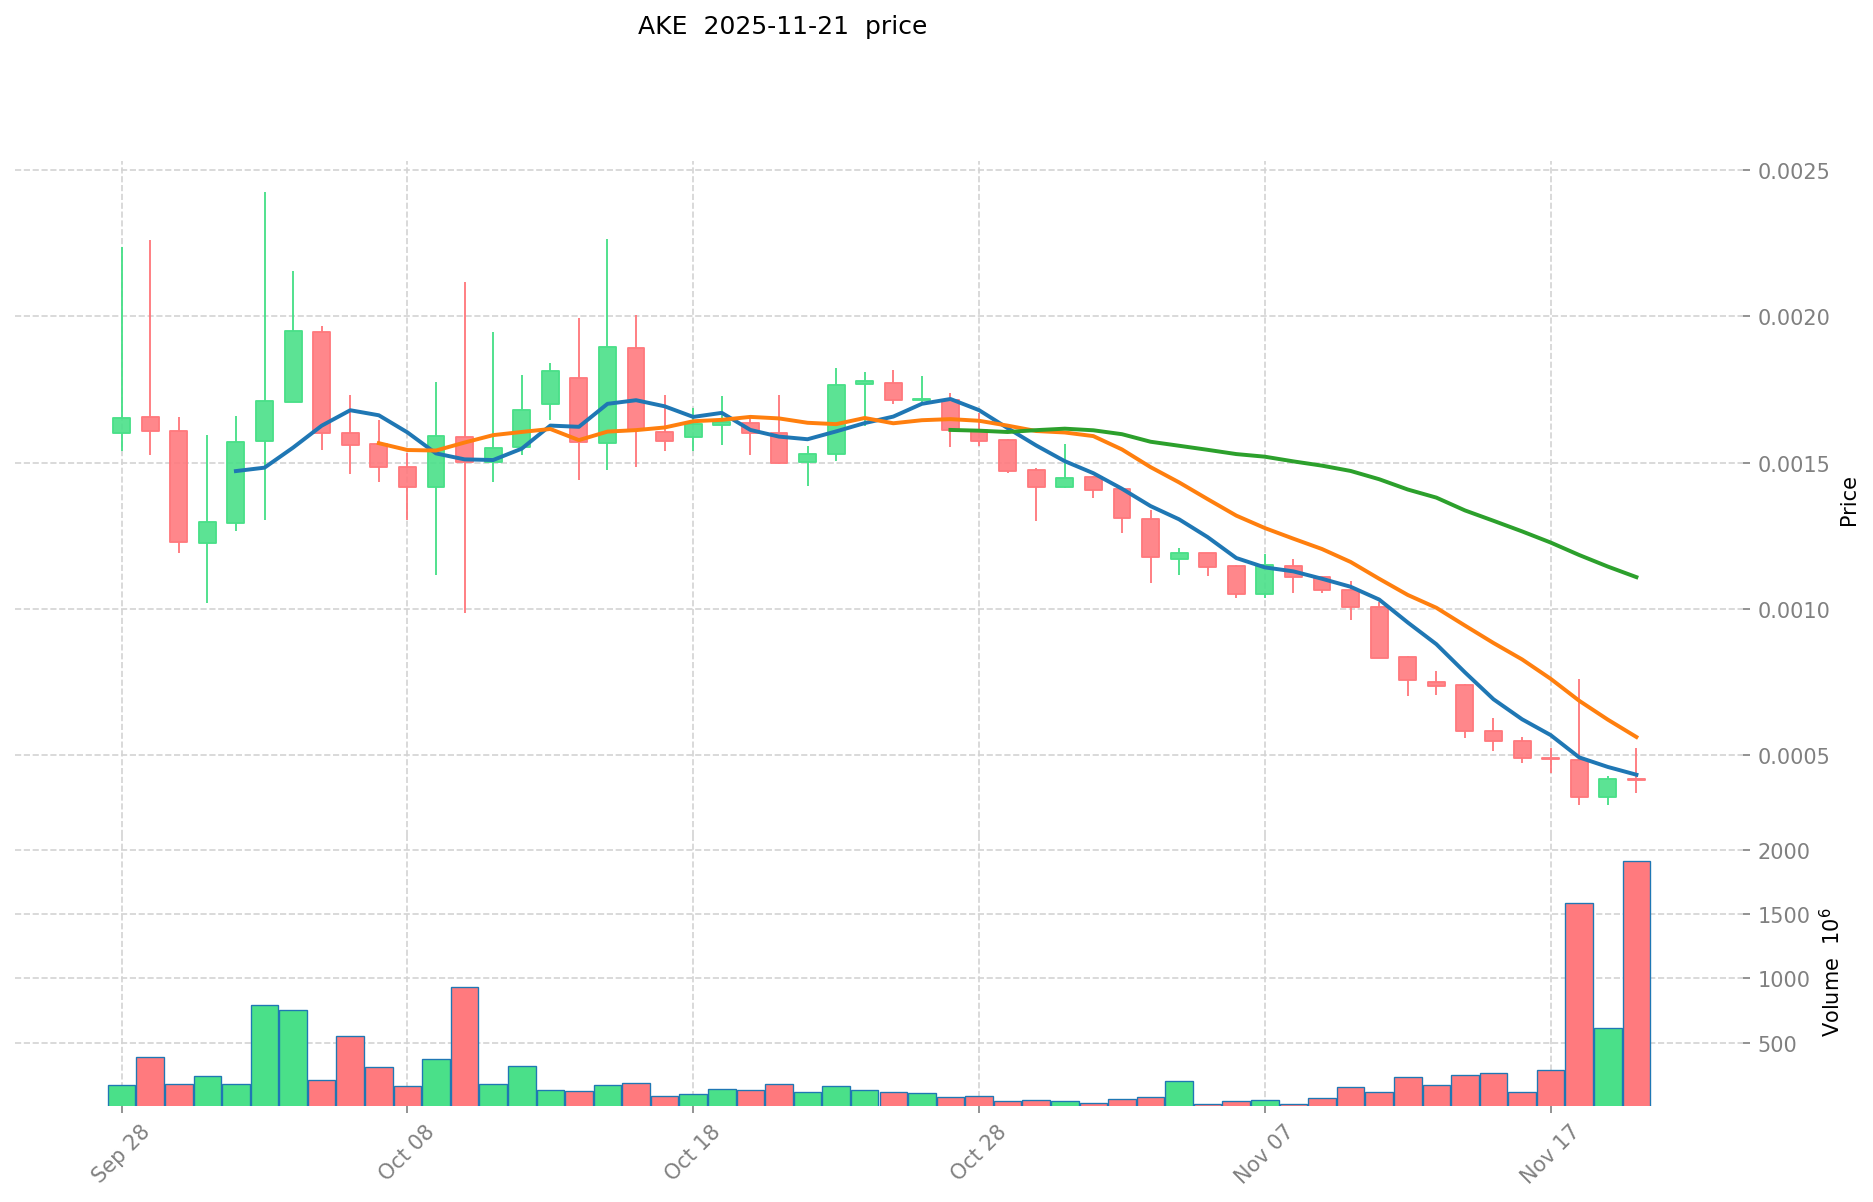
AKE and MANA Historical Price Trends
- 2025: AKE reached its all-time high of $0.0024262 on October 3, 2025, before declining to its all-time low of $0.0003286 on November 18, 2025.
- 2021: MANA hit its all-time high of $5.85 on November 25, 2021, showcasing significant growth in the metaverse and NFT boom.
- Comparative Analysis: In recent market cycles, AKE has experienced a sharp decline from its peak to its current price, while MANA has shown long-term stability despite significant volatility since its all-time high in 2021.
Current Market Situation (2025-11-21)
- AKE current price: $0.0003917
- MANA current price: $0.1686
- 24-hour trading volume: AKE $454,727.92 vs MANA $346,897.08
- Market Sentiment Index (Fear & Greed Index): 14 (Extreme Fear)
Click to view real-time prices:
- View AKE current price Market Price
- View MANA current price Market Price

II. Core Factors Affecting the Investment Value of AKE vs MANA
Supply Mechanisms Comparison (Tokenomics)
- AKE: Fixed supply model with 750 million tokens, with 70% of tokens unlocked at launch, which may impact early price volatility
- MANA: Total supply of 2.2 billion tokens, with a deflationary mechanism through LAND purchase burns
- 📌 Historical pattern: Deflationary mechanisms like MANA's tend to create upward price pressure over time, while AKE's large initial circulation may cause early price volatility followed by stabilization.
Institutional Adoption and Market Applications
- Institutional holdings: MANA has greater institutional recognition as one of the earliest metaverse tokens, while AKE is still establishing institutional presence
- Enterprise adoption: MANA has broader enterprise partnerships within the metaverse space, including integration with virtual reality platforms
- National policies: Most countries have not established specific regulations for either token, though metaverse-related assets like MANA face increasing regulatory scrutiny
Technology Development and Ecosystem Building
- AKE technology: Powers the Akitavax platform with focus on NFT integration and multi-chain functionality
- MANA technology: Powers Decentraland with continuous development on VR capabilities, creator tools, and social features
- Ecosystem comparison: MANA has a more developed ecosystem with established LAND marketplace, virtual events platform, and integration with multiple DeFi protocols; AKE's ecosystem is still in early development stages
Macroeconomic and Market Cycles
- Performance in inflationary environments: Neither has proven strong correlation with inflation metrics
- Macroeconomic monetary policy: Both tokens show sensitivity to broader crypto market trends which correlate with Federal Reserve policies
- Geopolitical factors: MANA potentially benefits from increasing global interest in virtual spaces and digital property ownership
III. 2025-2030 Price Prediction: AKE vs MANA
Short-term Prediction (2025)
- AKE: Conservative $0.00031816 - $0.000388 | Optimistic $0.000388 - $0.0004074
- MANA: Conservative $0.10985 - $0.169 | Optimistic $0.169 - $0.24505
Mid-term Prediction (2027)
- AKE may enter a growth phase, with an estimated price range of $0.000243452055 - $0.000528245025
- MANA may enter a steady growth phase, with an estimated price range of $0.1168242075 - $0.25960935
- Key drivers: Institutional capital inflow, ETF developments, ecosystem growth
Long-term Prediction (2030)
- AKE: Base scenario $0.000462431043365 - $0.000670189917921 | Optimistic scenario $0.000670189917921 - $0.000737208909713
- MANA: Base scenario $0.25220901240535 - $0.283380912815 | Optimistic scenario $0.283380912815 - $0.4024008961973
Disclaimer: These predictions are based on historical data and market analysis. Cryptocurrency markets are highly volatile and subject to change. This information should not be considered as financial advice.
AKE:
| 年份 | 预测最高价 | 预测平均价格 | 预测最低价 | 涨跌幅 |
|---|---|---|---|---|
| 2025 | 0.0004074 | 0.000388 | 0.00031816 | -1 |
| 2026 | 0.000520987 | 0.0003977 | 0.000302252 | 1 |
| 2027 | 0.000528245025 | 0.0004593435 | 0.000243452055 | 16 |
| 2028 | 0.000656746369125 | 0.0004937942625 | 0.000320966270625 | 25 |
| 2029 | 0.00076510952003 | 0.000575270315812 | 0.000442958143175 | 46 |
| 2030 | 0.000737208909713 | 0.000670189917921 | 0.000462431043365 | 70 |
MANA:
| 年份 | 预测最高价 | 预测平均价格 | 预测最低价 | 涨跌幅 |
|---|---|---|---|---|
| 2025 | 0.24505 | 0.169 | 0.10985 | 0 |
| 2026 | 0.22565725 | 0.207025 | 0.149058 | 23 |
| 2027 | 0.25960935 | 0.216341125 | 0.1168242075 | 29 |
| 2028 | 0.306988056375 | 0.2379752375 | 0.16658266625 | 41 |
| 2029 | 0.2942801786925 | 0.2724816469375 | 0.17438825404 | 62 |
| 2030 | 0.4024008961973 | 0.283380912815 | 0.25220901240535 | 69 |
IV. Investment Strategy Comparison: AKE vs MANA
Long-term vs Short-term Investment Strategies
- AKE: Suitable for investors focused on NFT integration and multi-chain functionality potential
- MANA: Suitable for investors seeking exposure to established metaverse platforms and virtual real estate
Risk Management and Asset Allocation
- Conservative investors: AKE: 20% vs MANA: 80%
- Aggressive investors: AKE: 40% vs MANA: 60%
- Hedging tools: Stablecoin allocation, options, cross-currency portfolios
V. Potential Risk Comparison
Market Risks
- AKE: High volatility due to recent launch and smaller market cap
- MANA: Vulnerability to broader metaverse and NFT market trends
Technical Risks
- AKE: Scalability, network stability in early stages
- MANA: Platform adoption rates, competition from other virtual worlds
Regulatory Risks
- Global regulatory policies may impact both tokens, with potentially greater scrutiny on established metaverse platforms like MANA
VI. Conclusion: Which Is the Better Buy?
📌 Investment Value Summary:
- AKE advantages: New platform with potential for growth, focus on AI and NFT integration
- MANA advantages: Established ecosystem, broader institutional adoption, deflationary mechanism
✅ Investment Advice:
- New investors: Consider a small allocation to MANA as part of a diversified crypto portfolio
- Experienced investors: Balanced approach with both AKE and MANA, adjusting based on risk tolerance
- Institutional investors: Focus on MANA for its established market presence and liquidity
⚠️ Risk Warning: Cryptocurrency markets are highly volatile. This article does not constitute investment advice. None
VII. FAQ
Q1: What are the key differences between AKE and MANA? A: AKE is a newer token focused on NFT integration and multi-chain functionality, while MANA is an established metaverse token powering the Decentraland platform. MANA has a larger market cap, more institutional adoption, and a deflationary mechanism, whereas AKE is still in early development stages with potential for growth.
Q2: Which token has performed better historically? A: MANA has shown more long-term stability and reached higher all-time highs, peaking at $5.85 in November 2021. AKE, being newer, reached its all-time high of $0.0024262 in October 2025 but has since experienced a sharp decline.
Q3: What are the supply mechanisms for each token? A: AKE has a fixed supply of 750 million tokens, with 70% unlocked at launch. MANA has a total supply of 2.2 billion tokens and implements a deflationary mechanism through LAND purchase burns.
Q4: How do institutional adoption and market applications compare? A: MANA has greater institutional recognition and broader enterprise partnerships within the metaverse space. AKE is still establishing its institutional presence and ecosystem.
Q5: What are the projected price ranges for 2030? A: For AKE, the base scenario projects $0.000462431043365 - $0.000670189917921, with an optimistic scenario of $0.000670189917921 - $0.000737208909713. For MANA, the base scenario projects $0.25220901240535 - $0.283380912815, with an optimistic scenario of $0.283380912815 - $0.4024008961973.
Q6: How should investors allocate their portfolios between AKE and MANA? A: Conservative investors might consider 20% AKE and 80% MANA, while aggressive investors could opt for 40% AKE and 60% MANA. This allocation should be adjusted based on individual risk tolerance and market conditions.
Q7: What are the main risks associated with investing in AKE and MANA? A: AKE faces high volatility due to its recent launch and smaller market cap, as well as potential technical risks in early stages. MANA is vulnerable to broader metaverse and NFT market trends and faces competition from other virtual world platforms. Both tokens may be impacted by evolving regulatory policies.
Share
Content
Introduction: AKE vs MANA Investment Comparison
I. Price History Comparison and Current Market Status
II. Core Factors Affecting the Investment Value of AKE vs MANA
III. 2025-2030 Price Prediction: AKE vs MANA
IV. Investment Strategy Comparison: AKE vs MANA
V. Potential Risk Comparison
VI. Conclusion: Which Is the Better Buy?
VII. FAQ

