AQT vs TRX: Comparing Two Emerging Cryptocurrencies in the Digital Asset Landscape
Introduction: AQT vs TRX Investment Comparison
In the cryptocurrency market, the comparison between Alpha Quark (AQT) and TRON (TRX) has been an unavoidable topic for investors. The two not only show significant differences in market cap ranking, application scenarios, and price performance but also represent different positioning in the crypto asset space.
Alpha Quark (AQT): Since its launch in 2021, it has gained market recognition for its focus on digital intangible assets and intellectual property rights trading.
TRON (TRX): Introduced in 2017, TRON has been hailed as a decentralized content entertainment system and has become one of the largest public blockchains globally.
This article will comprehensively analyze the investment value comparison between AQT and TRX, focusing on historical price trends, supply mechanisms, institutional adoption, technological ecosystems, and future predictions, attempting to answer the question investors care about most:
"Which is the better buy right now?" I. Price History Comparison and Current Market Status
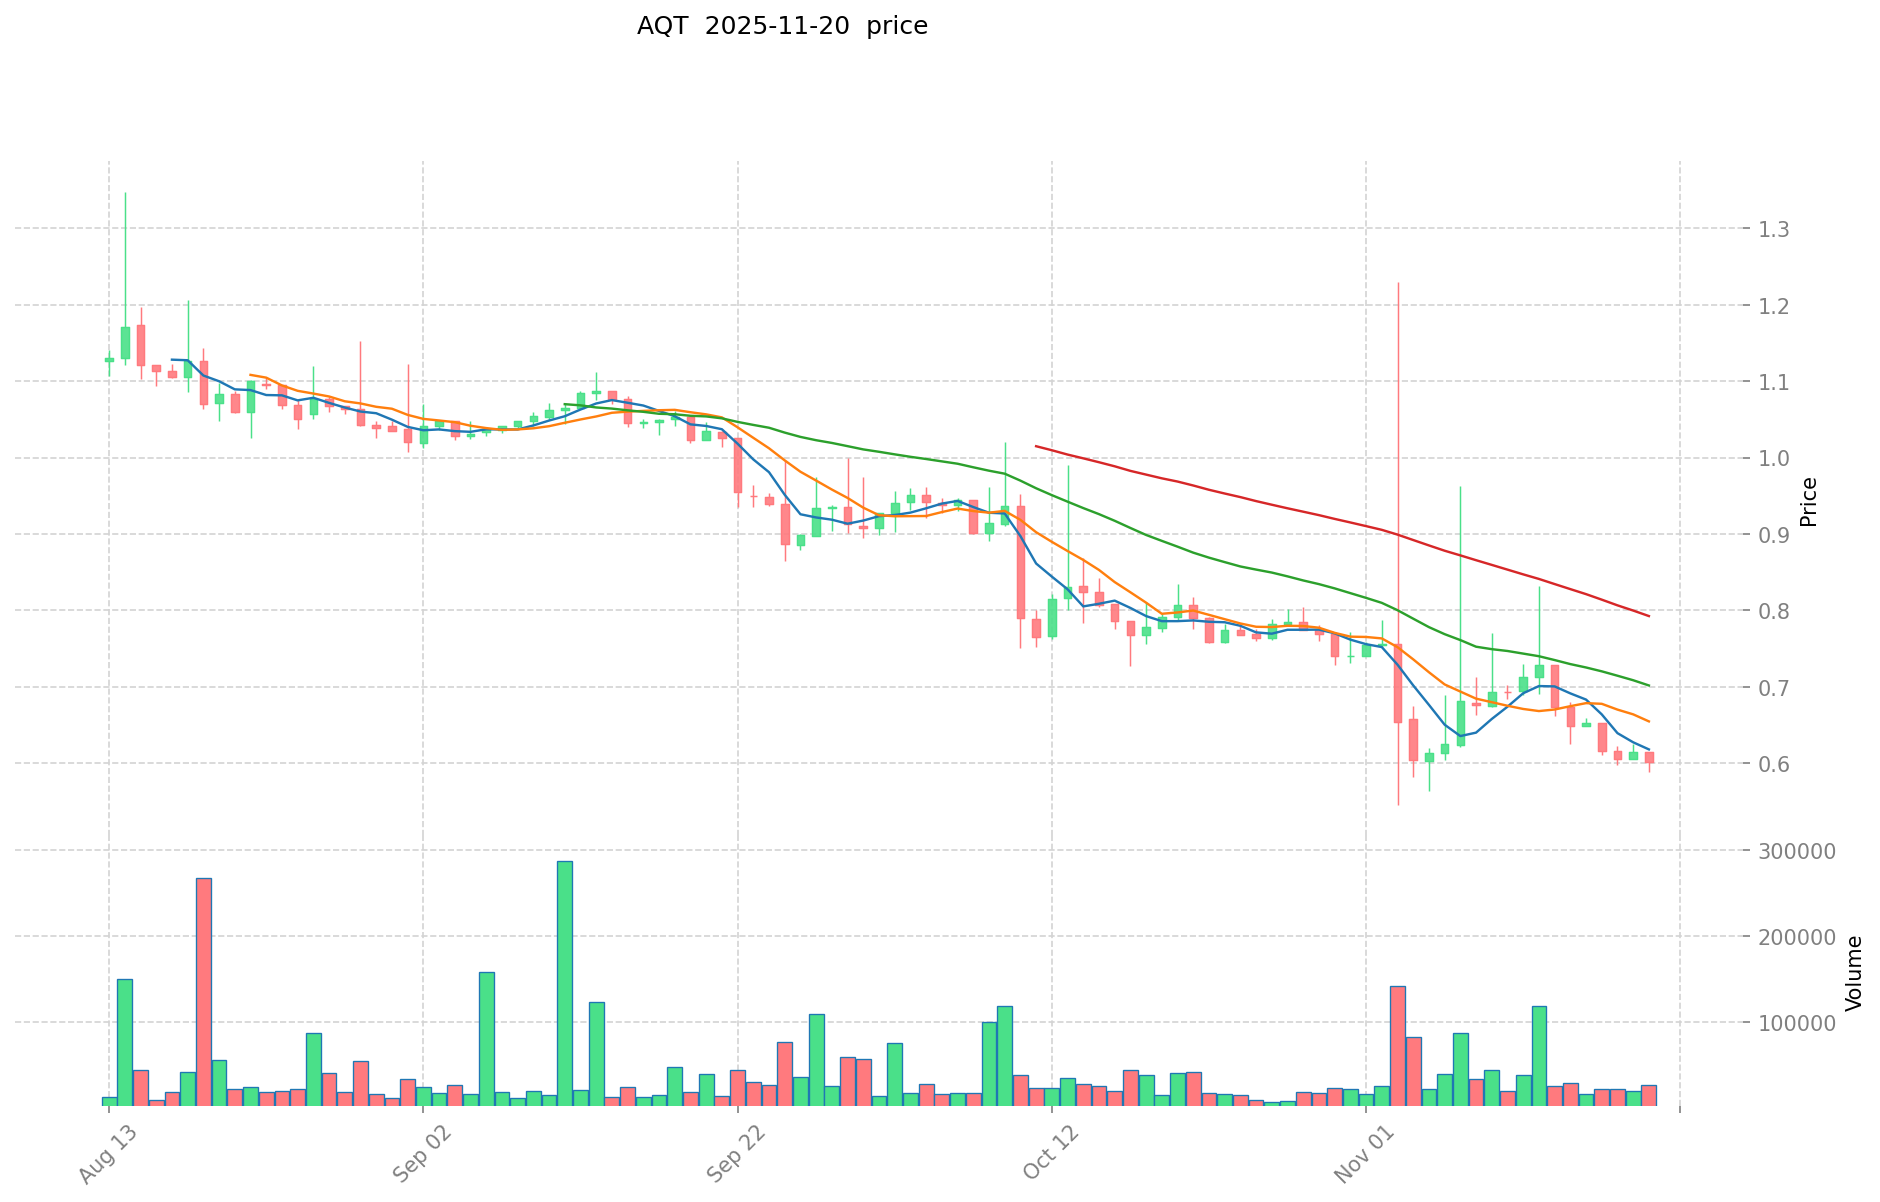
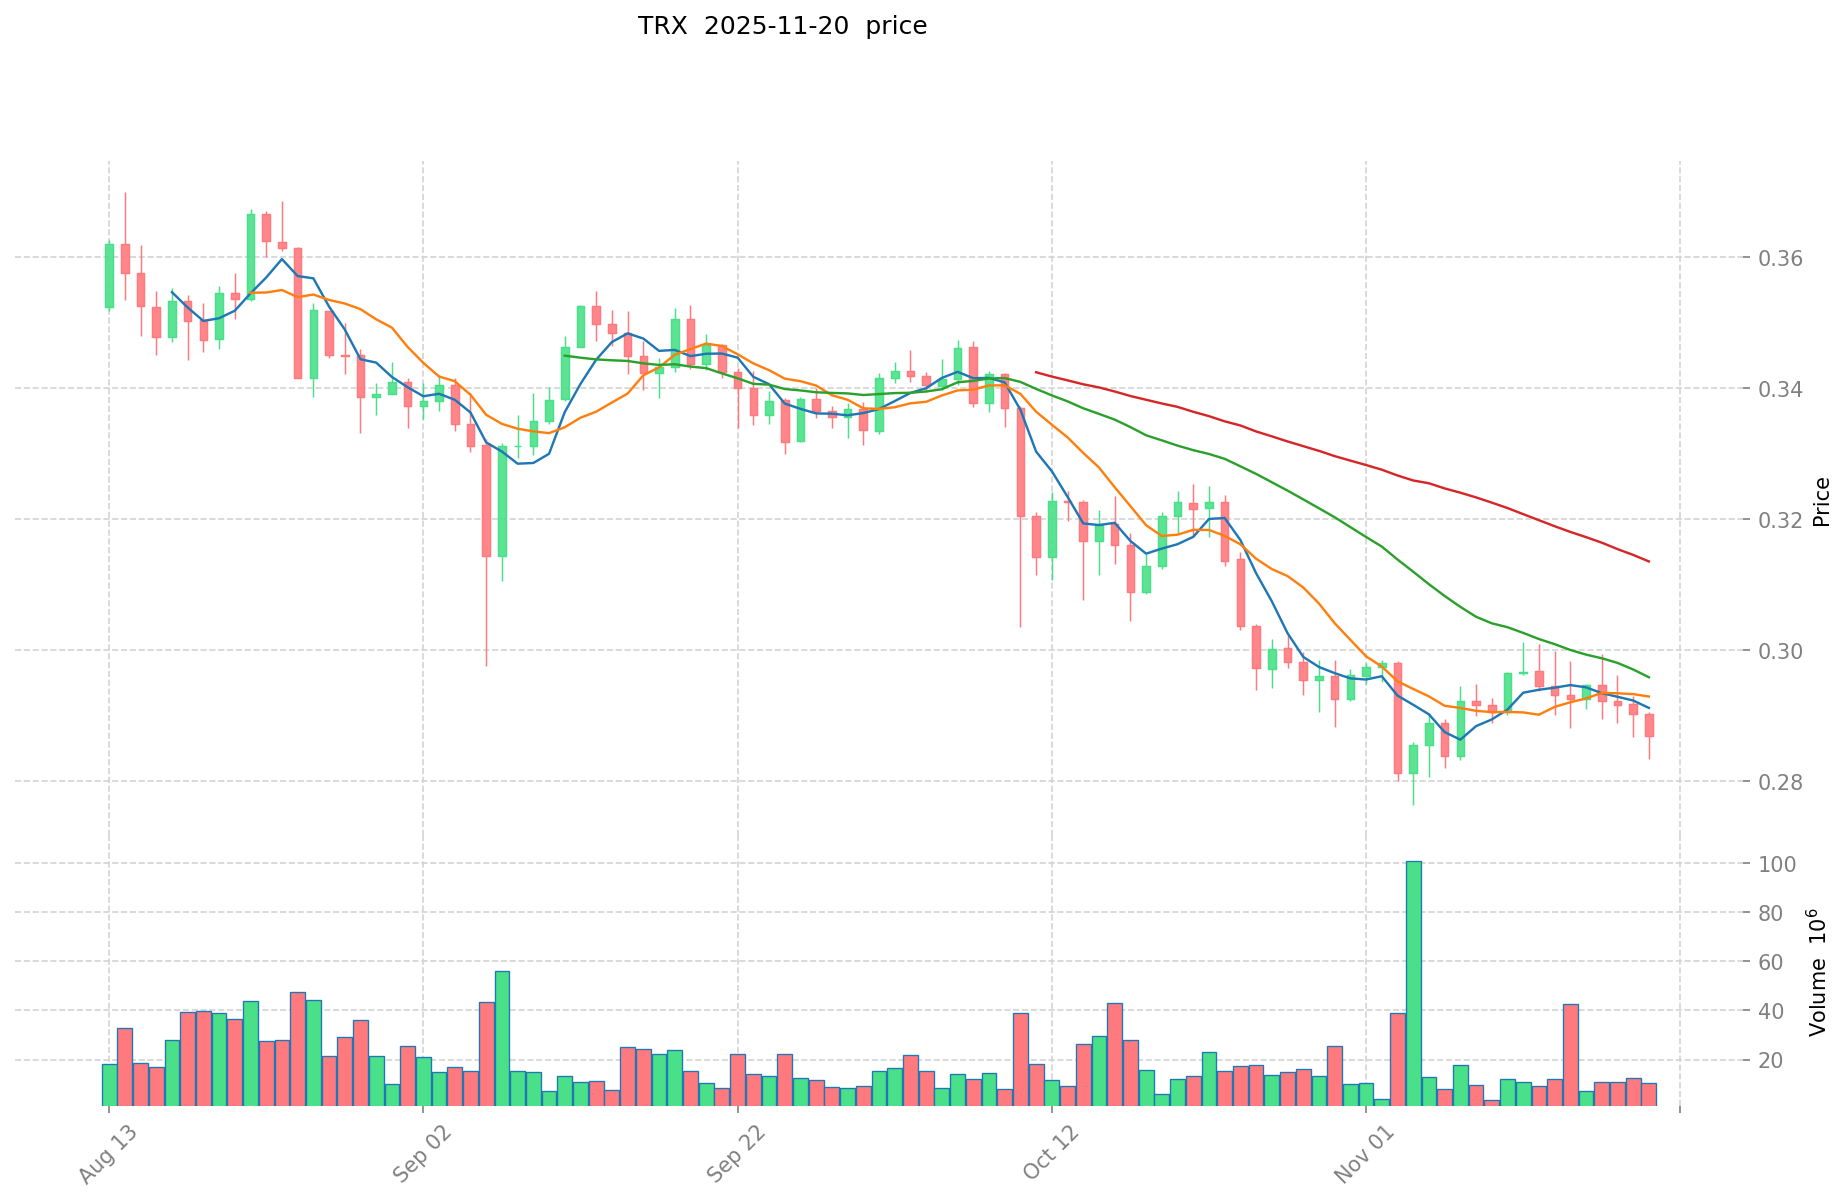
AQT and TRX Historical Price Trends
- 2024: TRX reached its all-time high of $0.44948 on December 4, marking a significant milestone.
- 2017: TRX hit its lowest price of $0.00126 on September 15, during its early stages.
- Comparative analysis: During market cycles, AQT dropped from its all-time high of $15.37 to a low of $0.582847, while TRX has shown more resilience, maintaining a higher price level relative to its historical lows.
Current Market Situation (2025-11-20)
- AQT current price: $0.597
- TRX current price: $0.28719
- 24-hour trading volume: AQT $17,046,678 vs TRX $2,906,912,836
- Market Sentiment Index (Fear & Greed Index): 11 (Extreme Fear)
Click to view real-time prices:
- Check AQT current price Market Price
- Check TRX current price Market Price
Impact of Key Factors on AQT vs TRX Investment Value
Supply Mechanism Comparison (Tokenomics)
- TRX: Native token of the Tron network, used for payments, compensation, and as fuel for running Tron dApps
- AQT: Value tied to its ecosystem utility and adoption
- 📌 Historical pattern: Supply mechanisms drive price cycle variations based on network utilization and adoption rates
Institutional Adoption & Market Applications
- Institutional holdings: TRX has attracted world-class investors including Sequoia Capital
- Enterprise adoption: TRX serves as the operational foundation for Tron's blockchain network with high TPS infrastructure
- Regulatory stance: Varies by jurisdiction, with regulatory compliance becoming increasingly important for long-term value
Technical Development & Ecosystem Building
- TRX technical features: Independent blockchain network developed from Ethereum with high performance standards
- Ecosystem comparison: Tron offers DApps and smart contracts, focusing on decentralized and secure information storage
Macroeconomic Factors & Market Cycles
- Performance in inflationary environments: Both cryptocurrencies fluctuate with broader market dynamics
- Monetary policy impacts: Interest rates and dollar strength affect cryptocurrency valuations generally
- Geopolitical factors: Demand for censorship-resistant, trustless networks increases during international uncertainty
III. 2025-2030 Price Prediction: AQT vs TRX
Short-term Prediction (2025)
- AQT: Conservative $0.39-$0.60 | Optimistic $0.60-$0.80
- TRX: Conservative $0.27-$0.29 | Optimistic $0.29-$0.39
Mid-term Prediction (2027)
- AQT may enter a growth phase, with projected prices of $0.69-$0.86
- TRX may enter a strong growth phase, with projected prices of $0.27-$0.58
- Key drivers: Institutional capital inflow, ETFs, ecosystem development
Long-term Prediction (2030)
- AQT: Base scenario $0.52-$1.03 | Optimistic scenario $1.03-$1.20
- TRX: Base scenario $0.54-$0.72 | Optimistic scenario $0.72-$0.77
Disclaimer: The above predictions are based on historical data and market analysis. Cryptocurrency markets are highly volatile and subject to change. This information should not be considered as financial advice. Always conduct your own research before making investment decisions.
AQT:
| 年份 | 预测最高价 | 预测平均价格 | 预测最低价 | 涨跌幅 |
|---|---|---|---|---|
| 2025 | 0.800114 | 0.5971 | 0.394086 | 0 |
| 2026 | 0.92216124 | 0.698607 | 0.37724778 | 17 |
| 2027 | 0.8590071672 | 0.81038412 | 0.688826502 | 35 |
| 2028 | 0.893124338652 | 0.8346956436 | 0.617674776264 | 39 |
| 2029 | 1.19219578775388 | 0.863909991126 | 0.76887989210214 | 44 |
| 2030 | 1.202821880644729 | 1.02805288943994 | 0.524306973614369 | 72 |
TRX:
| 年份 | 预测最高价 | 预测平均价格 | 预测最低价 | 涨跌幅 |
|---|---|---|---|---|
| 2025 | 0.3882465 | 0.28759 | 0.2674587 | 0 |
| 2026 | 0.479843915 | 0.33791825 | 0.2128884975 | 17 |
| 2027 | 0.584699947975 | 0.4088810825 | 0.265772703625 | 42 |
| 2028 | 0.6955067213325 | 0.4967905152375 | 0.322913834904375 | 72 |
| 2029 | 0.85249252414755 | 0.596148618285 | 0.49480335317655 | 107 |
| 2030 | 0.767779805489251 | 0.724320571216275 | 0.535997222700043 | 151 |
IV. Investment Strategy Comparison: AQT vs TRX
Long-term vs Short-term Investment Strategies
- AQT: Suitable for investors focused on digital intangible assets and IP rights trading
- TRX: Suitable for investors interested in decentralized content entertainment systems and large public blockchains
Risk Management and Asset Allocation
- Conservative investors: AQT: 30% vs TRX: 70%
- Aggressive investors: AQT: 60% vs TRX: 40%
- Hedging tools: Stablecoin allocation, options, cross-currency portfolios
V. Potential Risk Comparison
Market Risk
- AQT: Higher volatility due to smaller market cap and lower trading volume
- TRX: Susceptible to broader cryptocurrency market fluctuations
Technical Risk
- AQT: Scalability, network stability
- TRX: Computing power concentration, security vulnerabilities
Regulatory Risk
- Global regulatory policies may have different impacts on both tokens
VI. Conclusion: Which Is the Better Buy?
📌 Investment Value Summary:
- AQT advantages: Focus on digital intangible assets, potential for growth in niche market
- TRX advantages: Established ecosystem, higher trading volume, institutional backing
✅ Investment Advice:
- Novice investors: Consider a higher allocation to TRX due to its established market position
- Experienced investors: Balanced portfolio with both AQT and TRX based on risk tolerance
- Institutional investors: Conduct thorough due diligence on both projects, consider TRX for its institutional adoption
⚠️ Risk Warning: The cryptocurrency market is highly volatile. This article does not constitute investment advice. None
VII. FAQ
Q1: What are the main differences between AQT and TRX? A: AQT focuses on digital intangible assets and IP rights trading, while TRX is a decentralized content entertainment system and large public blockchain. TRX has a larger market cap, higher trading volume, and more established ecosystem compared to AQT.
Q2: Which cryptocurrency has shown better price performance historically? A: TRX has shown more resilience in price performance. It reached an all-time high of $0.44948 in December 2024 and has maintained a higher price level relative to its historical lows. AQT, on the other hand, has experienced a larger drop from its all-time high of $15.37 to a low of $0.582847.
Q3: How do the supply mechanisms of AQT and TRX compare? A: TRX is the native token of the Tron network, used for payments, compensation, and as fuel for running Tron dApps. AQT's value is tied to its ecosystem utility and adoption. Both tokens' price cycles are influenced by their supply mechanisms based on network utilization and adoption rates.
Q4: What are the price predictions for AQT and TRX in 2030? A: For AQT, the base scenario predicts a range of $0.52-$1.03, with an optimistic scenario of $1.03-$1.20. For TRX, the base scenario predicts a range of $0.54-$0.72, with an optimistic scenario of $0.72-$0.77.
Q5: How should investors allocate their portfolio between AQT and TRX? A: Conservative investors might consider allocating 30% to AQT and 70% to TRX, while aggressive investors might opt for 60% AQT and 40% TRX. However, individual allocations should be based on personal risk tolerance and investment goals.
Q6: What are the main risks associated with investing in AQT and TRX? A: Both face market risks related to cryptocurrency volatility. AQT has higher volatility due to its smaller market cap and lower trading volume. Technical risks include scalability and network stability for AQT, and computing power concentration and security vulnerabilities for TRX. Both also face regulatory risks that may vary by jurisdiction.
Share
Content

