CHEQ vs ATOM: Comparing Two Leading Ad Verification Platforms for Digital Marketers
Introduction: CHEQ vs ATOM Investment Comparison
In the cryptocurrency market, the comparison between CHEQD NETWORK vs Cosmos has always been an unavoidable topic for investors. The two not only show significant differences in market cap ranking, application scenarios, and price performance, but also represent different positions in crypto assets.
CHEQD NETWORK (CHEQ): Since its launch, it has gained market recognition for its focus on building a trusted/real data economy.
Cosmos (ATOM): Established as a parallel network where chains can communicate, trade, and interoperate with each other, it has been hailed as one of the cryptocurrencies with the highest global trading volume and market capitalization.
This article will comprehensively analyze the investment value comparison between CHEQD NETWORK vs Cosmos, focusing on historical price trends, supply mechanisms, institutional adoption, technological ecosystems, and future predictions, attempting to answer the question investors care about most:
"Which is the better buy right now?"
I. Price History Comparison and Current Market Status
CHEQ (Coin A) and ATOM (Coin B) Historical Price Trends
- 2021: CHEQ reached its all-time high of $0.71551 on November 26, 2021.
- 2022: ATOM hit its all-time high of $44.45 on January 17, 2022.
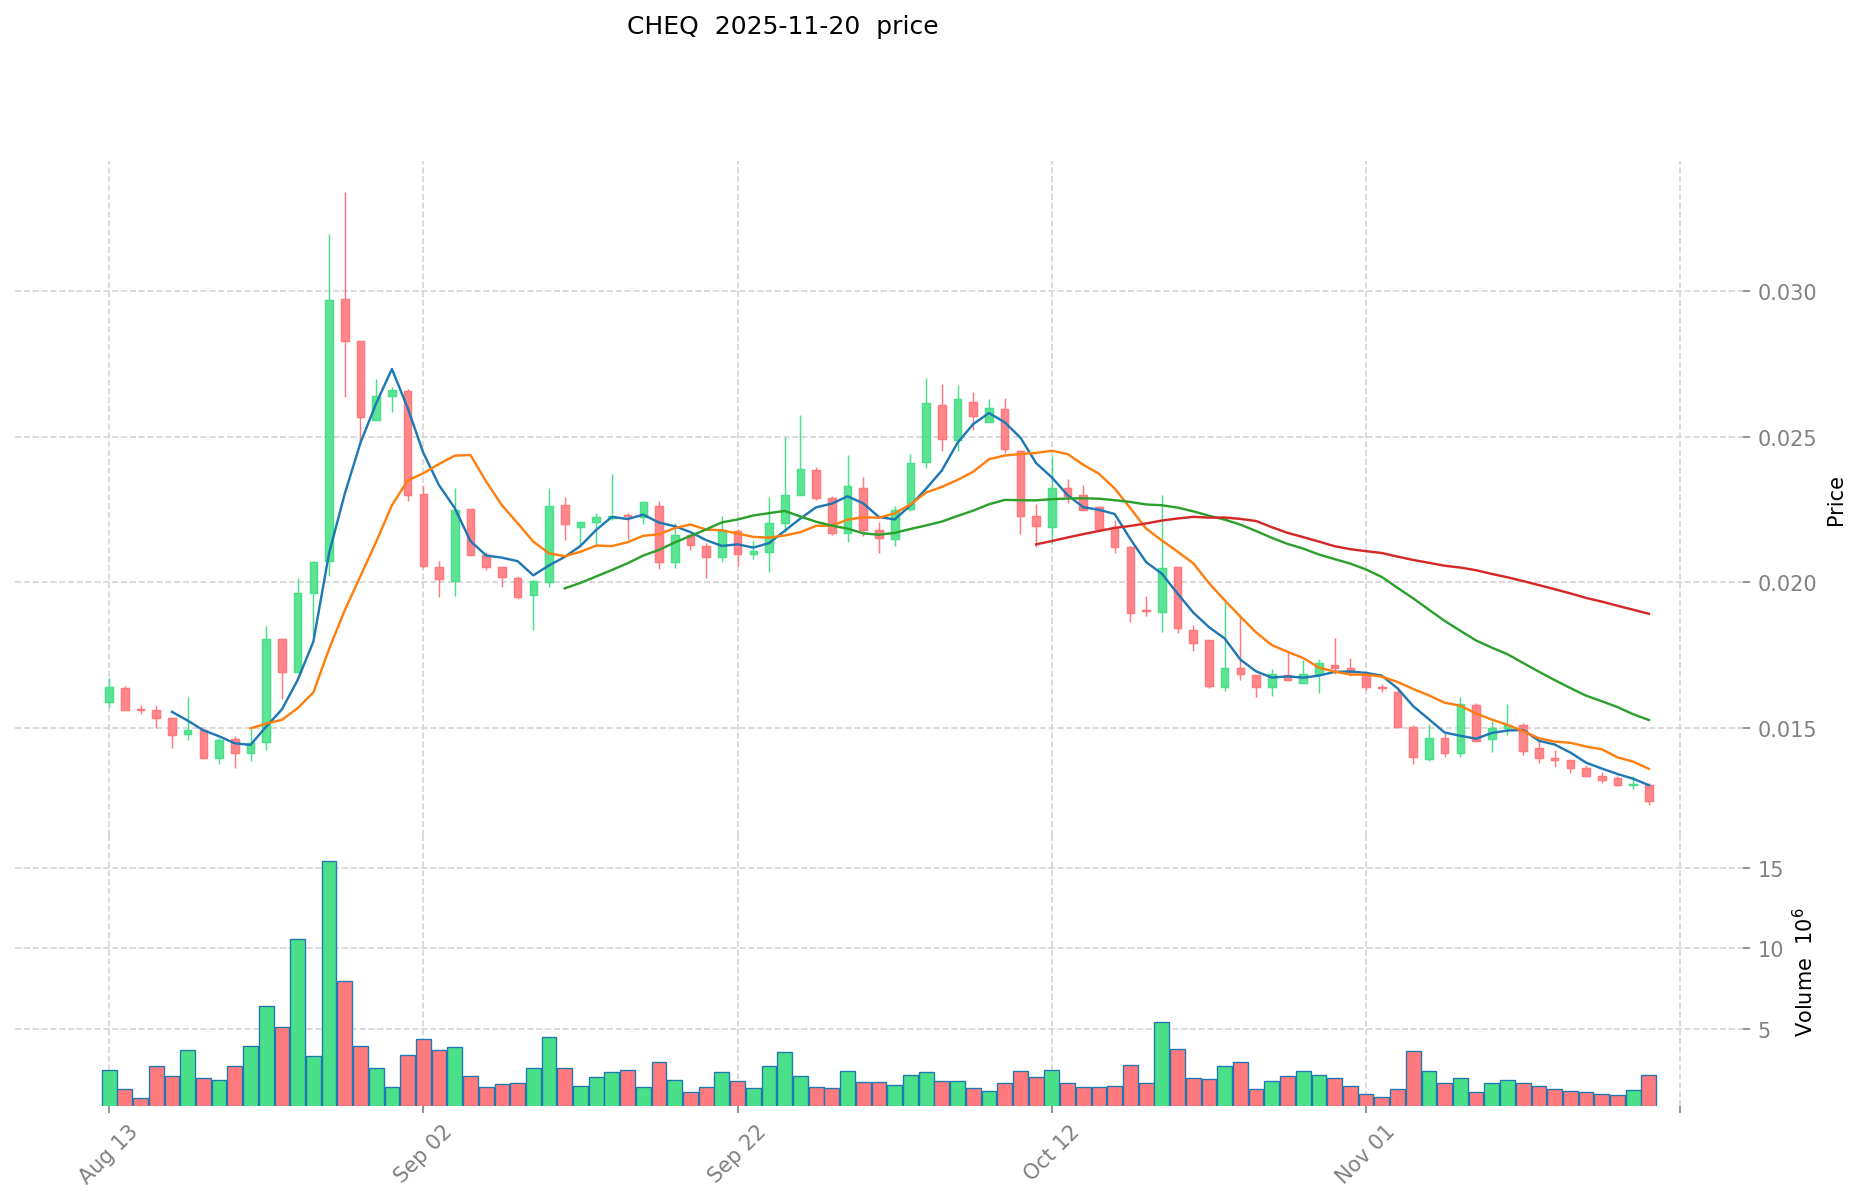
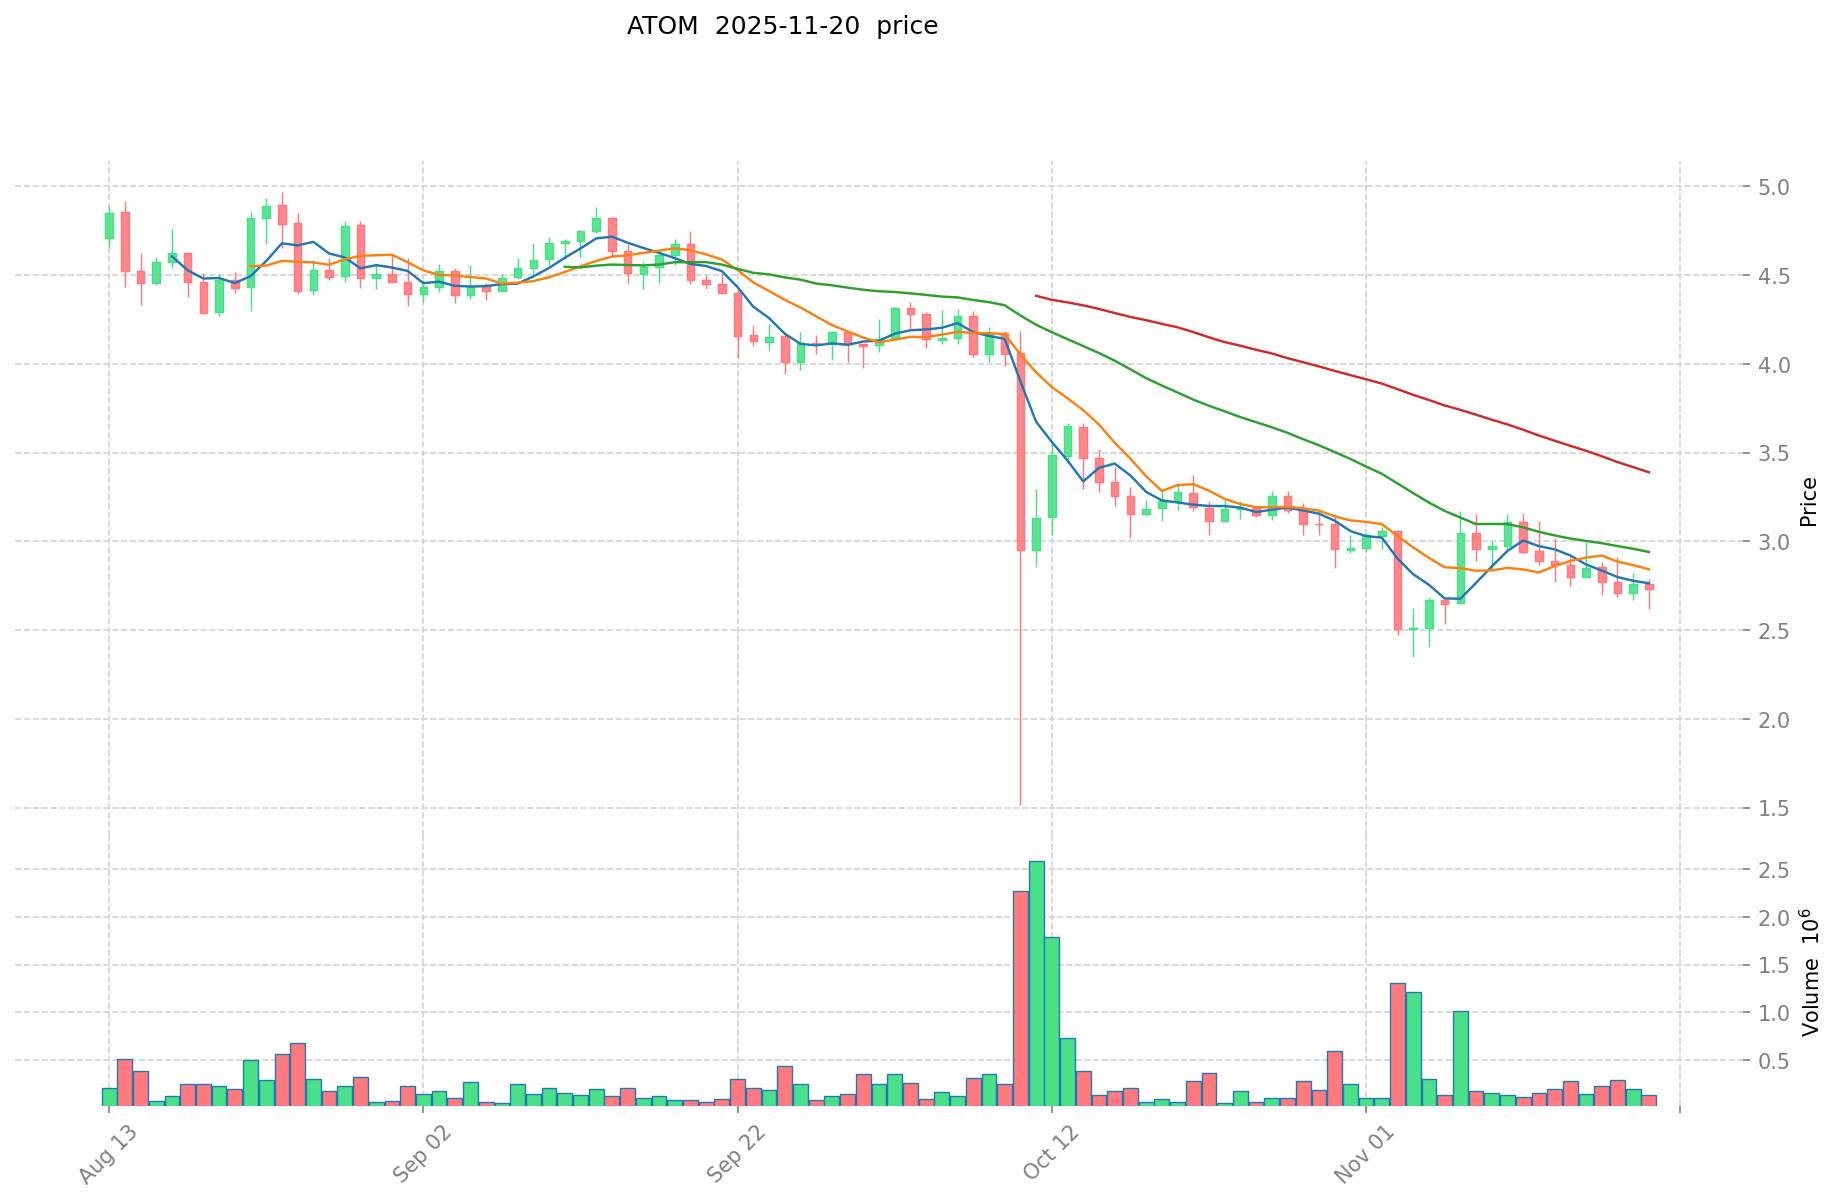
- Comparative analysis: In the current market cycle, CHEQ has fallen from its all-time high of $0.71551 to a current price of $0.01194, while ATOM has dropped from its peak of $44.45 to $2.825.
Current Market Situation (2025-11-21)
- CHEQ current price: $0.01194
- ATOM current price: $2.825
- 24-hour trading volume: CHEQ $20,765.71 vs ATOM $3,178,161.51
- Market Sentiment Index (Fear & Greed Index): 11 (Extreme Fear)
Click to view real-time prices:
- Check CHEQ current price Market Price
- Check ATOM current price Market Price
II. Core Factors Affecting Investment Value of CHEQ vs ATOM
Supply Mechanisms Comparison (Tokenomics)
- CHEQ: Initial supply of 1 billion tokens, with token emission set at 7% annually for the first three years. 300 million CHEQ (30%) allocated to the initial DEX offering.
- ATOM: Fixed annual inflation rate between 7-20%, targeting approximately 10% with adjustments based on staking participation rate. Cosmos Hub secures approximately $75 billion in assets.
- 📌 Historical pattern: CHEQ's initial token distribution focuses on supporting early DEX participation, while ATOM's adaptive inflation model incentivizes staking and network security.
Institutional Adoption and Market Applications
- Institutional holdings: ATOM has gained more institutional traction as the Cosmos ecosystem secures approximately $75 billion in assets across its network.
- Enterprise adoption: ATOM has established broader adoption through the Cosmos ecosystem with over 50 chains and applications built using its technology, while CHEQ is focusing on establishing initial partnerships in the food & beverage industry.
- Regulatory attitudes: Both tokens face similar regulatory considerations as utility tokens, though ATOM's longer market presence provides more regulatory clarity.
Technical Development and Ecosystem Building
- CHEQ technical development: Focused on building an ordering and payment protocol specific to the food and beverage industry, with initial deployment in Singapore before planned global expansion.
- ATOM technical development: Continuous improvements to the Cosmos SDK and IBC protocol that powers cross-chain communication across the ecosystem, supporting over 50 sovereign blockchains.
- Ecosystem comparison: ATOM supports a mature DeFi, NFT, and cross-chain communication ecosystem, while CHEQ is building a focused ecosystem around F&B payments and rewards.
Macroeconomic and Market Cycles
- Performance in inflationary environments: ATOM has a longer track record during various market conditions, while CHEQ is still establishing its market position.
- Macroeconomic monetary policy: Both tokens are subject to similar effects from interest rate changes and USD strength, though ATOM's wider market presence may provide more resilience.
- Geopolitical factors: CHEQ's initial focus on regional F&B markets may limit exposure to international geopolitical risks, while ATOM's global cross-chain infrastructure serves broader cross-border transaction needs.
III. 2025-2030 Price Prediction: CHEQ vs ATOM
Short-term Prediction (2025)
- CHEQ: Conservative $0.007128 - $0.01188 | Optimistic $0.01188 - $0.016038
- ATOM: Conservative $1.43769 - $2.819 | Optimistic $2.819 - $4.17212
Mid-term Prediction (2027)
- CHEQ may enter a growth phase, with estimated prices ranging from $0.01038898575 to $0.0175813605
- ATOM may enter a consolidation phase, with estimated prices ranging from $2.87072865 to $4.2471054
- Key drivers: Institutional capital inflow, ETF, ecosystem development
Long-term Prediction (2030)
- CHEQ: Base scenario $0.014235507723937 - $0.02190078111375 | Optimistic scenario $0.02190078111375 - $0.024090859225125
- ATOM: Base scenario $4.8411187744608 - $5.62920787728 | Optimistic scenario $5.62920787728 - $6.9239256890544
Disclaimer: This analysis is based on historical data and current market trends. Cryptocurrency markets are highly volatile and unpredictable. This information should not be considered as financial advice. Always conduct your own research before making investment decisions.
CHEQ:
| 年份 | 预测最高价 | 预测平均价格 | 预测最低价 | 涨跌幅 |
|---|---|---|---|---|
| 2025 | 0.016038 | 0.01188 | 0.007128 | 0 |
| 2026 | 0.01800711 | 0.013959 | 0.00767745 | 17 |
| 2027 | 0.0175813605 | 0.015983055 | 0.01038898575 | 34 |
| 2028 | 0.02215251423 | 0.01678220775 | 0.0085589259525 | 41 |
| 2029 | 0.0243342012375 | 0.01946736099 | 0.0173259512811 | 63 |
| 2030 | 0.024090859225125 | 0.02190078111375 | 0.014235507723937 | 84 |
ATOM:
| 年份 | 预测最高价 | 预测平均价格 | 预测最低价 | 涨跌幅 |
|---|---|---|---|---|
| 2025 | 4.17212 | 2.819 | 1.43769 | 0 |
| 2026 | 4.36945 | 3.49556 | 2.446892 | 24 |
| 2027 | 4.2471054 | 3.932505 | 2.87072865 | 39 |
| 2028 | 6.052911696 | 4.0898052 | 2.331188964 | 45 |
| 2029 | 6.18705730656 | 5.071358448 | 2.94138789984 | 80 |
| 2030 | 6.9239256890544 | 5.62920787728 | 4.8411187744608 | 99 |
IV. Investment Strategy Comparison: CHEQ vs ATOM
Long-term vs Short-term Investment Strategies
- CHEQ: Suitable for investors focused on niche payment solutions and emerging ecosystems
- ATOM: Suitable for investors seeking established cross-chain infrastructure and ecosystem stability
Risk Management and Asset Allocation
- Conservative investors: CHEQ: 10% vs ATOM: 90%
- Aggressive investors: CHEQ: 30% vs ATOM: 70%
- Hedging tools: Stablecoin allocation, options, cross-currency portfolios
V. Potential Risk Comparison
Market Risks
- CHEQ: Limited market presence and adoption in early stages
- ATOM: Exposure to broader crypto market volatility and ecosystem-wide risks
Technical Risks
- CHEQ: Scalability, network stability in early development phases
- ATOM: Potential vulnerabilities in cross-chain communication, ecosystem interdependence
Regulatory Risks
- Global regulatory policies may impact both, with ATOM potentially facing more scrutiny due to its wider ecosystem reach
VI. Conclusion: Which Is the Better Buy?
📌 Investment Value Summary:
- CHEQ advantages: Focused niche market (F&B industry), potential for rapid growth in specific use case
- ATOM advantages: Established ecosystem, cross-chain interoperability, broader institutional adoption
✅ Investment Advice:
- New investors: Consider a small allocation to ATOM for exposure to the broader crypto ecosystem
- Experienced investors: Balanced approach with both CHEQ and ATOM, adjusting based on risk tolerance
- Institutional investors: Focus on ATOM for its established market presence and ecosystem value
⚠️ Risk Warning: The cryptocurrency market is highly volatile. This article does not constitute investment advice. None
VII. FAQ
Q1: What are the main differences between CHEQ and ATOM? A: CHEQ focuses on building a trusted data economy and payment solutions for the food & beverage industry, while ATOM is an established ecosystem for cross-chain communication and interoperability. ATOM has a larger market cap, higher trading volume, and broader institutional adoption compared to CHEQ.
Q2: Which token has performed better historically? A: ATOM has shown better historical performance. It reached an all-time high of $44.45 in January 2022, while CHEQ's all-time high was $0.71551 in November 2021. As of 2025-11-21, ATOM is trading at $2.825, while CHEQ is at $0.01194.
Q3: How do the supply mechanisms of CHEQ and ATOM differ? A: CHEQ had an initial supply of 1 billion tokens with a 7% annual emission rate for the first three years. ATOM has a flexible inflation rate between 7-20%, targeting around 10%, which adjusts based on staking participation to incentivize network security.
Q4: What are the key factors affecting the investment value of these tokens? A: Key factors include institutional adoption, market applications, technical development, ecosystem building, macroeconomic conditions, and regulatory environments. ATOM generally has an advantage in most of these areas due to its more established position in the market.
Q5: How do the long-term price predictions compare for CHEQ and ATOM? A: For 2030, CHEQ's base scenario predicts a range of $0.014235507723937 - $0.02190078111375, while ATOM's base scenario predicts $4.8411187744608 - $5.62920787728. ATOM is expected to have higher absolute prices, but CHEQ may have more potential for percentage growth from its current lower price point.
Q6: What are the main risks associated with investing in CHEQ and ATOM? A: For CHEQ, main risks include limited market presence, adoption challenges, and technical risks in early development stages. For ATOM, risks include exposure to broader crypto market volatility, potential vulnerabilities in cross-chain communication, and regulatory scrutiny due to its wider ecosystem reach.
Q7: Which token is considered better for new investors? A: For new investors, ATOM is generally considered a safer choice due to its established ecosystem, broader institutional adoption, and more extensive track record. However, investment decisions should always be based on individual risk tolerance and thorough research.
Share
Content
Introduction: CHEQ vs ATOM Investment Comparison
I. Price History Comparison and Current Market Status
II. Core Factors Affecting Investment Value of CHEQ vs ATOM
III. 2025-2030 Price Prediction: CHEQ vs ATOM
IV. Investment Strategy Comparison: CHEQ vs ATOM
V. Potential Risk Comparison
VI. Conclusion: Which Is the Better Buy?
VII. FAQ

