CHEQ vs BAT: The Battle for Ad Fraud Prevention Supremacy in Digital Marketing
Introduction: CHEQ vs BAT Investment Comparison
In the cryptocurrency market, the comparison between CHEQ and BAT has always been a topic that investors cannot ignore. The two not only show significant differences in market cap ranking, application scenarios, and price performance, but also represent different positioning in the crypto asset space.
CHEQ (CHEQ): Since its launch, it has gained market recognition for its focus on building a trusted/real data economy.
BAT (BAT): Introduced in 2017, it has been hailed as a digital asset for circulation between advertisers and users, addressing issues of ad display and user incentivization in browsers.
This article will comprehensively analyze the investment value comparison between CHEQ and BAT, focusing on historical price trends, supply mechanisms, institutional adoption, technological ecosystems, and future predictions, attempting to answer the question investors care about most:
"Which is the better buy right now?"
I. Price History Comparison and Current Market Status
CHEQ and BAT Historical Price Trends
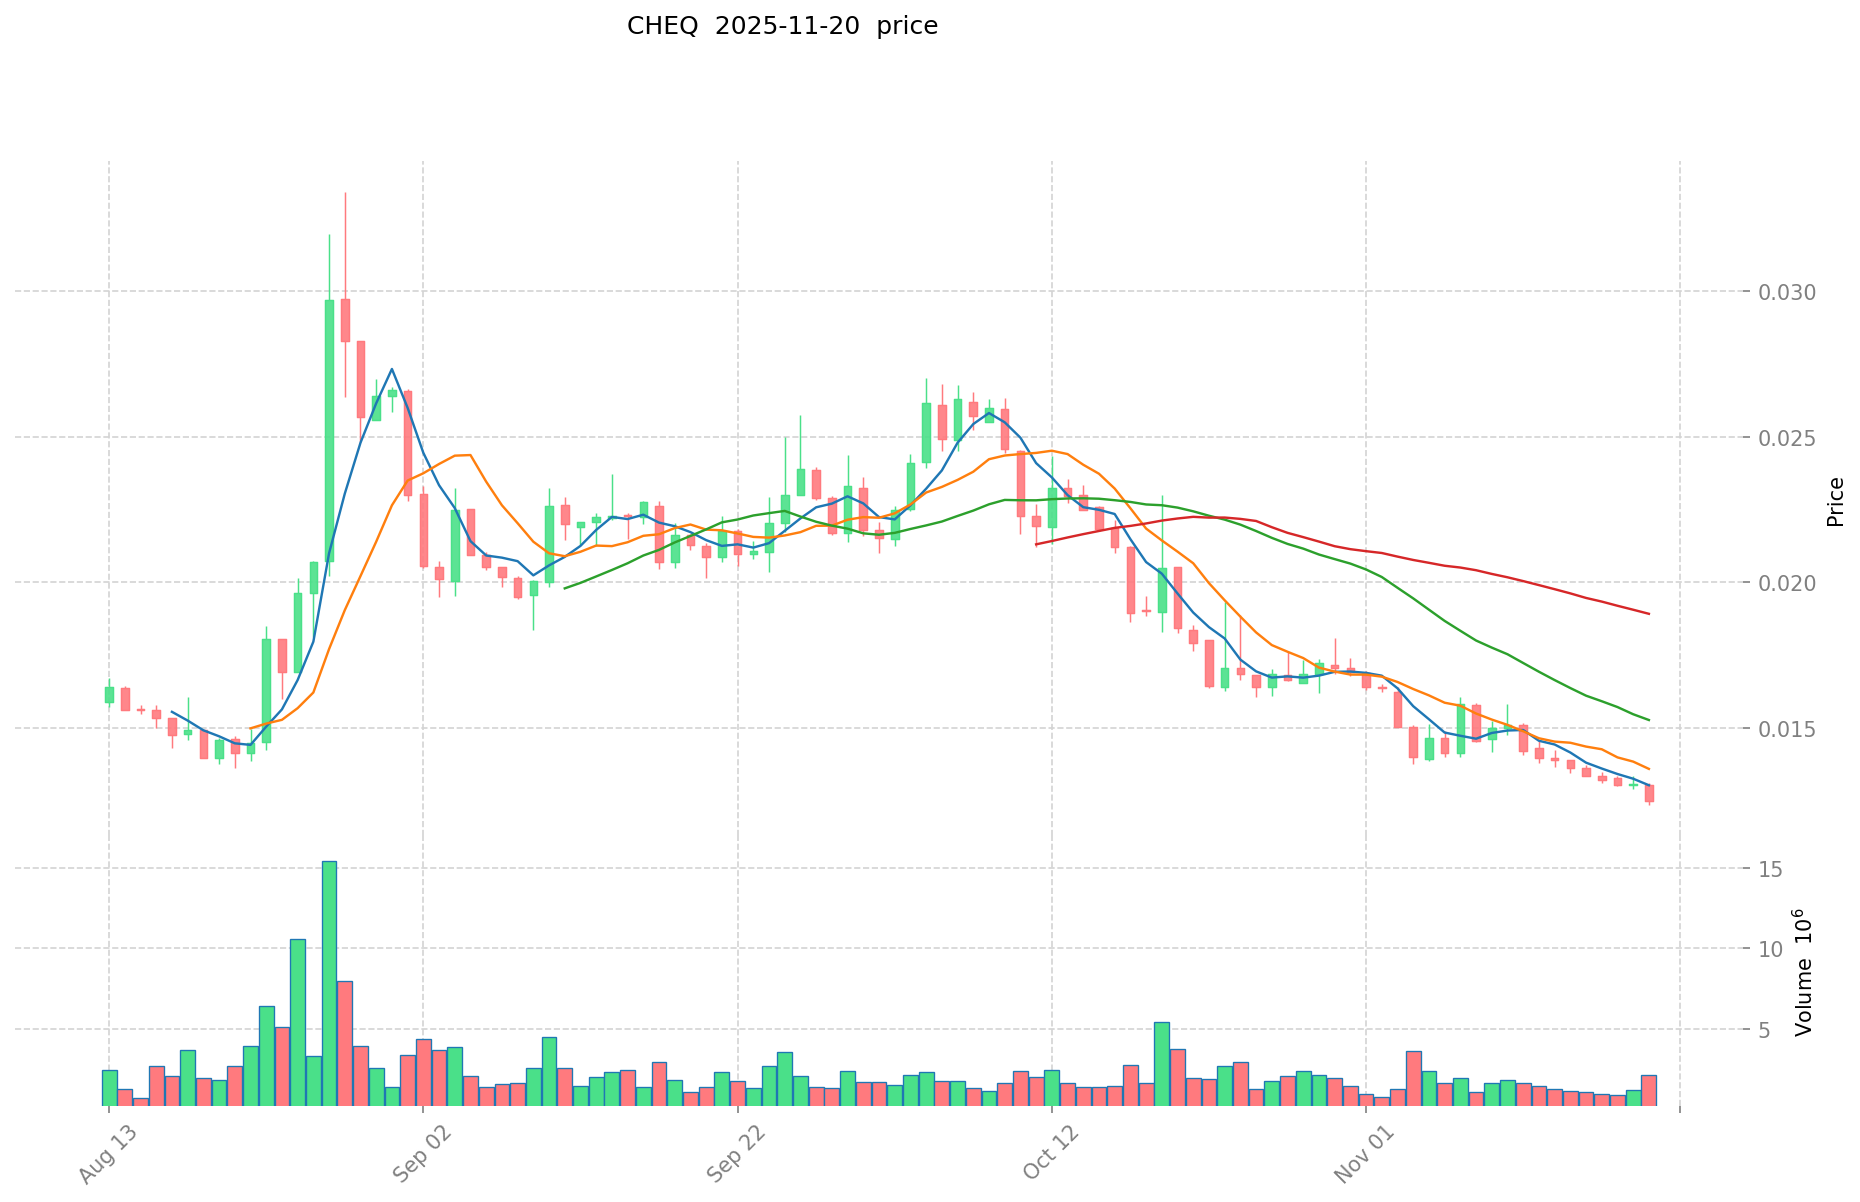
- 2021: CHEQ reached its all-time high of $0.71551 on November 26, 2021.
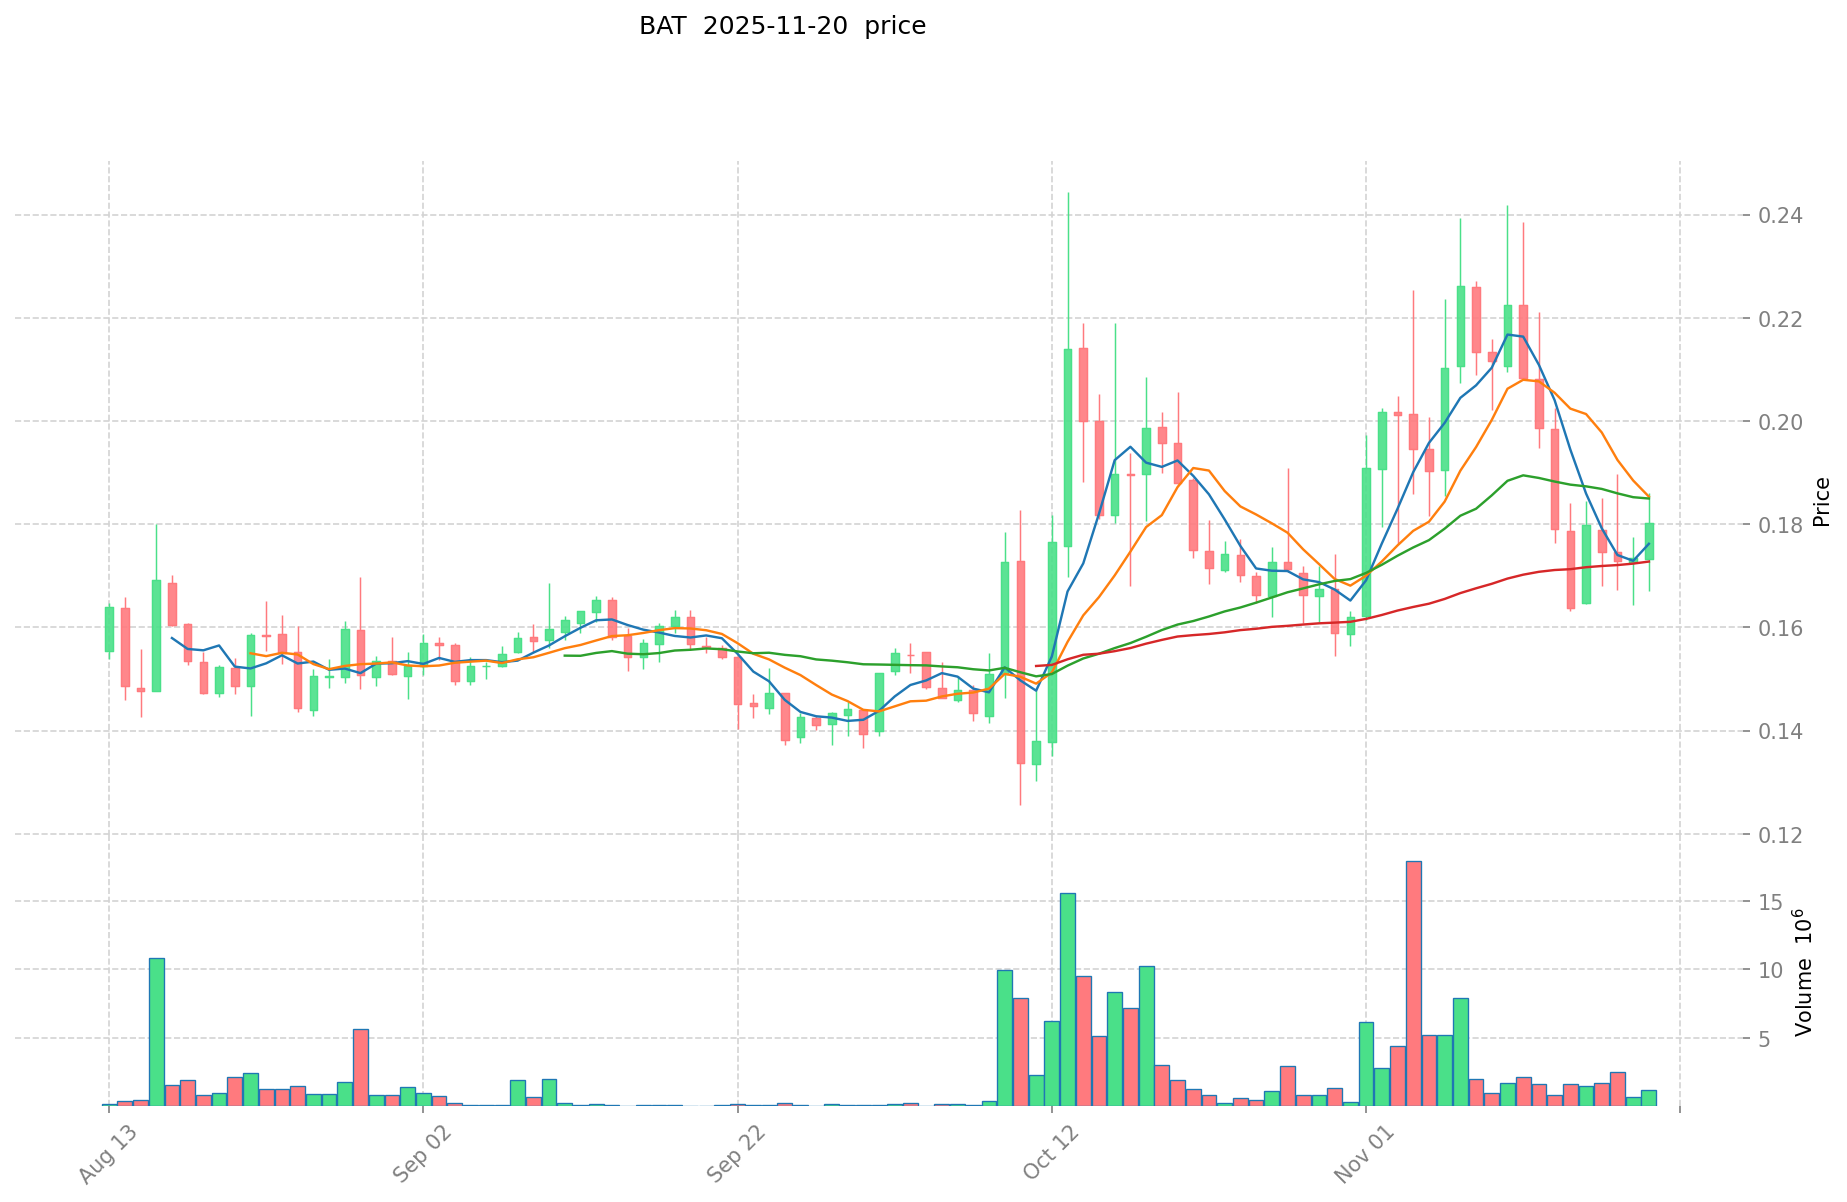
- 2017: BAT was launched at an initial price of $0.035998 on May 31, 2017.
- Comparative analysis: CHEQ has fallen from its all-time high of $0.71551 to its current price of $0.01205, while BAT has risen from its launch price to $0.1719.
Current Market Situation (2025-11-21)
- CHEQ current price: $0.01205
- BAT current price: $0.1719
- 24-hour trading volume: CHEQ $18,797.70 vs BAT $143,188.69
- Market Sentiment Index (Fear & Greed Index): 11 (Extreme Fear)
Click to view real-time prices:
- View CHEQ current price Market Price
- View BAT current price Market Price
II. Key Factors Affecting the Investment Value of CHEQ vs BAT
Supply Mechanisms Comparison (Tokenomics)
- CHEQ: Fixed maximum supply of 1 billion tokens with controlled distribution through a vesting schedule
- BAT: Fixed supply of 1.5 billion tokens with no additional issuance
- 📌 Historical pattern: Deflationary or fixed supply models like these tend to create scarcity over time, potentially supporting price appreciation when demand increases.
Institutional Adoption and Market Applications
- Institutional holdings: BAT has longer track record of institutional interest through the Brave browser ecosystem
- Enterprise adoption: CHEQ shows potential for payment systems in hospitality industry, while BAT is established in digital advertising
- National policies: Regulatory approaches vary by jurisdiction, with both tokens facing similar regulatory challenges as utility tokens
Technology Development and Ecosystem Building
- CHEQ technology: Focuses on payment solutions for hospitality industry with zero-fee transactions and point-of-sale integration
- BAT technology: Integrated with Brave browser providing privacy-focused advertising solutions and rewards system
- Ecosystem comparison: BAT has a more mature ecosystem centered around digital advertising and content creation, while CHEQ is building specifically within hospitality and restaurant sectors
Macroeconomic and Market Cycles
- Performance during inflation: Neither has extensive data during high inflation periods
- Macroeconomic monetary policy: Both tokens show sensitivity to broader crypto market cycles and risk sentiment
- Geopolitical factors: BAT's privacy focus may benefit from increasing concerns about data privacy globally
III. Price Predictions for 2025-2030: CHEQ vs BAT
Short-term Predictions (2025)
- CHEQ: Conservative $0.007259 - $0.0119 | Optimistic $0.0119 - $0.013804
- BAT: Conservative $0.107793 - $0.1711 | Optimistic $0.1711 - $0.248095
Mid-term Predictions (2027)
- CHEQ may enter a growth phase, with prices expected in the range of $0.0125846784 - $0.0192702888
- BAT may enter a bullish market, with prices expected in the range of $0.161390075 - $0.2928077075
- Key drivers: Institutional capital inflow, ETFs, ecosystem development
Long-term Predictions (2030)
- CHEQ: Base scenario $0.01940533649145 - $0.02891395137226 | Optimistic scenario $0.02891395137226+
- BAT: Base scenario $0.2936077411575 - $0.3288406700964 | Optimistic scenario $0.3288406700964+
Disclaimer: The information provided is for informational purposes only and should not be considered as financial advice. Cryptocurrency markets are highly volatile and unpredictable. Always conduct your own research before making any investment decisions.
CHEQ:
| 年份 | 预测最高价 | 预测平均价格 | 预测最低价 | 涨跌幅 |
|---|---|---|---|---|
| 2025 | 0.013804 | 0.0119 | 0.007259 | -1 |
| 2026 | 0.01336608 | 0.012852 | 0.00745416 | 6 |
| 2027 | 0.0192702888 | 0.01310904 | 0.0125846784 | 8 |
| 2028 | 0.01861811406 | 0.0161896644 | 0.010361385216 | 34 |
| 2029 | 0.0214067837529 | 0.01740388923 | 0.0114865668918 | 44 |
| 2030 | 0.02891395137226 | 0.01940533649145 | 0.011837255259784 | 61 |
BAT:
| 年份 | 预测最高价 | 预测平均价格 | 预测最低价 | 涨跌幅 |
|---|---|---|---|---|
| 2025 | 0.248095 | 0.1711 | 0.107793 | 0 |
| 2026 | 0.251517 | 0.2095975 | 0.144622275 | 21 |
| 2027 | 0.2928077075 | 0.23055725 | 0.161390075 | 34 |
| 2028 | 0.3140189745 | 0.26168247875 | 0.1386917137375 | 52 |
| 2029 | 0.29936475569 | 0.287850726625 | 0.2245235667675 | 67 |
| 2030 | 0.3288406700964 | 0.2936077411575 | 0.1996532639871 | 70 |
IV. Investment Strategy Comparison: CHEQ vs BAT
Long-term vs Short-term Investment Strategy
- CHEQ: Suitable for investors focusing on payment solutions in hospitality industry and ecosystem potential
- BAT: Suitable for investors interested in digital advertising and content creation ecosystems
Risk Management and Asset Allocation
- Conservative investors: CHEQ 30% vs BAT 70%
- Aggressive investors: CHEQ 60% vs BAT 40%
- Hedging tools: Stablecoin allocation, options, cross-currency portfolio
V. Potential Risk Comparison
Market Risk
- CHEQ: Limited market presence and adoption in the hospitality sector
- BAT: Dependence on Brave browser adoption and digital advertising market fluctuations
Technical Risk
- CHEQ: Scalability, network stability
- BAT: Concentration of usage within Brave ecosystem, potential security vulnerabilities
Regulatory Risk
- Global regulatory policies may impact both tokens differently, with BAT potentially facing more scrutiny due to its connection with digital advertising
VI. Conclusion: Which Is the Better Buy?
📌 Investment Value Summary:
- CHEQ advantages: Focus on hospitality industry payments, potential for zero-fee transactions
- BAT advantages: Established ecosystem with Brave browser, longer track record in digital advertising
✅ Investment Advice:
- New investors: Consider a balanced approach with a slight preference for BAT due to its more established ecosystem
- Experienced investors: Explore opportunities in both, with a higher allocation to CHEQ for potential growth
- Institutional investors: Evaluate BAT for its established market presence and CHEQ for its niche potential in hospitality sector
⚠️ Risk Warning: The cryptocurrency market is highly volatile, and this article does not constitute investment advice. None
VII. FAQ
Q1: What are the main differences between CHEQ and BAT in terms of their use cases? A: CHEQ focuses on building a trusted data economy and payment solutions for the hospitality industry, while BAT is designed as a digital asset for circulation between advertisers and users in the digital advertising space, primarily within the Brave browser ecosystem.
Q2: How do the current market prices of CHEQ and BAT compare? A: As of 2025-11-21, CHEQ is priced at $0.01205, while BAT is trading at $0.1719. BAT has a higher current market price and larger 24-hour trading volume compared to CHEQ.
Q3: What are the supply mechanisms for CHEQ and BAT? A: CHEQ has a fixed maximum supply of 1 billion tokens with controlled distribution through a vesting schedule. BAT has a fixed supply of 1.5 billion tokens with no additional issuance. Both tokens follow deflationary or fixed supply models.
Q4: How do institutional adoption and market applications differ between CHEQ and BAT? A: BAT has a longer track record of institutional interest through the Brave browser ecosystem and is established in digital advertising. CHEQ shows potential for payment systems in the hospitality industry but has less widespread adoption currently.
Q5: What are the long-term price predictions for CHEQ and BAT by 2030? A: For CHEQ, the base scenario predicts a range of $0.01940533649145 - $0.02891395137226, with an optimistic scenario above $0.02891395137226. For BAT, the base scenario predicts a range of $0.2936077411575 - $0.3288406700964, with an optimistic scenario above $0.3288406700964.
Q6: How should investors allocate their assets between CHEQ and BAT? A: Conservative investors might consider allocating 30% to CHEQ and 70% to BAT, while aggressive investors might allocate 60% to CHEQ and 40% to BAT. The specific allocation should be based on individual risk tolerance and investment goals.
Q7: What are the main risks associated with investing in CHEQ and BAT? A: For CHEQ, risks include limited market presence and adoption in the hospitality sector, as well as potential scalability and network stability issues. For BAT, risks include dependence on Brave browser adoption, digital advertising market fluctuations, and potential security vulnerabilities within its ecosystem.
Share
Content
Introduction: CHEQ vs BAT Investment Comparison
I. Price History Comparison and Current Market Status
II. Key Factors Affecting the Investment Value of CHEQ vs BAT
III. Price Predictions for 2025-2030: CHEQ vs BAT
IV. Investment Strategy Comparison: CHEQ vs BAT
V. Potential Risk Comparison
VI. Conclusion: Which Is the Better Buy?
VII. FAQ

