DYM vs TRX: The Battle for Dominance in Decentralized Storage Solutions
Introduction: DYM vs TRX Investment Comparison
In the cryptocurrency market, the comparison between Dymension (DYM) vs TRON (TRX) has been an unavoidable topic for investors. The two not only differ significantly in market cap ranking, application scenarios, and price performance, but also represent different cryptocurrency asset positions.
Dymension (DYM): Since its launch, it has gained market recognition as an L1 blockchain built for modular RollApps.
TRON (TRX): Since its inception in 2017, it has been hailed as a decentralized platform for content entertainment, and is one of the cryptocurrencies with the highest global trading volume and market capitalization.
This article will comprehensively analyze the investment value comparison between DYM vs TRX, focusing on historical price trends, supply mechanisms, institutional adoption, technological ecosystems, and future predictions, and attempt to answer the question investors care most about:
"Which is the better buy right now?"
I. Price History Comparison and Current Market Situation
DYM and TRX Historical Price Trends
- 2024: DYM reached its all-time high of $8.7379 on February 14, 2024.
- 2024: TRX hit its all-time high of $0.431288 on December 4, 2024.
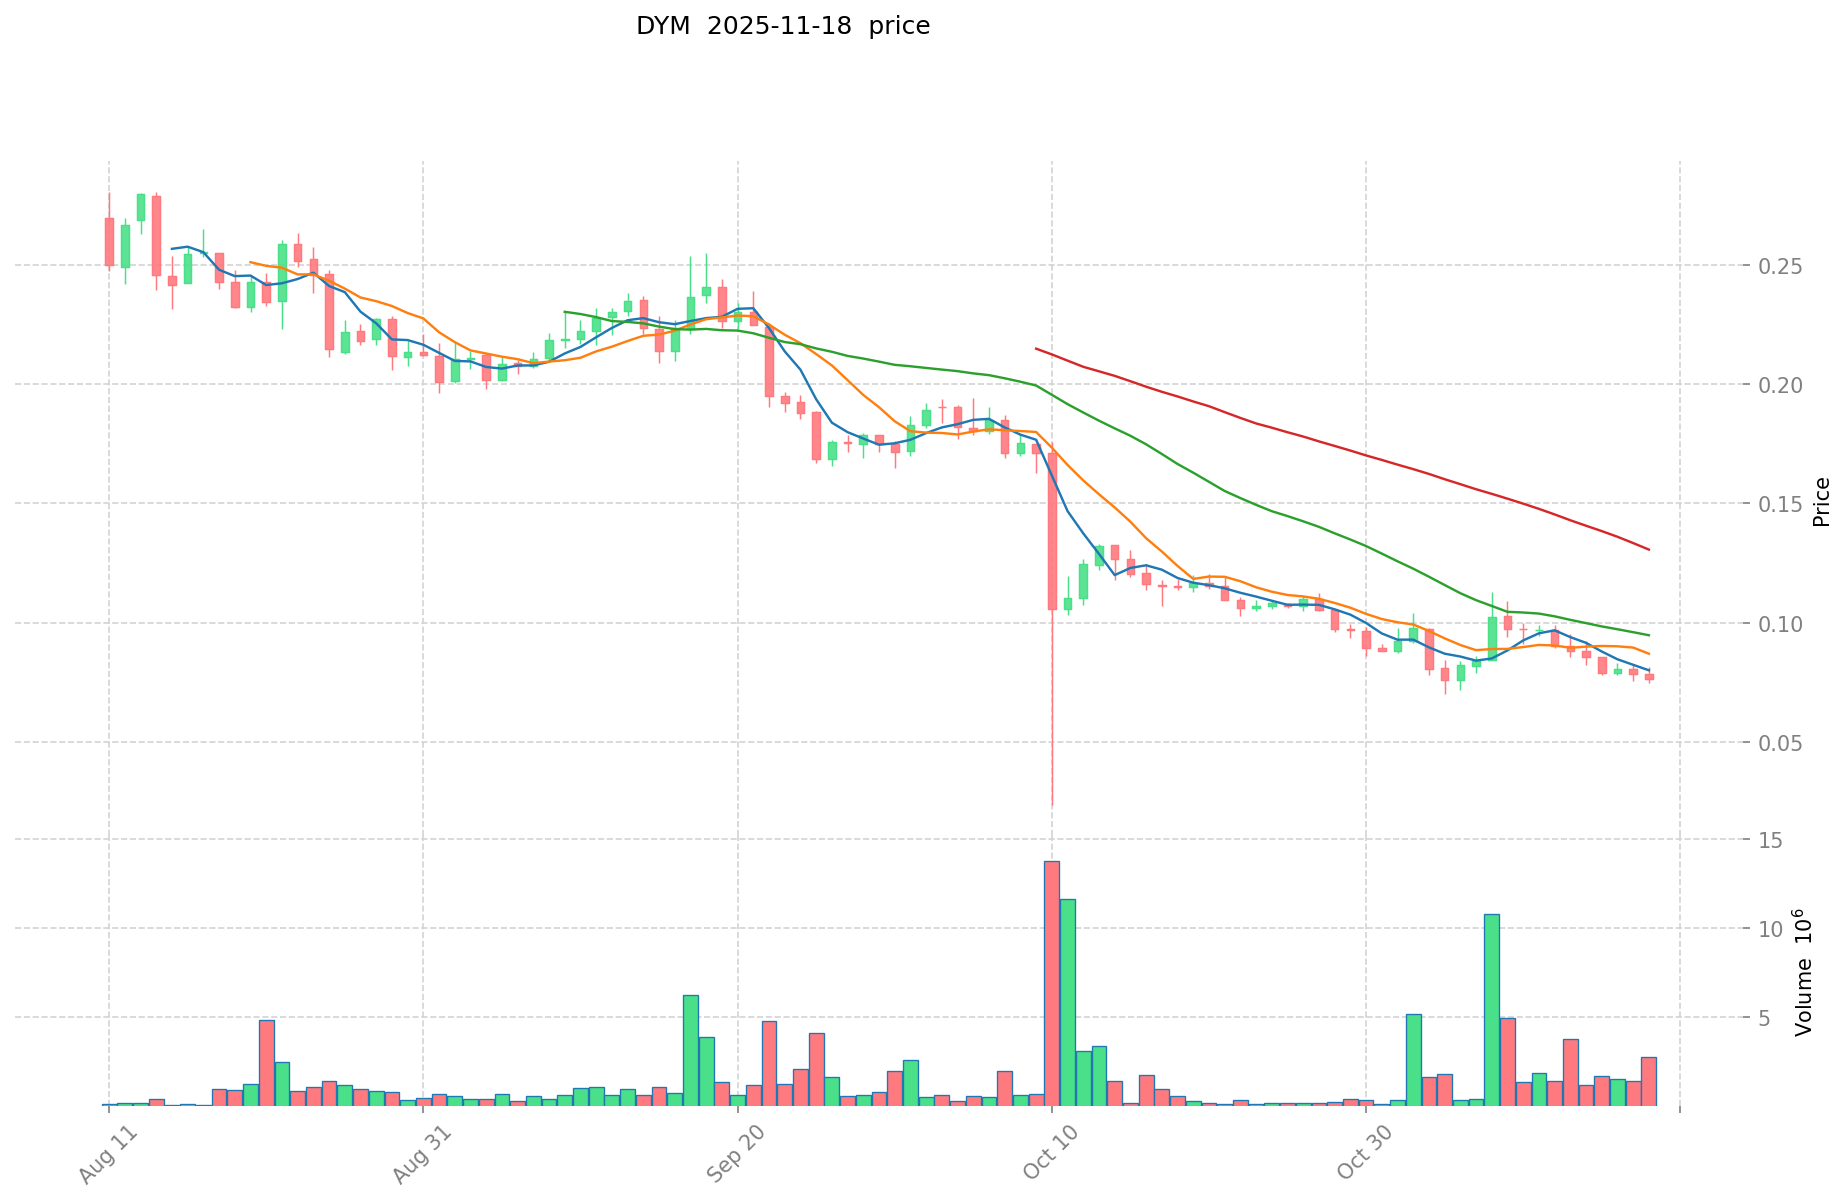
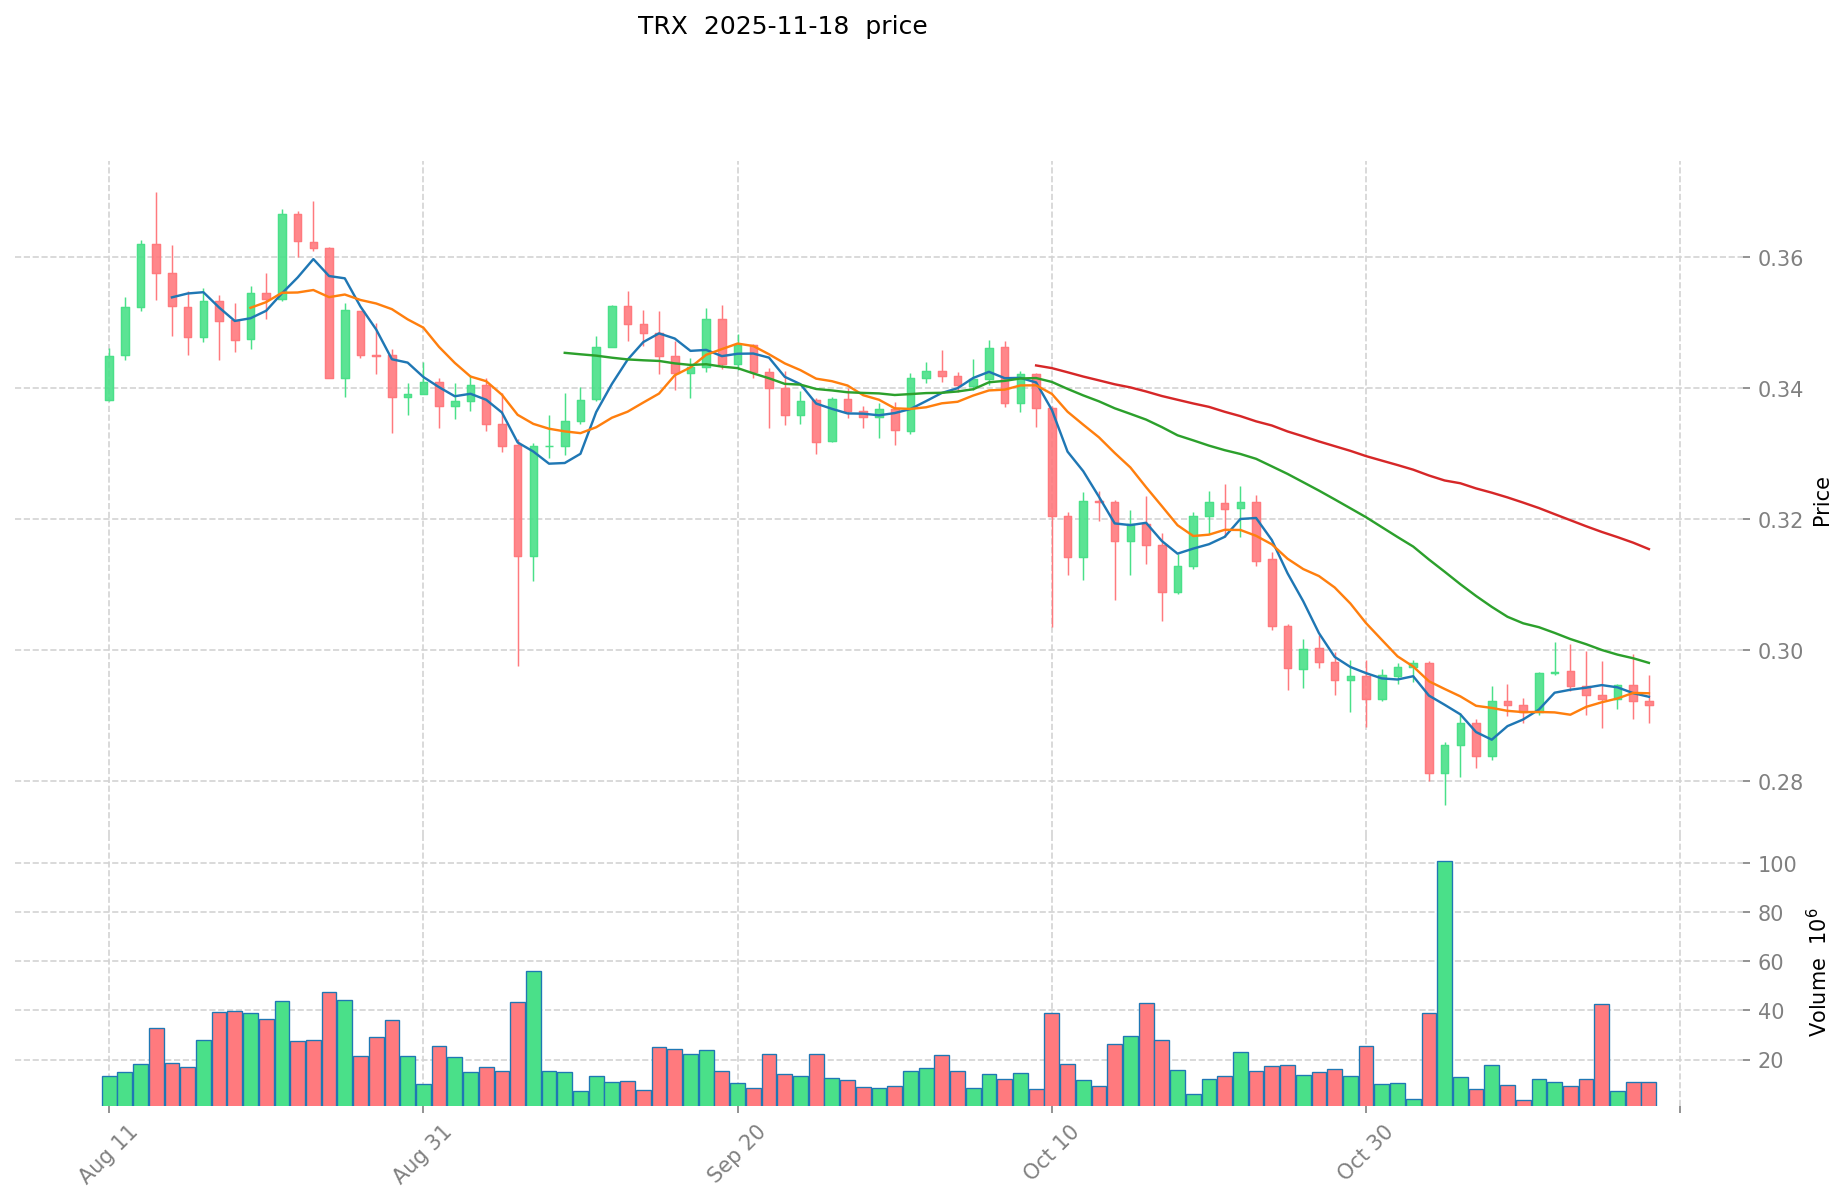
- Comparative analysis: In the recent market cycle, DYM dropped from its high of $8.7379 to a low of $0.0234, while TRX has shown more stability, maintaining a price above $0.28.
Current Market Situation (2025-11-19)
- DYM current price: $0.07975
- TRX current price: $0.29271
- 24-hour trading volume: DYM $84,244,891 vs TRX $3,914,508,082
- Market Sentiment Index (Fear & Greed Index): 11 (Extreme Fear)
Click to view real-time prices:
- View DYM current price Market Price
- View TRX current price Market Price
II. Core Factors Affecting DYM vs TRX Investment Value
Supply Mechanism Comparison (Tokenomics)
- DYM: Innovative RollApp development kit (RDK) serving as the core technological foundation for Dymension
- TRX: Value tied to Tron's decentralized ecosystem with price appreciation reflecting market performance
- 📌 Historical Pattern: Both tokens rely on technological innovation and ecosystem growth to drive price cycles.
Institutional Adoption and Market Applications
- Institutional Holdings: Limited information on institutional preference between these assets
- Enterprise Adoption: TRX shows integration within Tron's decentralized ecosystem
- Regulatory Attitudes: Regulatory positions vary by jurisdiction with no specific information available for direct comparison
Technology Development and Ecosystem Building
- DYM Technology: RollApp Development Kit (RDK), similar to Cosmos SDK, providing developers with powerful tools to accelerate application building
- TRX Technology: Focuses on open-source characteristics and decentralized management principles
- Ecosystem Comparison: Tron ecosystem has shown significant growth with TRX price appreciation driving ecosystem expansion
Macroeconomic Factors and Market Cycles
- Inflation Performance: No specific data on inflation resistance properties
- Monetary Policy Impact: Both cryptocurrencies subject to broader market dynamics
- Geopolitical Factors: Both assets operate within the global cryptocurrency market subject to varying cross-border transaction demands
III. 2025-2030 Price Prediction: DYM vs TRX
Short-term Prediction (2025)
- DYM: Conservative $0.0589928 - $0.07972 | Optimistic $0.07972 - $0.0980556
- TRX: Conservative $0.175782 - $0.29297 | Optimistic $0.29297 - $0.3779313
Mid-term Prediction (2027)
- DYM may enter a growth phase, with prices expected in the range of $0.05157714595 - $0.10784312335
- TRX may enter a bullish market, with prices expected in the range of $0.3382852079925 - $0.5665258302525
- Key drivers: Institutional capital inflow, ETF, ecosystem development
Long-term Prediction (2030)
- DYM: Base scenario $0.1299010861922 - $0.174067455497548 | Optimistic scenario $0.174067455497548+
- TRX: Base scenario $0.581244497380491 - $0.784680071463663 | Optimistic scenario $0.784680071463663+
Disclaimer: This analysis is based on historical data and market projections. Cryptocurrency markets are highly volatile and unpredictable. This information should not be considered as financial advice. Always conduct your own research before making investment decisions.
DYM:
| 年份 | 预测最高价 | 预测平均价格 | 预测最低价 | 涨跌幅 |
|---|---|---|---|---|
| 2025 | 0.0980556 | 0.07972 | 0.0589928 | 0 |
| 2026 | 0.098665458 | 0.0888878 | 0.046221656 | 11 |
| 2027 | 0.10784312335 | 0.093776629 | 0.05157714595 | 17 |
| 2028 | 0.15020671550075 | 0.100809876175 | 0.06754261703725 | 26 |
| 2029 | 0.134293876546526 | 0.125508295837875 | 0.077815143419482 | 57 |
| 2030 | 0.174067455497548 | 0.1299010861922 | 0.118209988434902 | 62 |
TRX:
| 年份 | 预测最高价 | 预测平均价格 | 预测最低价 | 涨跌幅 |
|---|---|---|---|---|
| 2025 | 0.3779313 | 0.29297 | 0.175782 | 0 |
| 2026 | 0.4796944295 | 0.33545065 | 0.2247519355 | 14 |
| 2027 | 0.5665258302525 | 0.40757253975 | 0.3382852079925 | 39 |
| 2028 | 0.56497705460145 | 0.48704918500125 | 0.25326557620065 | 66 |
| 2029 | 0.636475874959633 | 0.52601311980135 | 0.326128134276837 | 79 |
| 2030 | 0.784680071463663 | 0.581244497380491 | 0.523120047642442 | 98 |
IV. Investment Strategy Comparison: DYM vs TRX
Long-term vs Short-term Investment Strategies
- DYM: Suitable for investors focused on ecosystem potential and technological innovation
- TRX: Suitable for investors seeking stability and established ecosystem integration
Risk Management and Asset Allocation
- Conservative investors: DYM: 20% vs TRX: 80%
- Aggressive investors: DYM: 60% vs TRX: 40%
- Hedging tools: Stablecoin allocation, options, cross-currency portfolios
V. Potential Risk Comparison
Market Risks
- DYM: Higher volatility due to newer market entry and smaller market cap
- TRX: Susceptible to broader cryptocurrency market trends and competitive pressures
Technical Risks
- DYM: Scalability, network stability, and adoption of RollApp technology
- TRX: Network congestion, potential security vulnerabilities in smart contracts
Regulatory Risks
- Global regulatory policies may impact both assets differently, with newer technologies potentially facing increased scrutiny
VI. Conclusion: Which Is the Better Buy?
📌 Investment Value Summary:
- DYM advantages: Innovative RollApp technology, potential for rapid ecosystem growth
- TRX advantages: Established ecosystem, higher trading volume, relative price stability
✅ Investment Advice:
- New investors: Consider a smaller allocation to DYM for potential growth, larger allocation to TRX for stability
- Experienced investors: Balance portfolio with both assets, adjusting based on risk tolerance
- Institutional investors: Evaluate DYM for long-term potential, TRX for current ecosystem integration
⚠️ Risk Warning: The cryptocurrency market is highly volatile. This article does not constitute investment advice. None
VII. FAQ
Q1: What are the main differences between DYM and TRX? A: DYM is a newer cryptocurrency focused on RollApp development, while TRX is an established platform for decentralized content entertainment. DYM has a smaller market cap and higher volatility, whereas TRX has a larger trading volume and more stable price.
Q2: Which cryptocurrency has shown better price performance recently? A: TRX has shown more price stability recently, maintaining a price above $0.28. DYM, being newer and more volatile, has experienced significant price fluctuations since its all-time high.
Q3: How do the supply mechanisms of DYM and TRX compare? A: DYM's supply is tied to its RollApp Development Kit (RDK), which serves as the core technological foundation. TRX's value is linked to Tron's decentralized ecosystem, with price appreciation reflecting market performance.
Q4: What are the key technological aspects of DYM and TRX? A: DYM utilizes the RollApp Development Kit (RDK), similar to Cosmos SDK, for accelerating application building. TRX focuses on open-source characteristics and decentralized management principles within the Tron ecosystem.
Q5: How do the long-term price predictions for DYM and TRX compare? A: By 2030, DYM's base scenario price range is predicted to be $0.1299010861922 - $0.174067455497548, while TRX's base scenario range is $0.581244497380491 - $0.784680071463663. Both have potential for higher prices in optimistic scenarios.
Q6: What investment strategies are recommended for DYM and TRX? A: For conservative investors, a 20% DYM to 80% TRX allocation is suggested. Aggressive investors might consider 60% DYM to 40% TRX. It's recommended to balance your portfolio based on your risk tolerance and investment goals.
Q7: What are the main risks associated with investing in DYM and TRX? A: DYM faces higher volatility and potential technical risks due to its newer technology. TRX is susceptible to broader market trends and potential network congestion. Both face regulatory risks, with DYM potentially facing more scrutiny as a newer asset.
Share
Content
Introduction: DYM vs TRX Investment Comparison
I. Price History Comparison and Current Market Situation
II. Core Factors Affecting DYM vs TRX Investment Value
III. 2025-2030 Price Prediction: DYM vs TRX
IV. Investment Strategy Comparison: DYM vs TRX
V. Potential Risk Comparison
VI. Conclusion: Which Is the Better Buy?
VII. FAQ

