ELA vs KAVA: Comparing Two Blockchain Platforms for Decentralized Applications
Introduction: ELA vs KAVA Investment Comparison
In the cryptocurrency market, the comparison between Elastos (ELA) and Kava (KAVA) has always been an unavoidable topic for investors. The two not only have significant differences in market cap ranking, application scenarios, and price performance, but also represent different positioning in the crypto asset space.
Elastos (ELA): Since its launch in 2018, it has gained market recognition for its positioning as a next-generation Web 3.0 platform aimed at building a decentralized intelligent World Wide Web (SmartWeb) based on blockchain technology.
Kava (KAVA): Introduced in 2019, it has been hailed as a cross-chain decentralized finance platform, providing collateralized loans and stablecoin services for mainstream digital assets.
This article will comprehensively analyze the investment value comparison between ELA and KAVA, focusing on historical price trends, supply mechanisms, institutional adoption, technological ecosystems, and future predictions, attempting to answer the question most concerning to investors:
"Which is the better buy right now?"
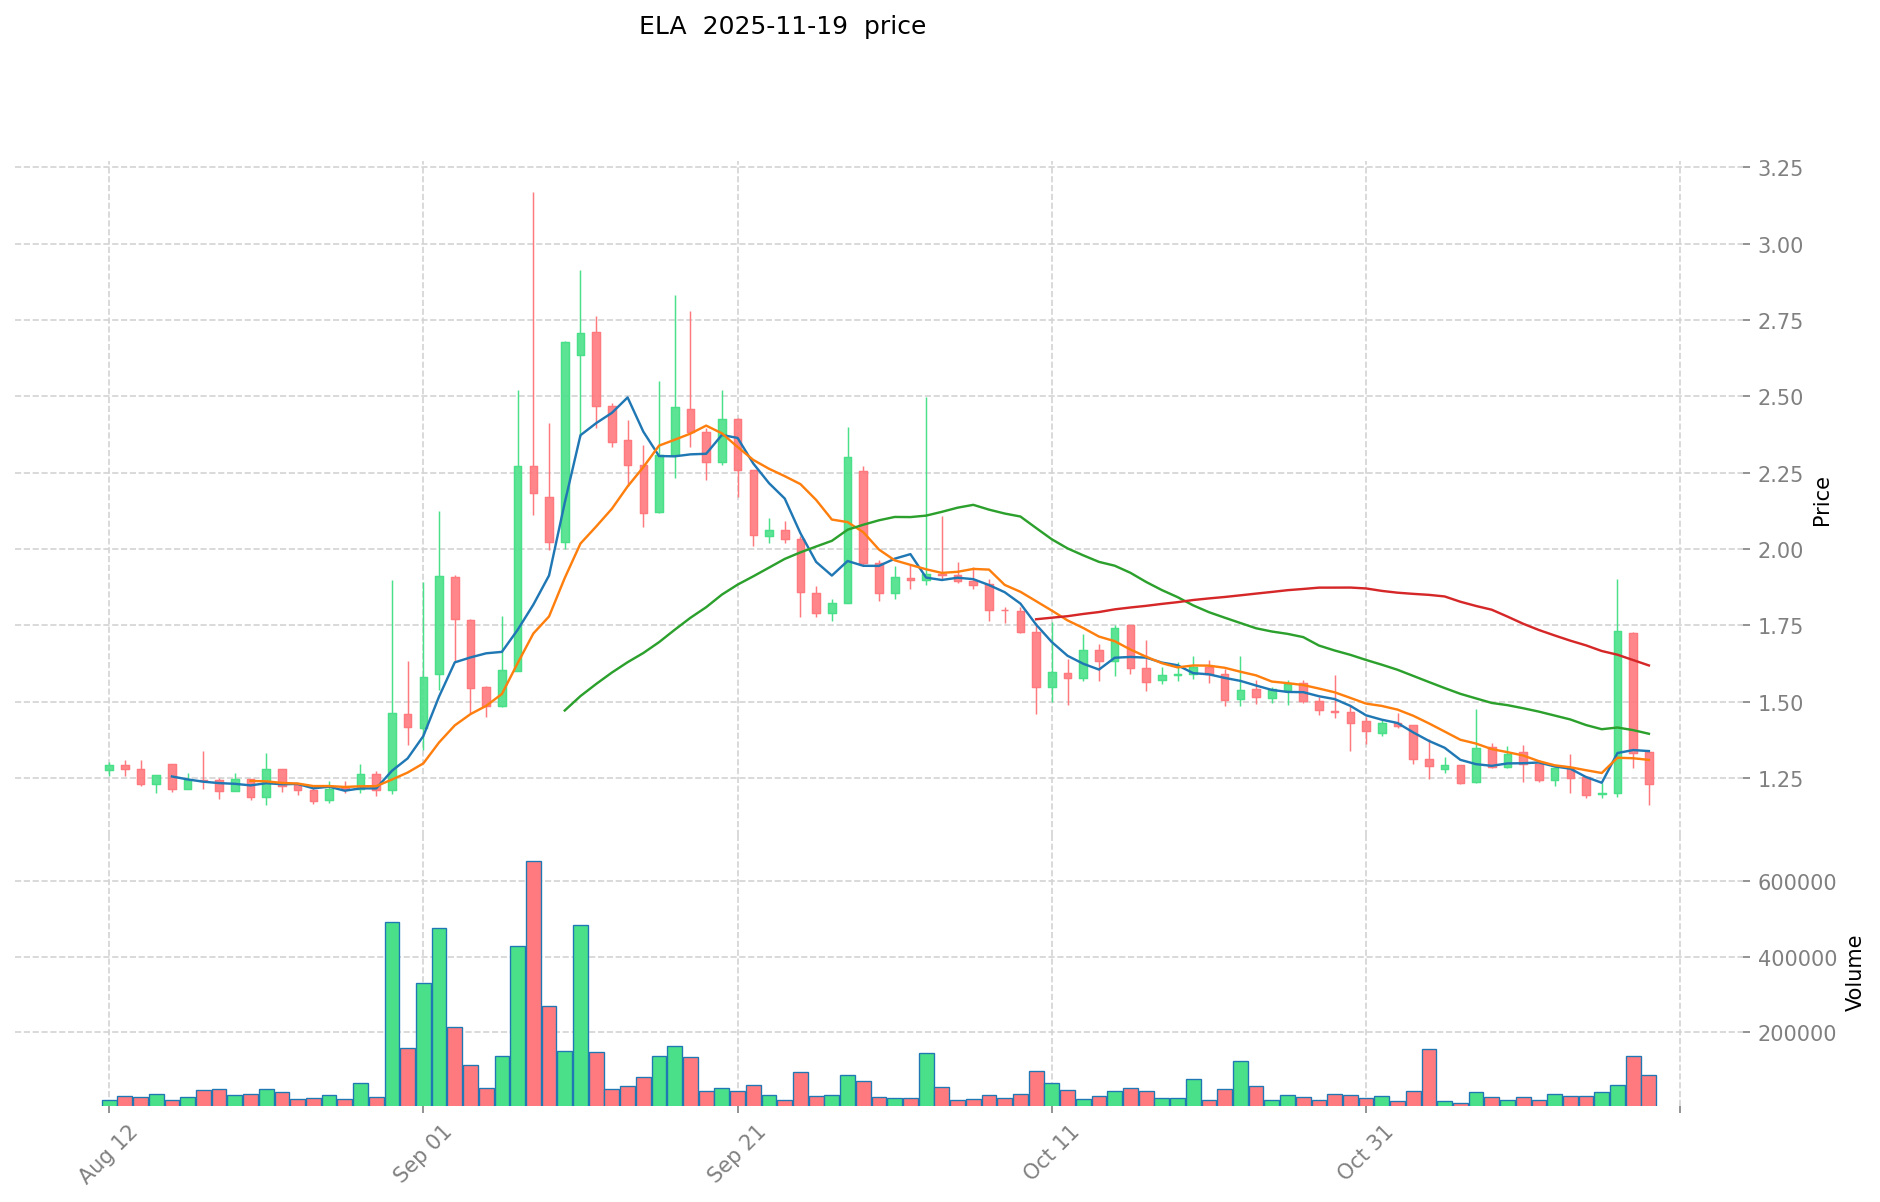
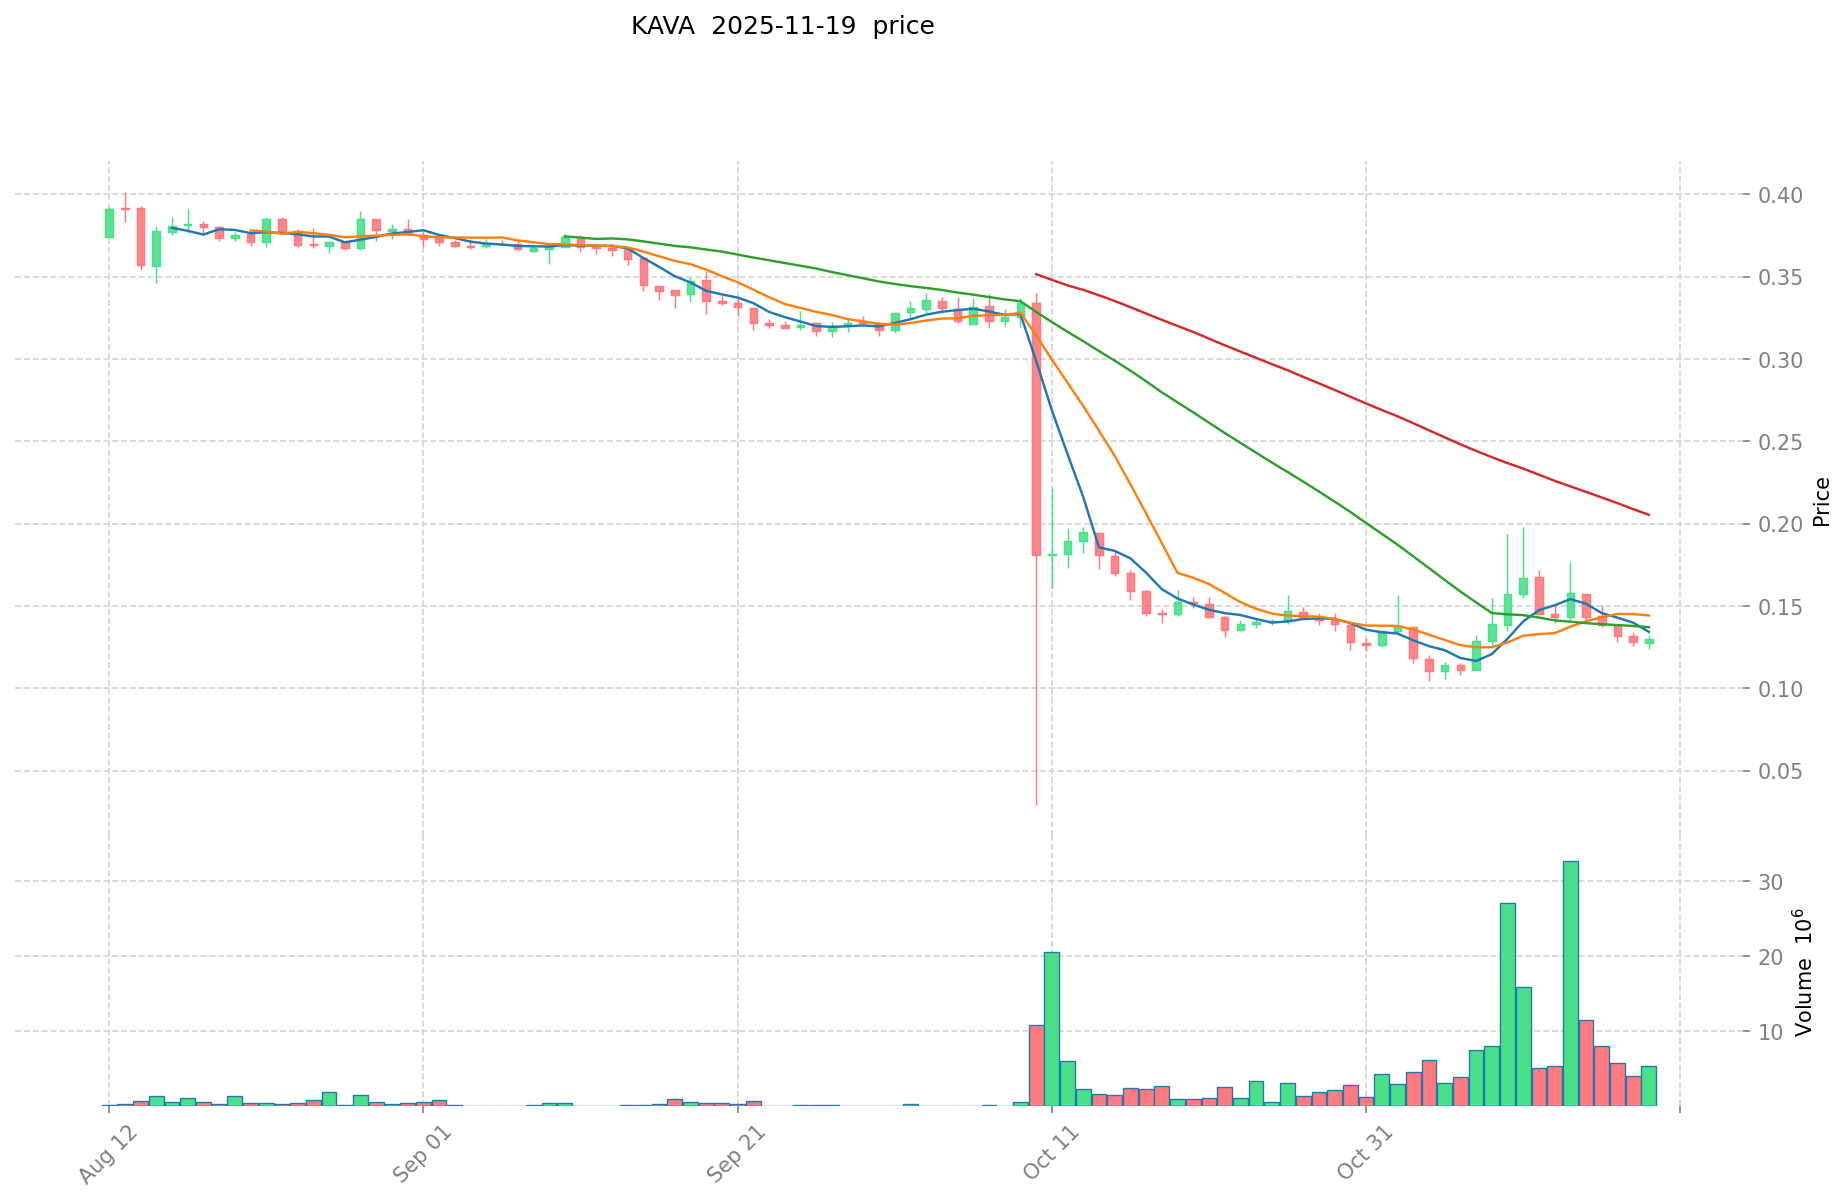
I. Price History Comparison and Current Market Status
ELA (Coin A) and KAVA (Coin B) Historical Price Trends
- 2018: ELA reached its all-time high of $89.14 on February 24, 2018.
- 2021: KAVA hit its all-time high of $9.12 on August 30, 2021.
- Comparative analysis: ELA has fallen from its peak of $89.14 to a current price of $1.2089, while KAVA has declined from its high of $9.12 to $0.12977.
Current Market Situation (2025-11-19)
- ELA current price: $1.2089
- KAVA current price: $0.12977
- 24-hour trading volume: ELA $98,809.69 vs KAVA $738,879.44
- Market Sentiment Index (Fear & Greed Index): 15 (Extreme Fear)
Click to view real-time prices:
- View ELA current price Market Price
- View KAVA current price Market Price
II. Core Factors Influencing the Investment Value of ELA vs KAVA
Supply Mechanism Comparison (Tokenomics)
-
ELA: Fixed supply mechanism with a maximum cap of 28.6 million tokens, creating scarcity in the long term
-
KAVA: Inflationary model with block rewards that are distributed to validators and delegators, balanced by token burning mechanisms
-
📌 Historical Pattern: Limited supply tokens like ELA tend to appreciate more during bull markets due to scarcity, while KAVA's more complex tokenomics with staking rewards can create consistent demand during various market phases.
Institutional Adoption and Market Applications
- Institutional Holdings: KAVA appears to have stronger institutional interest due to its DeFi focus and cross-chain capabilities
- Enterprise Adoption: KAVA has gained traction in cross-chain DeFi applications, while ELA focuses on digital identity and data ownership applications
- Regulatory Attitudes: Both projects face varying regulatory frameworks across jurisdictions, with neither having significant regulatory advantages or disadvantages
Technical Development and Ecosystem Building
- ELA Technical Upgrades: Development of Elastos SmartWeb incorporating decentralized identity solutions and data ownership features
- KAVA Technical Development: Enhanced cross-chain capabilities with Cosmos SDK integration and expansion of the Kava Lending platform
- Ecosystem Comparison: KAVA has stronger DeFi applications with lending and yield products, while ELA offers a more comprehensive data ownership and digital identity ecosystem
Macroeconomic Factors and Market Cycles
- Performance in Inflationary Environments: Both tokens have moderate inflation hedging properties but neither has definitively proven superior protection
- Macroeconomic Monetary Policy: Both are influenced by broader crypto market reactions to interest rates and dollar strength
- Geopolitical Factors: ELA's focus on data sovereignty may become more relevant amid increasing global data privacy concerns
III. 2025-2030 Price Prediction: ELA vs KAVA
Short-term Prediction (2025)
- ELA: Conservative $0.83 - $1.22 | Optimistic $1.22 - $1.74
- KAVA: Conservative $0.11 - $0.13 | Optimistic $0.13 - $0.16
Mid-term Prediction (2027)
- ELA may enter a growth phase, with an estimated price range of $1.23 - $1.79
- KAVA may enter a consolidation phase, with an estimated price range of $0.14 - $0.20
- Key drivers: Institutional capital inflow, ETF, ecosystem development
Long-term Prediction (2030)
- ELA: Base scenario $2.16 - $2.30 | Optimistic scenario $2.30 - $2.60
- KAVA: Base scenario $0.12 - $0.21 | Optimistic scenario $0.21 - $0.31
Disclaimer
ELA:
| 年份 | 预测最高价 | 预测平均价格 | 预测最低价 | 涨跌幅 |
|---|---|---|---|---|
| 2025 | 1.738308 | 1.2156 | 0.826608 | 0 |
| 2026 | 1.93480974 | 1.476954 | 1.13725458 | 22 |
| 2027 | 1.7911759635 | 1.70588187 | 1.2282349464 | 41 |
| 2028 | 2.1506905676025 | 1.74852891675 | 1.25894082006 | 44 |
| 2029 | 2.6514692493597 | 1.94960974217625 | 1.598679988584525 | 61 |
| 2030 | 2.599609630217811 | 2.300539495767975 | 2.162507126021896 | 90 |
KAVA:
| 年份 | 预测最高价 | 预测平均价格 | 预测最低价 | 涨跌幅 |
|---|---|---|---|---|
| 2025 | 0.15534 | 0.12945 | 0.1126215 | 0 |
| 2026 | 0.1537866 | 0.142395 | 0.113916 | 9 |
| 2027 | 0.198441672 | 0.1480908 | 0.142167168 | 14 |
| 2028 | 0.20965214556 | 0.173266236 | 0.10569240396 | 33 |
| 2029 | 0.2259218451204 | 0.19145919078 | 0.1206192901914 | 47 |
| 2030 | 0.306775061386794 | 0.2086905179502 | 0.118953595231614 | 61 |
IV. Investment Strategy Comparison: ELA vs KAVA
Long-term vs Short-term Investment Strategies
- ELA: Suitable for investors focusing on Web 3.0 potential and digital identity solutions
- KAVA: Suitable for investors interested in DeFi applications and cross-chain capabilities
Risk Management and Asset Allocation
- Conservative investors: ELA: 30% vs KAVA: 70%
- Aggressive investors: ELA: 60% vs KAVA: 40%
- Hedging tools: Stablecoin allocation, options, cross-currency portfolios
V. Potential Risk Comparison
Market Risk
- ELA: Vulnerability to overall crypto market sentiment and Web 3.0 sector performance
- KAVA: Exposure to DeFi market fluctuations and cross-chain competition
Technical Risk
- ELA: Scalability, network stability
- KAVA: Smart contract vulnerabilities, cross-chain security issues
Regulatory Risk
- Global regulatory policies may have different impacts on both tokens, with DeFi platforms like KAVA potentially facing more scrutiny
VI. Conclusion: Which Is the Better Buy?
📌 Investment Value Summary:
- ELA advantages: Fixed supply, Web 3.0 focus, digital identity solutions
- KAVA advantages: DeFi applications, cross-chain capabilities, staking rewards
✅ Investment Advice:
- Novice investors: Consider a balanced approach with a slight preference for KAVA due to its DeFi applications
- Experienced investors: Explore a diversified portfolio including both ELA and KAVA based on risk tolerance
- Institutional investors: Assess KAVA for DeFi exposure and ELA for long-term Web 3.0 potential
⚠️ Risk Warning: The cryptocurrency market is highly volatile, and this article does not constitute investment advice. None
VII. FAQ
Q1: What are the main differences between ELA and KAVA? A: ELA is positioned as a Web 3.0 platform focusing on digital identity and data ownership, while KAVA is a cross-chain DeFi platform offering collateralized loans and stablecoin services.
Q2: Which token has performed better historically? A: ELA reached its all-time high of $89.14 in 2018, while KAVA hit its peak of $9.12 in 2021. Both have since declined, with ELA currently at $1.2089 and KAVA at $0.12977.
Q3: How do their supply mechanisms differ? A: ELA has a fixed supply cap of 28.6 million tokens, creating long-term scarcity. KAVA has an inflationary model with block rewards, balanced by token burning mechanisms.
Q4: Which token is more suitable for long-term investment? A: ELA may be more suitable for long-term investors focusing on Web 3.0 potential and digital identity solutions, while KAVA might appeal to those interested in DeFi applications and cross-chain capabilities.
Q5: What are the main risks associated with investing in ELA and KAVA? A: Both face market risks tied to overall crypto sentiment. ELA has technical risks related to scalability and network stability, while KAVA faces smart contract vulnerabilities and cross-chain security issues. Regulatory risks may impact both, with potentially more scrutiny on DeFi platforms like KAVA.
Q6: How do institutional adoptions compare between ELA and KAVA? A: KAVA appears to have stronger institutional interest due to its DeFi focus and cross-chain capabilities, while ELA has gained traction in digital identity and data ownership applications.
Q7: What are the price predictions for ELA and KAVA by 2030? A: For ELA, the base scenario predicts $2.16 - $2.30, with an optimistic scenario of $2.30 - $2.60. For KAVA, the base scenario predicts $0.12 - $0.21, with an optimistic scenario of $0.21 - $0.31.
Share
Content
Introduction: ELA vs KAVA Investment Comparison
I. Price History Comparison and Current Market Status
II. Core Factors Influencing the Investment Value of ELA vs KAVA
III. 2025-2030 Price Prediction: ELA vs KAVA
IV. Investment Strategy Comparison: ELA vs KAVA
V. Potential Risk Comparison
VI. Conclusion: Which Is the Better Buy?
VII. FAQ

