INIT vs IMX: Comparing Performance and Efficiency in Embedded Systems
Introduction: INIT vs IMX Investment Comparison
In the cryptocurrency market, the comparison between Initia (INIT) and Immutable (IMX) remains a crucial topic for investors. The two not only differ significantly in market cap ranking, application scenarios, and price performance but also represent different positions in the crypto asset landscape.
Initia (INIT): Launched as an L1 blockchain that unites appchains to unlock their full value through interwoven infrastructure and aligned economics.
Immutable (IMX): Established as a second-layer (L2) scaling solution for NFTs on Ethereum, offering instant transactions, large-scale scalability, and zero gas fees for minting and trading.
This article will comprehensively analyze the investment value comparison between INIT and IMX, focusing on historical price trends, supply mechanisms, institutional adoption, technological ecosystems, and future predictions, aiming to answer the question most pressing to investors:
"Which is the better buy right now?"
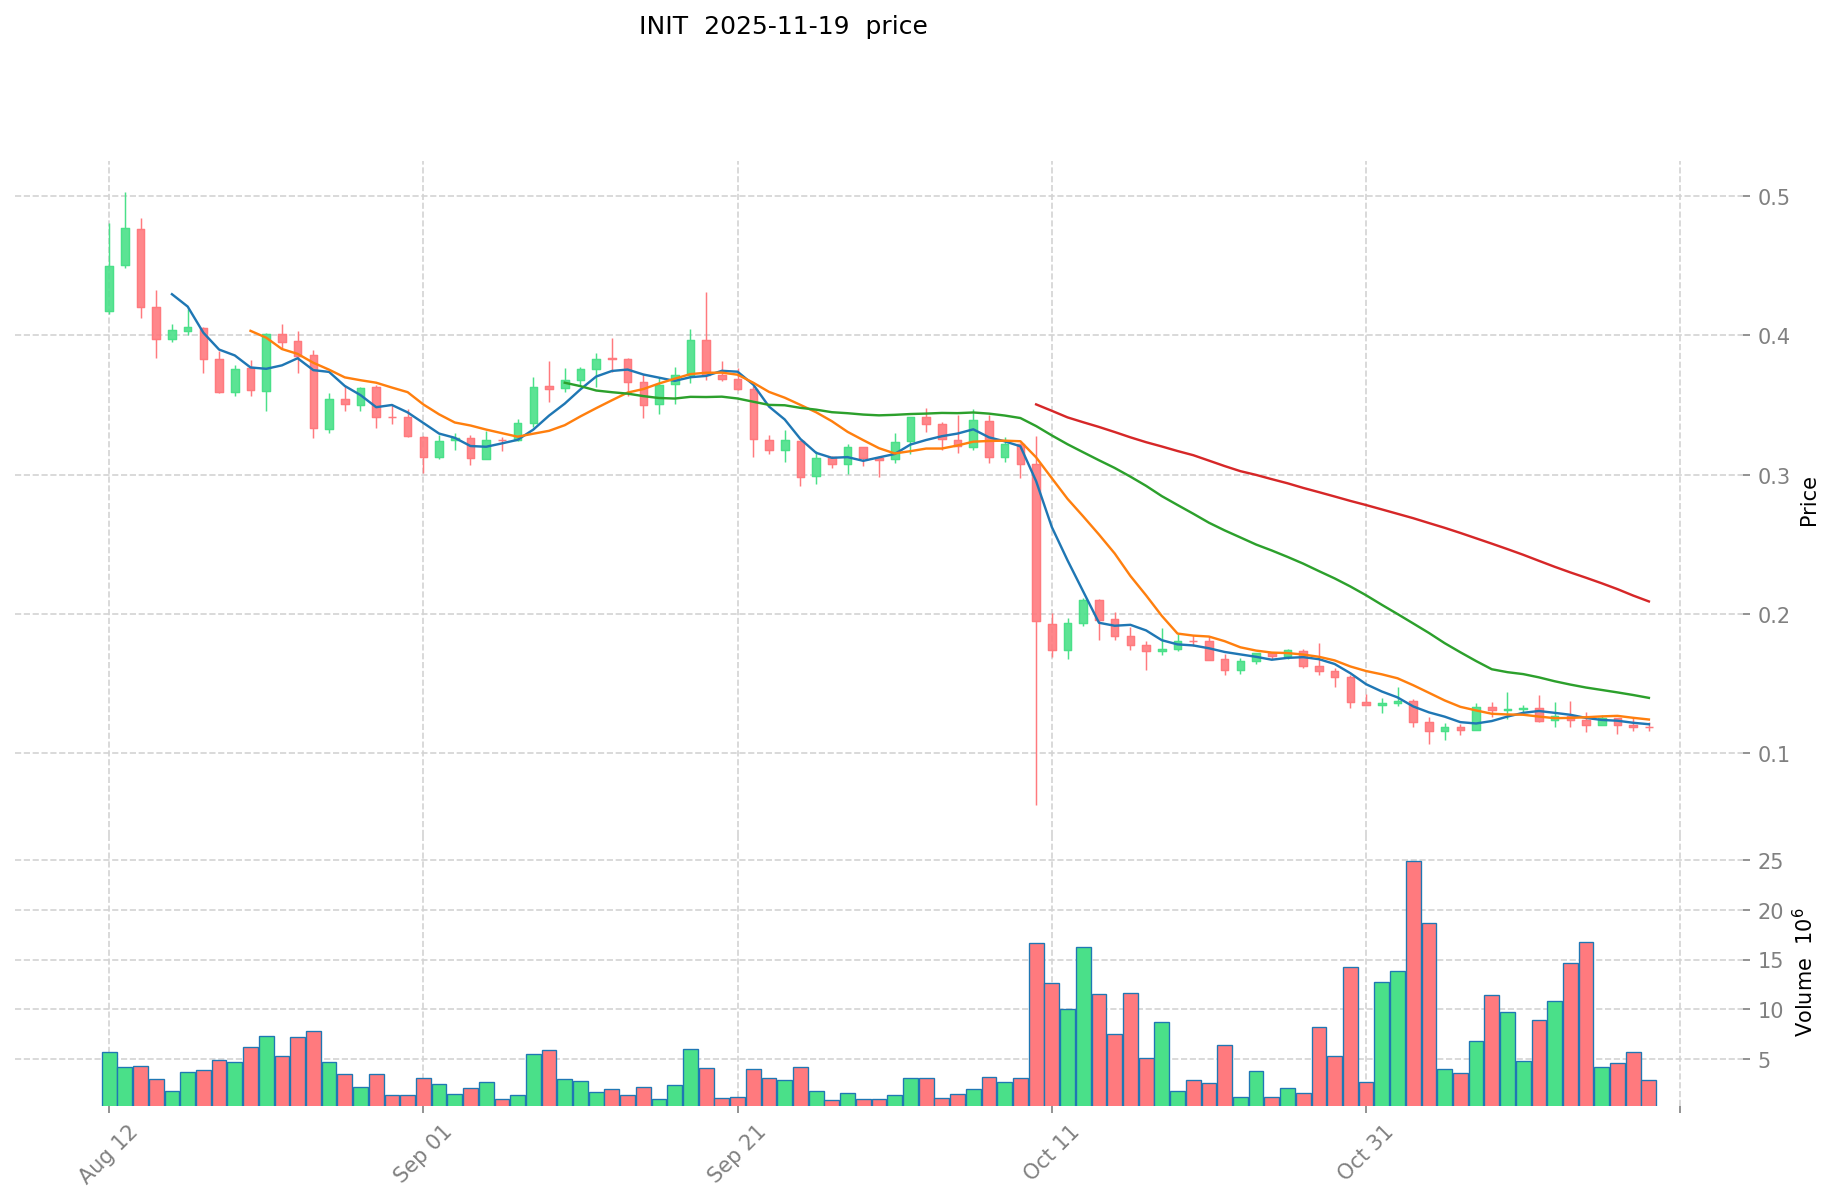
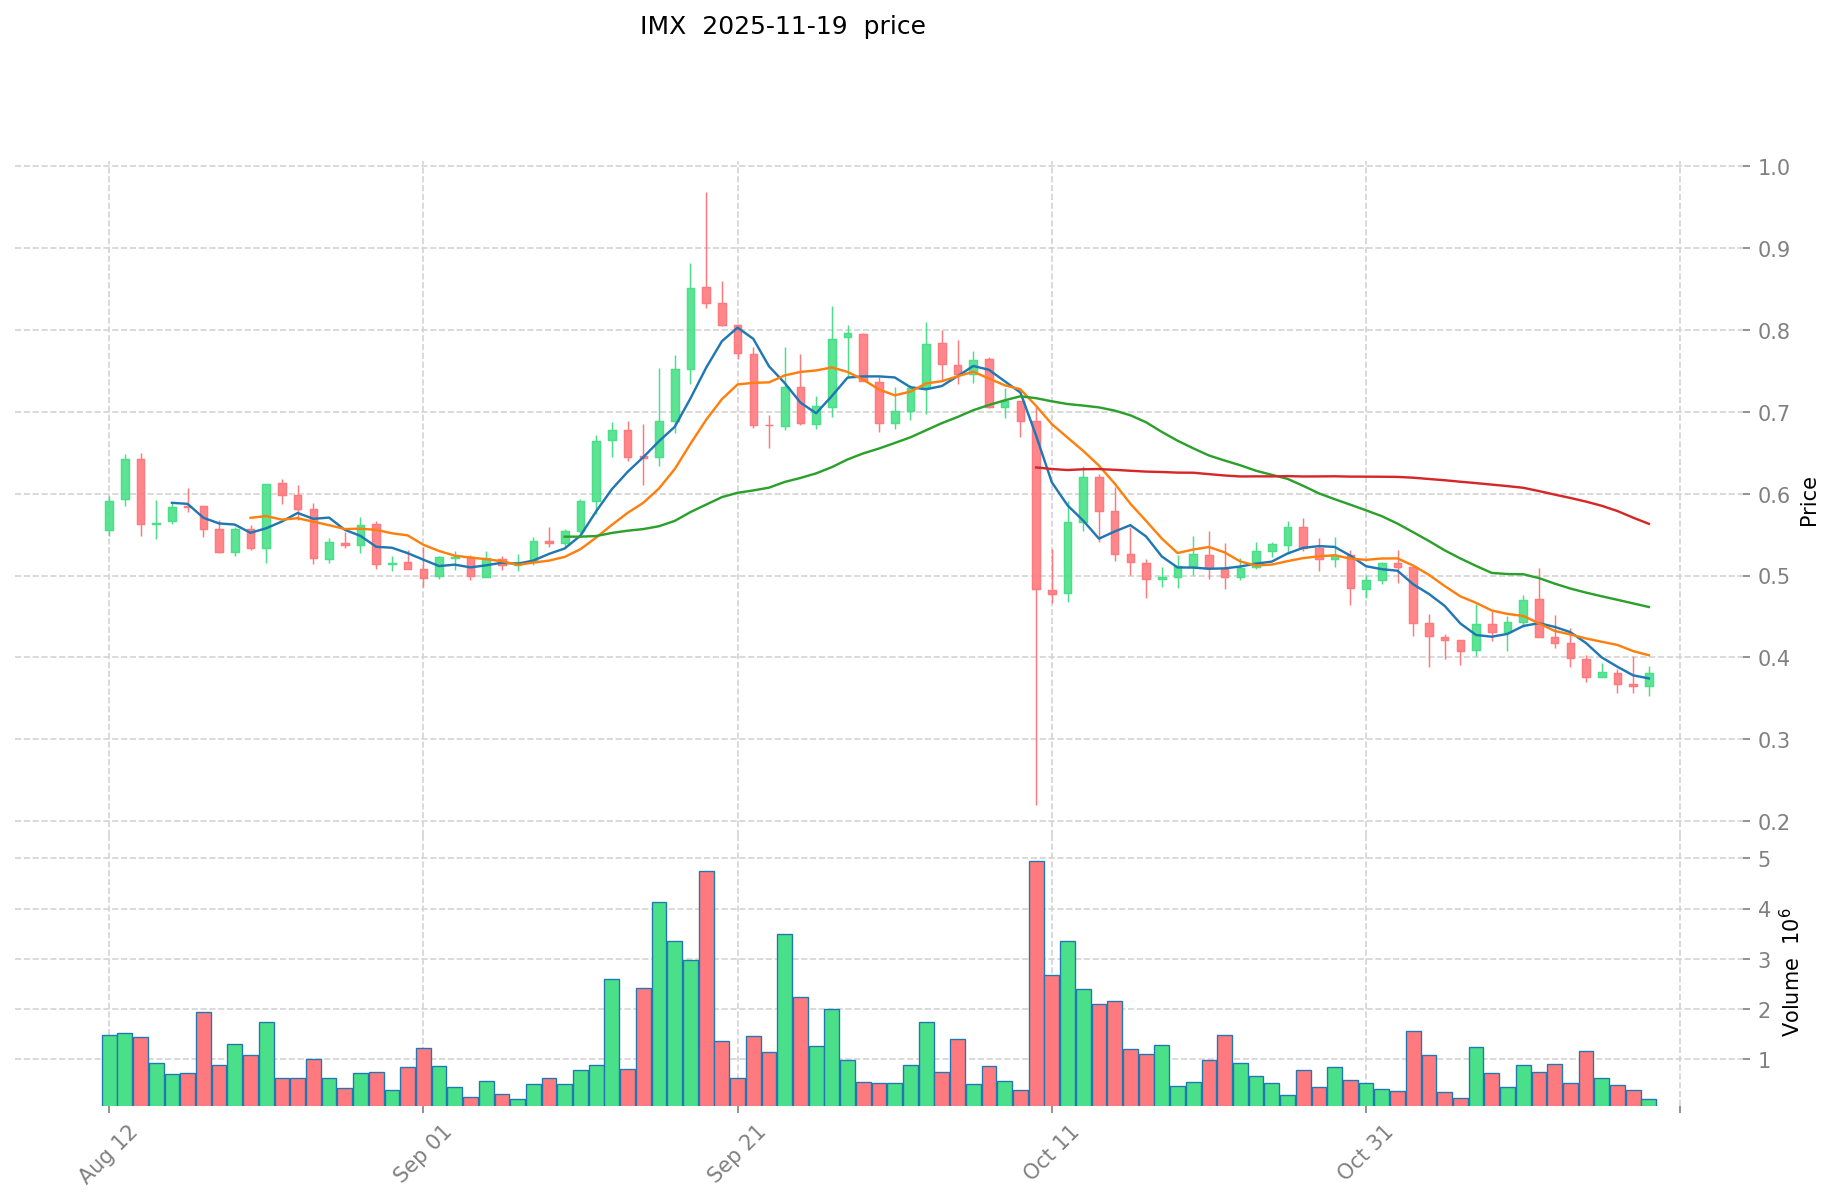
I. Price History Comparison and Current Market Status
INIT and IMX Historical Price Trends
- 2025: INIT launched its mainnet, causing price to surge.
- 2025: IMX experienced significant volatility due to market conditions.
- Comparative analysis: During the recent market cycle, INIT dropped from its all-time high of $1.446 to a low of $0.0626, while IMX declined from $9.52 to $0.334412.
Current Market Situation (2025-11-20)
- INIT current price: $0.1178
- IMX current price: $0.3631
- 24-hour trading volume: INIT $484,840 vs IMX $267,446
- Crypto Fear & Greed Index: 15 (Extreme Fear)
Click to view real-time prices:
- Check INIT current price Market Price
- Check IMX current price Market Price
II. Core Factors Affecting INIT vs IMX Investment Value
Supply Mechanism Comparison (Tokenomics)
- IMX: Token serves as core fuel for an innovative platform, designed to facilitate efficient and transparent asset transactions
- INIT: Recently listed on Upbit with BTC and USDT trading pairs, showing market integration
- 📌 Historical pattern: Supply mechanisms drive price cyclical changes in both tokens.
Institutional Adoption and Market Applications
- Institutional holdings: Limited data available on institutional preference between INIT and IMX
- Enterprise adoption: Both tokens aim to revolutionize business models through decentralized networks
- Regulatory attitudes: Varying regulatory approaches across jurisdictions affect both tokens
Technical Development and Ecosystem Building
- IMX technical upgrades: Focuses on solving industry-specific challenges through innovative platform features
- INIT technical development: Recent exchange listing suggests growing market recognition
- Ecosystem comparison: Both aim to maximize network value for all participants through decentralized applications
Macroeconomic Factors and Market Cycles
- Performance in inflationary environments: Insufficient data to determine which has better anti-inflationary properties
- Macroeconomic monetary policy: ETF inflows (like recent $213M into Ethereum ETFs) potentially influence broader crypto market including both tokens
- Geopolitical factors: Cross-border transaction demands affect both tokens in the global market
III. 2025-2030 Price Prediction: INIT vs IMX
Short-term Prediction (2025)
- INIT: Conservative $0.0767-$0.118 | Optimistic $0.118-$0.1593
- IMX: Conservative $0.30668-$0.3608 | Optimistic $0.3608-$0.494296
Mid-term Prediction (2027)
- INIT may enter a growth phase, with prices expected in the range of $0.12129102-$0.2274206625
- IMX may enter a consolidation phase, with prices expected in the range of $0.4363554888-$0.6129755676
- Key drivers: Institutional capital inflow, ETF, ecosystem development
Long-term Prediction (2030)
- INIT: Base scenario $0.226542566053125-$0.3262212951165 | Optimistic scenario $0.3262212951165+
- IMX: Base scenario $0.74370585389661-$0.803202322208338 | Optimistic scenario $0.803202322208338+
Disclaimer: The above predictions are based on historical data and market analysis. Cryptocurrency markets are highly volatile and subject to various unpredictable factors. These projections should not be considered as financial advice or guarantees of future performance. Always conduct your own research and consult with financial professionals before making investment decisions.
INIT:
| 年份 | 预测最高价 | 预测平均价格 | 预测最低价 | 涨跌幅 |
|---|---|---|---|---|
| 2025 | 0.1593 | 0.118 | 0.0767 | 0 |
| 2026 | 0.1982695 | 0.13865 | 0.097055 | 17 |
| 2027 | 0.2274206625 | 0.16845975 | 0.12129102 | 43 |
| 2028 | 0.217734226875 | 0.19794020625 | 0.126681732 | 68 |
| 2029 | 0.24524791554375 | 0.2078372165625 | 0.116388841275 | 76 |
| 2030 | 0.3262212951165 | 0.226542566053125 | 0.158579796237187 | 92 |
IMX:
| 年份 | 预测最高价 | 预测平均价格 | 预测最低价 | 涨跌幅 |
|---|---|---|---|---|
| 2025 | 0.494296 | 0.3608 | 0.30668 | 0 |
| 2026 | 0.61139364 | 0.427548 | 0.26935524 | 17 |
| 2027 | 0.6129755676 | 0.51947082 | 0.4363554888 | 43 |
| 2028 | 0.798374703258 | 0.5662231938 | 0.356720612094 | 55 |
| 2029 | 0.80511275926422 | 0.682298948529 | 0.62771503264668 | 87 |
| 2030 | 0.803202322208338 | 0.74370585389661 | 0.624712917273152 | 104 |
IV. Investment Strategy Comparison: INIT vs IMX
Long-term vs Short-term Investment Strategies
- INIT: Suitable for investors focused on ecosystem potential and L1 blockchain growth
- IMX: Suitable for investors interested in NFT market expansion and L2 scaling solutions
Risk Management and Asset Allocation
- Conservative investors: INIT: 30% vs IMX: 70%
- Aggressive investors: INIT: 60% vs IMX: 40%
- Hedging tools: Stablecoin allocation, options, cross-currency portfolios
V. Potential Risk Comparison
Market Risks
- INIT: Higher volatility due to recent launch and lower market cap
- IMX: Exposure to NFT market fluctuations and Ethereum ecosystem dependencies
Technical Risks
- INIT: Scalability, network stability, and potential vulnerabilities in new blockchain
- IMX: Reliance on Ethereum's development, L2 scaling challenges
Regulatory Risks
- Global regulatory policies may impact both tokens differently, with potential scrutiny on L1 and L2 solutions
VI. Conclusion: Which Is the Better Buy?
📌 Investment Value Summary:
- INIT advantages: New L1 blockchain with potential for rapid ecosystem growth
- IMX advantages: Established presence in the NFT market, zero gas fees for transactions
✅ Investment Advice:
- New investors: Consider a balanced approach with a slight preference for IMX due to its more established market presence
- Experienced investors: Explore INIT for higher potential returns, while maintaining a position in IMX for NFT exposure
- Institutional investors: Diversify between both, with allocation based on risk tolerance and market outlook
⚠️ Risk Warning: The cryptocurrency market is highly volatile, and this article does not constitute investment advice. None
VII. FAQ
Q1: What are the main differences between INIT and IMX? A: INIT is an L1 blockchain focusing on uniting appchains, while IMX is an L2 scaling solution for NFTs on Ethereum. INIT is newer with potential for rapid ecosystem growth, while IMX has an established presence in the NFT market and offers zero gas fees for transactions.
Q2: Which token has performed better historically? A: Based on the provided data, IMX has shown a wider price range, dropping from $9.52 to $0.334412, while INIT dropped from $1.446 to $0.0626. However, past performance doesn't guarantee future results.
Q3: What are the current prices and trading volumes for INIT and IMX? A: As of 2025-11-20, INIT's price is $0.1178 with a 24-hour trading volume of $484,840. IMX's price is $0.3631 with a 24-hour trading volume of $267,446.
Q4: How do the long-term price predictions for INIT and IMX compare? A: For 2030, INIT's base scenario price range is $0.226542566053125-$0.3262212951165, while IMX's is $0.74370585389661-$0.803202322208338. Both have potential for growth, with IMX showing a higher predicted price range.
Q5: What are the main risks associated with investing in INIT and IMX? A: INIT faces higher volatility due to its recent launch and lower market cap, along with potential technical risks as a new blockchain. IMX is exposed to NFT market fluctuations and depends on Ethereum's ecosystem development. Both face regulatory risks that may impact them differently.
Q6: How should investors allocate their assets between INIT and IMX? A: Conservative investors might consider allocating 30% to INIT and 70% to IMX, while aggressive investors might allocate 60% to INIT and 40% to IMX. However, individual allocation should be based on personal risk tolerance and market outlook.
Q7: Which token is considered the better buy for different types of investors? A: New investors might prefer a balanced approach with a slight preference for IMX due to its established market presence. Experienced investors could explore INIT for higher potential returns while maintaining a position in IMX for NFT exposure. Institutional investors should consider diversifying between both based on their risk tolerance and market outlook.
Share
Content
Introduction: INIT vs IMX Investment Comparison
I. Price History Comparison and Current Market Status
II. Core Factors Affecting INIT vs IMX Investment Value
III. 2025-2030 Price Prediction: INIT vs IMX
IV. Investment Strategy Comparison: INIT vs IMX
V. Potential Risk Comparison
VI. Conclusion: Which Is the Better Buy?
VII. FAQ

