MAV vs AAVE: Comparing Two Popular DeFi Lending Protocols
Introduction: Investment Comparison of MAV vs AAVE
In the cryptocurrency market, the comparison between Maverick (MAV) vs AAVE (AAVE) has always been a topic that investors cannot avoid. The two not only have significant differences in market cap ranking, application scenarios, and price performance, but also represent different positioning in the crypto asset space.
Maverick (MAV): Since its launch in 2023, it has gained market recognition for its innovative automated market maker (AMM) infrastructure in decentralized finance.
AAVE (AAVE): Launched in 2020, it has been hailed as a leading decentralized lending protocol, providing deposit and lending services to users.
This article will comprehensively analyze the investment value comparison between MAV and AAVE, focusing on historical price trends, supply mechanisms, institutional adoption, technical ecosystems, and future predictions, and attempt to answer the question that investors are most concerned about:
"Which is the better buy right now?" I. Price History Comparison and Current Market Status
MAV and AAVE Historical Price Trends
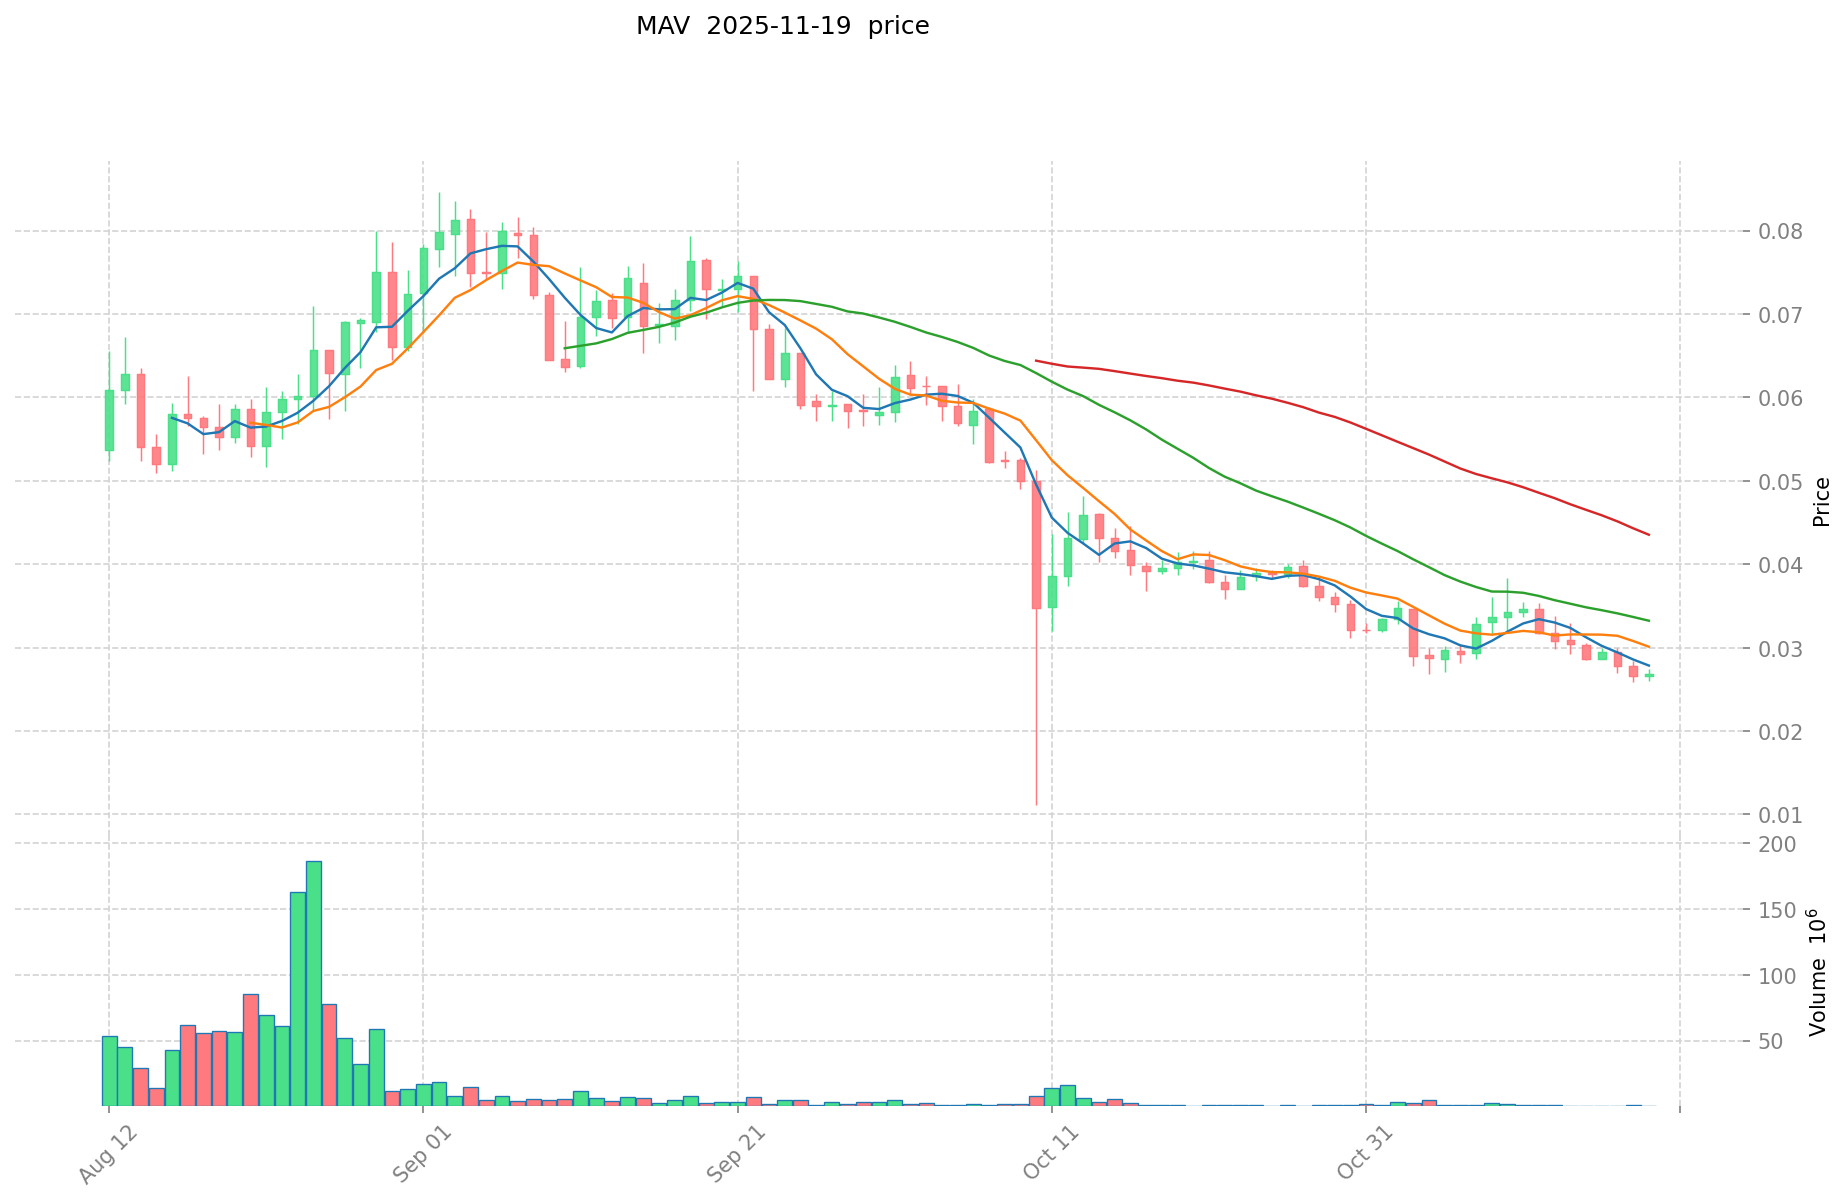
- 2024: MAV reached its all-time high of $0.8186 on March 2, 2024.
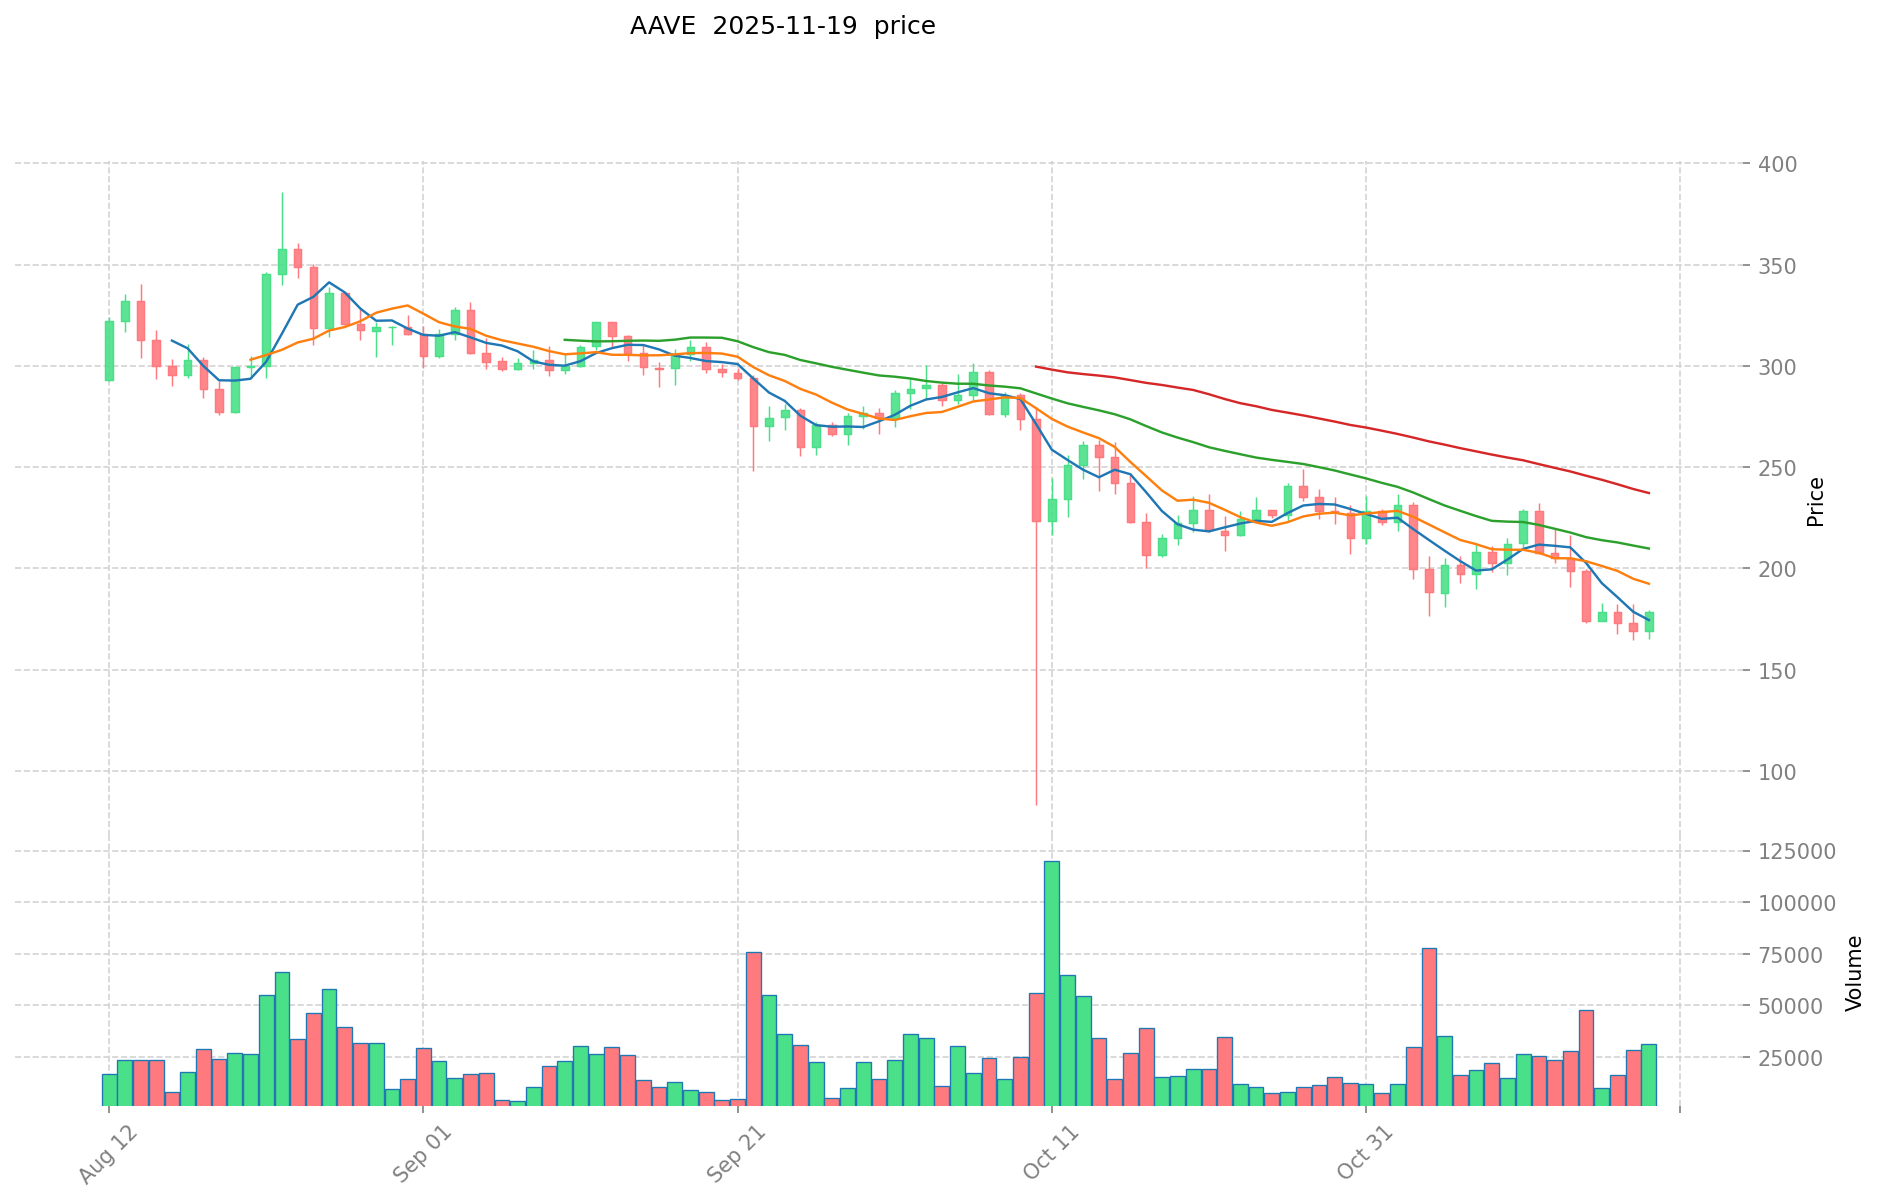
- 2021: AAVE hit its all-time high of $661.69 on May 19, 2021, during the bull market.
- Comparative analysis: In the recent market cycle, MAV dropped from its high of $0.8186 to a low of $0.01108, while AAVE declined from $661.69 to its low of $26.02.
Current Market Situation (2025-11-19)
- MAV current price: $0.02772
- AAVE current price: $173.96
- 24-hour trading volume: MAV $17,171,012 vs AAVE $4,323,130,795
- Market Sentiment Index (Fear & Greed Index): 15 (Extreme Fear)
Click to view real-time prices:
- Check MAV current price Market Price
- Check AAVE current price Market Price
AAVE Investment Value Analysis
I. Core Factors Affecting AAVE's Investment Value
Protocol Fundamentals
- Market Position: AAVE is currently the largest and most battle-tested lending protocol, with active loans totaling $7.5 billion, five times larger than its closest competitor, Spark.
- Track Record: After five years of operation since its January 2020 launch on Ethereum mainnet, AAVE has established itself as one of the most reliable protocols in DeFi.
- Security History: Unlike many new lending protocols that encounter security incidents in their first year, AAVE has maintained operations without any major smart contract-level security incidents.
Financial Performance
- Revenue Growth: AAVE's revenue has exceeded its 2021 Q4 peak, with quarterly growth accelerating at 50-60% during 2024 Q1 and Q2 market recovery.
- Sustained Growth: Even during market stagnation (November 2022 to October 2023), AAVE's revenue growth continued to accelerate quarter-over-quarter.
- TVL Expansion: Since the beginning of the year, AAVE's Total Value Locked has nearly doubled, recovering to 51% of its 2021 cycle peak, driven by deposit increases and price appreciation of underlying assets like WBTC and ETH.
Economic Model
- Safety Module: AAVE functions as the protocol's "lender of last resort" collateral in the event of system losses, with holders able to opt into loss events by staking in the Safety Module.
- Risk Mitigation: Recent changes have removed slashing risk for $AAVE when the Safety Module is utilized, benefiting both platform users and token holders.
- Yield Generation: Participants who stake AAVE receive ecosystem rewards including those from ecosystem reserves and protocol fees, currently yielding approximately 6% APR.
Competitive Advantages
- Protocol Security: AAVE's robust risk management and security track record serve as a primary consideration for DeFi users, especially large-scale "whale" investors.
- Full Dilution: $AAVE is already almost completely diluted, with no major supply unlocks expected in the future, contrasting with newer token offerings that often face price declines post-token generation events.
- Multi-chain Deployment: AAVE has expanded to 13 blockchain networks, with potential deployment to Aptos marking its first venture into non-EVM networks, further cementing its position as a truly multi-chain DeFi leader.
II. Growth Catalysts and Future Outlook
Technical Developments
- AAVE V4: The upcoming V4 upgrade will enhance platform accessibility through expansion to additional chains and introduction of new asset classes.
- RWA Integration: AAVE is exploring integration of Real World Asset-based products built around GHO, potentially connecting traditional finance with DeFi and attracting institutional investors.
- Revenue Sharing: New mechanisms will allow redistribution of net excess protocol income to token stakers, increasing demand drivers for $AAVE.
Market Correlation
- Crypto Market Growth: AAVE benefits from broader crypto market growth as over 75% of its asset base consists of non-stable assets (primarily BTC and ETH derivatives).
- Stablecoin Market: AAVE stands to benefit from stablecoin market growth, particularly as global central banks signal a shift toward rate-cutting cycles, potentially driving capital from traditional finance yield instruments to DeFi stablecoin farms.
- Risk Appetite: During bull markets, increased risk appetite behavior typically leads to higher utilization rates of stablecoin borrowing on platforms like AAVE.
Valuation Metrics
- Price-to-Fundamentals Divergence: Despite rising TVL and revenue run rate, AAVE's valuation multiples have compressed, suggesting a potential disconnect between fundamentals and market valuation.
- Risk-Adjusted Opportunity: The protocol provides one of the best risk-adjusted investment opportunities in cryptocurrency due to its established position and continued growth in key metrics.
- Value Capture: AAVE has a clear revenue model with reasonable token economic value capture methods, and its competitive advantage is relatively stable due to the foundational position of lending protocols in DeFi.
III. 2025-2030 Price Prediction: MAV vs AAVE
Short-term Prediction (2025)
- MAV: Conservative $0.026372 - $0.02776 | Optimistic $0.02776 - $0.036088
- AAVE: Conservative $92.9779 - $175.43 | Optimistic $175.43 - $224.5504
Mid-term Prediction (2027)
- MAV may enter a growth phase, with expected prices ranging from $0.0306278856 to $0.0455491632
- AAVE may enter a bullish market, with expected prices ranging from $114.47439048 to $300.22528824
- Key drivers: Institutional fund inflows, ETFs, ecosystem development
Long-term Prediction (2030)
- MAV: Base scenario $0.0484668619686 - $0.054282885404832 | Optimistic scenario $0.054282885404832+
- AAVE: Base scenario $365.447747182905 - $507.97236858423795 | Optimistic scenario $507.97236858423795+
Disclaimer: This analysis is based on historical data and market projections. Cryptocurrency markets are highly volatile and unpredictable. This information should not be considered as financial advice. Always conduct your own research before making investment decisions.
MAV:
| 年份 | 预测最高价 | 预测平均价格 | 预测最低价 | 涨跌幅 |
|---|---|---|---|---|
| 2025 | 0.036088 | 0.02776 | 0.026372 | 0 |
| 2026 | 0.04660904 | 0.031924 | 0.02138908 | 15 |
| 2027 | 0.0455491632 | 0.03926652 | 0.0306278856 | 41 |
| 2028 | 0.052161645168 | 0.0424078416 | 0.02332431288 | 52 |
| 2029 | 0.0496489805532 | 0.047284743384 | 0.03451786267032 | 70 |
| 2030 | 0.054282885404832 | 0.0484668619686 | 0.024718099603986 | 74 |
AAVE:
| 年份 | 预测最高价 | 预测平均价格 | 预测最低价 | 涨跌幅 |
|---|---|---|---|---|
| 2025 | 224.5504 | 175.43 | 92.9779 | 0 |
| 2026 | 231.988632 | 199.9902 | 171.991572 | 14 |
| 2027 | 300.22528824 | 215.989416 | 114.47439048 | 24 |
| 2028 | 363.9313664892 | 258.10735212 | 237.4587639504 | 48 |
| 2029 | 419.87613506121 | 311.0193593046 | 158.619873245346 | 78 |
| 2030 | 507.97236858423795 | 365.447747182905 | 277.7402878590078 | 110 |
IV. Investment Strategy Comparison: MAV vs AAVE
Long-term vs Short-term Investment Strategy
- MAV: Suitable for investors focused on innovative DeFi infrastructure and growth potential
- AAVE: Suitable for investors seeking established protocols with proven track records
Risk Management and Asset Allocation
- Conservative investors: MAV: 20% vs AAVE: 80%
- Aggressive investors: MAV: 40% vs AAVE: 60%
- Hedging tools: Stablecoin allocation, options, cross-currency portfolio
V. Potential Risk Comparison
Market Risk
- MAV: Higher volatility due to lower market cap and shorter history
- AAVE: Potential market saturation in the lending protocol space
Technical Risk
- MAV: Scalability, network stability
- AAVE: Smart contract vulnerabilities, competition from newer protocols
Regulatory Risk
- Global regulatory policies may impact both tokens differently, with AAVE potentially facing more scrutiny due to its larger market presence
VI. Conclusion: Which Is the Better Buy?
📌 Investment Value Summary:
- MAV advantages: Innovative AMM infrastructure, potential for rapid growth
- AAVE advantages: Market leader in DeFi lending, proven security track record, multi-chain deployment
✅ Investment Advice:
- New investors: Consider a larger allocation to AAVE for its established position and lower risk profile
- Experienced investors: Balanced portfolio with both MAV and AAVE, adjusting based on risk tolerance
- Institutional investors: Focus on AAVE for its liquidity, market dominance, and institutional-grade security
⚠️ Risk Warning: Cryptocurrency markets are highly volatile. This analysis does not constitute investment advice. None
VII. FAQ
Q1: What are the key differences between MAV and AAVE? A: MAV is a newer project focused on innovative automated market maker (AMM) infrastructure, while AAVE is an established decentralized lending protocol. AAVE has a longer track record, larger market cap, and wider adoption across multiple blockchains.
Q2: Which token has shown better price performance recently? A: Based on the provided data, AAVE has shown stronger recent performance. While MAV reached its all-time high in 2024, AAVE has recovered more significantly from its lows and currently trades at a much higher price point.
Q3: What are the main risk factors for investing in MAV and AAVE? A: For MAV, key risks include higher volatility due to its lower market cap and shorter history, as well as potential scalability issues. For AAVE, risks include market saturation in the lending protocol space and potential regulatory scrutiny due to its larger market presence.
Q4: How do the future outlooks compare for MAV and AAVE? A: AAVE has a more established growth trajectory with upcoming upgrades (V4), exploration of real-world asset integration, and potential for increased institutional adoption. MAV's outlook is more speculative but may offer higher growth potential if its innovative AMM infrastructure gains traction.
Q5: Which token might be more suitable for conservative investors? A: AAVE is generally considered more suitable for conservative investors due to its established market position, proven security track record, and more stable financial performance. A suggested conservative allocation might be 80% AAVE to 20% MAV.
Q6: How do the long-term price predictions compare between MAV and AAVE? A: By 2030, the base scenario predicts MAV to reach $0.0484668619686 - $0.054282885404832, while AAVE is expected to reach $365.447747182905 - $507.97236858423795. AAVE is projected to have a higher percentage increase from current prices.
Q7: What factors could drive growth for both MAV and AAVE in the coming years? A: Key growth drivers for both tokens include overall crypto market growth, increased institutional adoption, potential ETF approvals, and ongoing ecosystem development. For AAVE specifically, multi-chain expansion and integration with traditional finance could be significant catalysts.
Share
Content
Introduction: Investment Comparison of MAV vs AAVE
I. Core Factors Affecting AAVE's Investment Value
II. Growth Catalysts and Future Outlook
III. 2025-2030 Price Prediction: MAV vs AAVE
IV. Investment Strategy Comparison: MAV vs AAVE
V. Potential Risk Comparison
VI. Conclusion: Which Is the Better Buy?
VII. FAQ

