OBT vs BCH: Comparing Two Cryptocurrency Giants in the Decentralized Finance Ecosystem
Introduction: OBT vs BCH Investment Comparison
In the cryptocurrency market, the comparison between Orbiter Finance (OBT) vs Bitcoin Cash (BCH) has always been a topic investors can't ignore. The two not only have significant differences in market cap ranking, application scenarios, and price performance, but also represent different positions in the crypto asset space.
Orbiter Finance (OBT): Launched in 2023, it has gained market recognition for its interoperability protocol based on ZK technology.
Bitcoin Cash (BCH): Since its inception in 2017, it has been hailed as a "peer-to-peer electronic cash system," and is one of the top cryptocurrencies by global trading volume and market capitalization.
This article will provide a comprehensive analysis of the investment value comparison between OBT and BCH, focusing on historical price trends, supply mechanisms, institutional adoption, technological ecosystems, and future predictions, attempting to answer the question investors care about most:
"Which is the better buy right now?"
I. Price History Comparison and Current Market Status
OBT (Coin A) and BCH (Coin B) Historical Price Trends
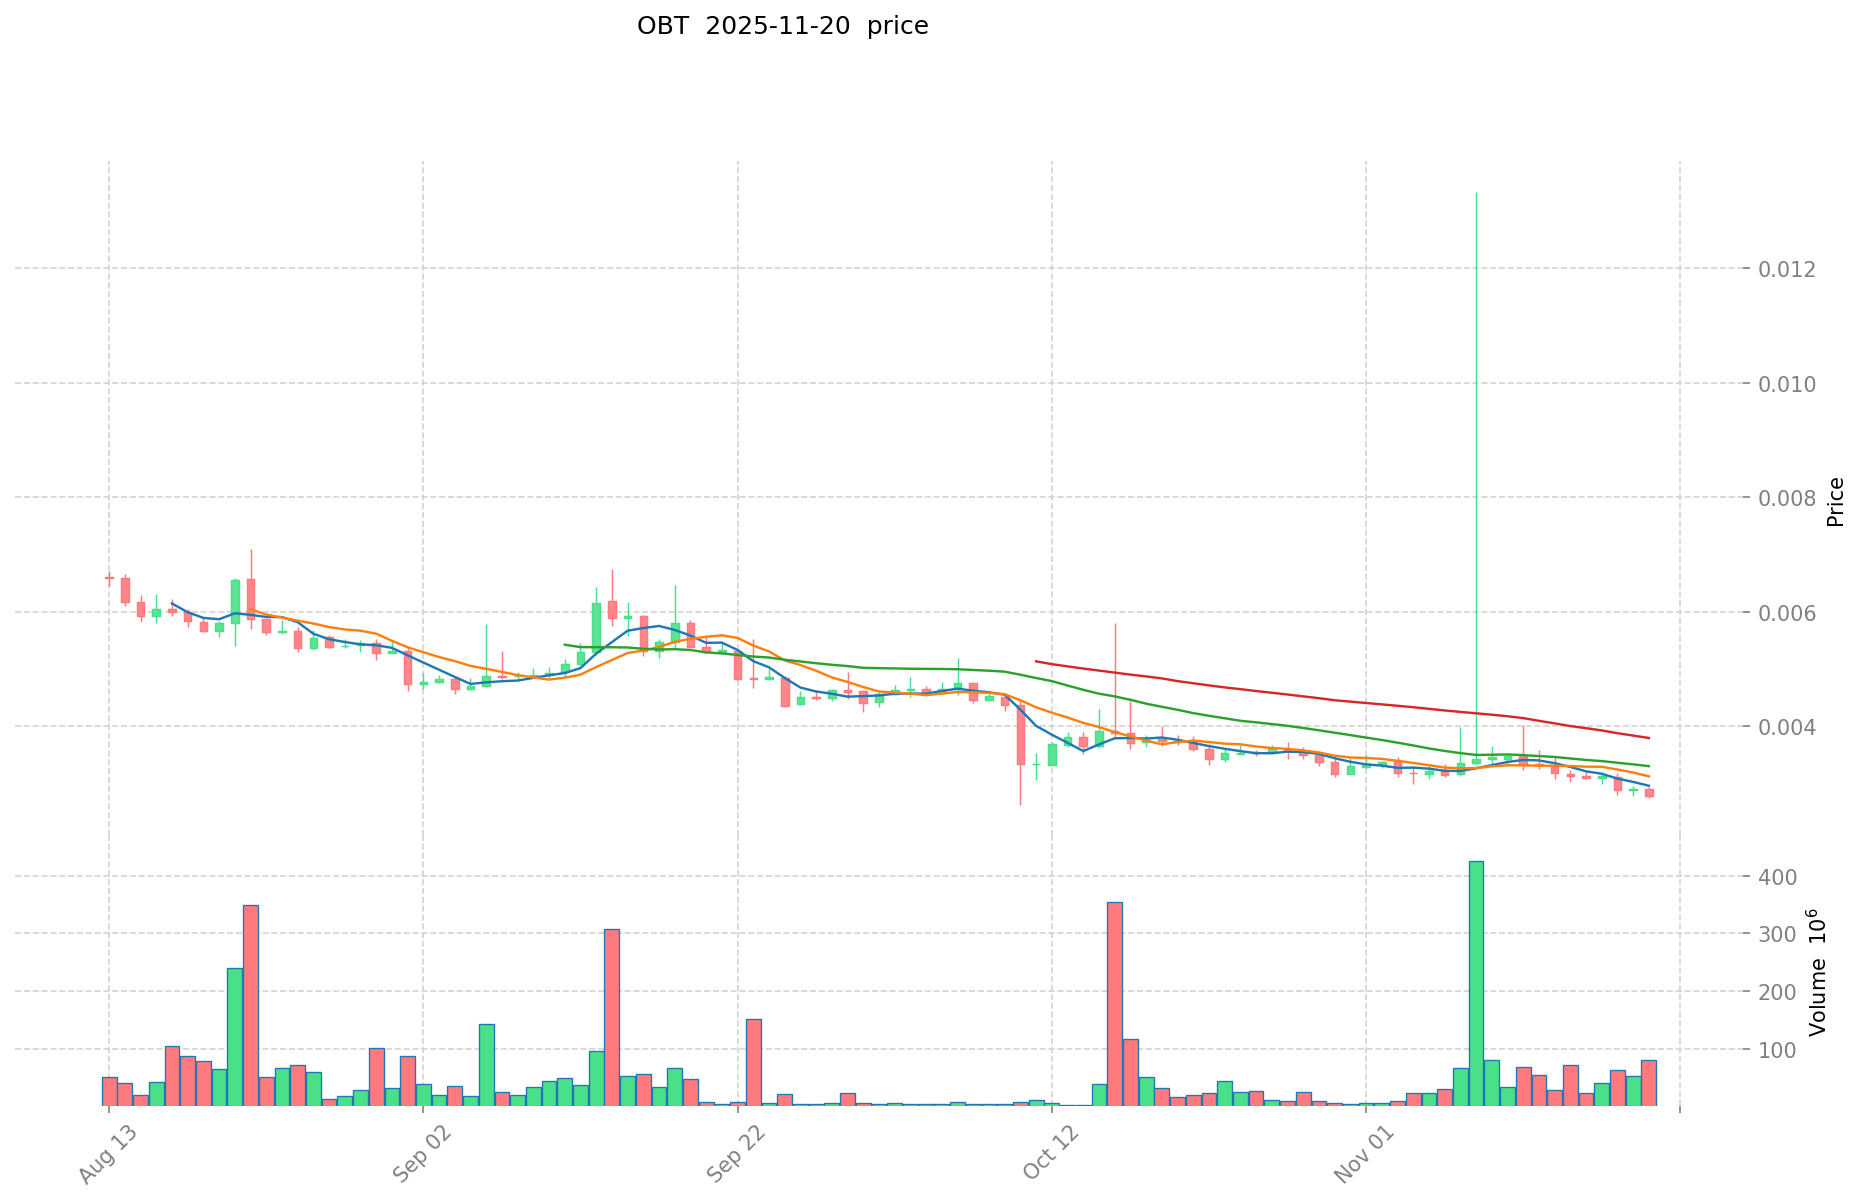
- 2025: OBT reached its all-time high of $0.0335 on March 14, then declined to its all-time low of $0.002621 on October 10.
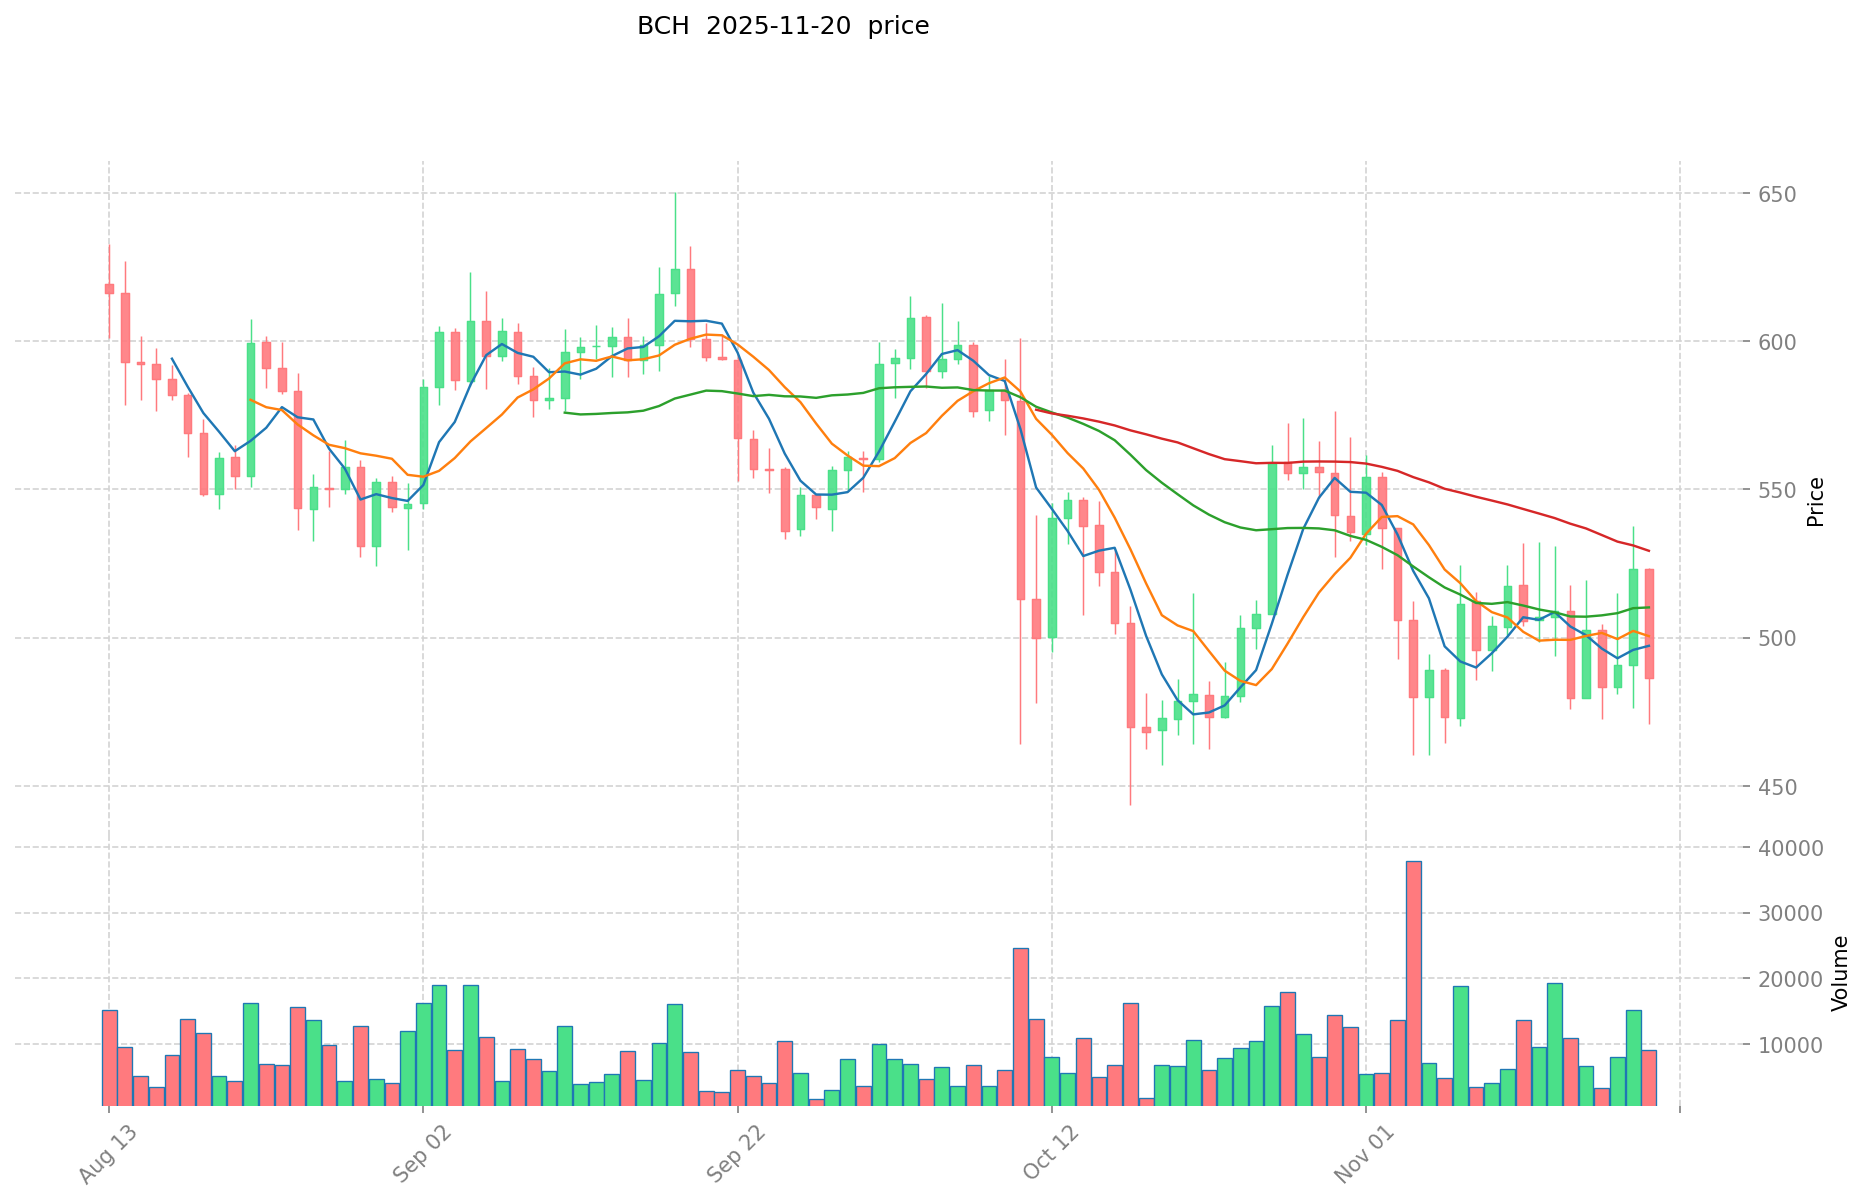
- 2017: BCH was launched via a Bitcoin hard fork, with an initial price of $555.89.
- Comparative analysis: While OBT has experienced significant volatility in 2025, BCH has shown long-term stability since its inception in 2017, with its all-time high of $3,785.82 in December 2017 and all-time low of $76.93 in December 2018.
Current Market Situation (2025-11-20)
- OBT current price: $0.0029
- BCH current price: $498.71
- 24-hour trading volume: OBT $267,563.33 vs BCH $5,085,879.14
- Market Sentiment Index (Fear & Greed Index): 11 (Extreme Fear)
Click to view real-time prices:
- View OBT current price Market Price
- View BCH current price Market Price
II. Key Factors Affecting the Investment Value of OBT vs BCH
Supply Mechanisms Comparison (Tokenomics)
- OBT: Fixed supply with a maximum cap of 1 billion tokens
- BCH: Fixed supply with a maximum cap of 21 million coins and follows a halving mechanism
- 📌 Historical Pattern: Fixed supply mechanisms typically create scarcity over time, potentially driving price appreciation during periods of increased demand.
Institutional Adoption and Market Applications
- Institutional Holdings: BCH has historically seen more institutional adoption than OBT due to its longer presence in the market
- Enterprise Adoption: BCH has more established use cases in cross-border payments and retail transactions, while OBT is still developing its market applications
- Regulatory Attitudes: Both face varying regulatory approaches across different jurisdictions, with BCH generally having more established regulatory clarity
Technical Development and Ecosystem Building
- OBT Technical Development: Built on a multi-chain architecture with focus on interoperability and scalability
- BCH Technical Development: Focuses on on-chain scaling through larger block sizes, enabling more transactions per second at lower fees
- Ecosystem Comparison: BCH has a more established payment ecosystem, while OBT is developing across multiple chains with potential for DeFi and cross-chain applications
Macroeconomic Factors and Market Cycles
- Performance During Inflation: BCH has more historical data demonstrating its behavior during inflationary periods
- Macroeconomic Monetary Policy: Both assets tend to show sensitivity to interest rate changes and dollar strength
- Geopolitical Factors: Cross-border transaction demand benefits both, with BCH having a more established track record in regions with currency controls
III. Price Prediction 2025-2030: OBT vs BCH
Short-term Prediction (2025)
- OBT: Conservative $0.001943 - $0.0029 | Optimistic $0.0029 - $0.00377
- BCH: Conservative $468.91 - $498.84 | Optimistic $498.84 - $608.58
Mid-term Prediction (2027)
- OBT may enter a growth phase, with prices expected in the range of $0.002861 - $0.004292
- BCH may enter a consolidation phase, with prices expected in the range of $504.32 - $699.17
- Key drivers: Institutional capital inflow, ETF developments, ecosystem growth
Long-term Prediction (2030)
- OBT: Base scenario $0.003980 - $0.005378 | Optimistic scenario $0.005378 - $0.005647
- BCH: Base scenario $659.09 - $794.08 | Optimistic scenario $794.08 - $905.26
Disclaimer: These predictions are based on historical data and market analysis. Cryptocurrency markets are highly volatile and subject to change. This information should not be considered as financial advice. Always conduct your own research before making investment decisions.
OBT:
| 年份 | 预测最高价 | 预测平均价格 | 预测最低价 | 涨跌幅 |
|---|---|---|---|---|
| 2025 | 0.00377 | 0.0029 | 0.001943 | 0 |
| 2026 | 0.004002 | 0.003335 | 0.0023345 | 15 |
| 2027 | 0.004292145 | 0.0036685 | 0.00286143 | 26 |
| 2028 | 0.00517441925 | 0.0039803225 | 0.0033434709 | 37 |
| 2029 | 0.00617945068125 | 0.004577370875 | 0.00398231266125 | 57 |
| 2030 | 0.005647331317031 | 0.005378410778125 | 0.003980023975812 | 85 |
BCH:
| 年份 | 预测最高价 | 预测平均价格 | 预测最低价 | 涨跌幅 |
|---|---|---|---|---|
| 2025 | 608.5848 | 498.84 | 468.9096 | 0 |
| 2026 | 592.472268 | 553.7124 | 509.415408 | 11 |
| 2027 | 699.17264748 | 573.092334 | 504.32125392 | 14 |
| 2028 | 814.2495881472 | 636.13249074 | 477.099368055 | 27 |
| 2029 | 862.977336937884 | 725.1910394436 | 681.679577076984 | 45 |
| 2030 | 905.25597453744588 | 794.084188190742 | 659.08987619831586 | 59 |
IV. Investment Strategy Comparison: OBT vs BCH
Long-term vs Short-term Investment Strategies
- OBT: Suitable for investors focused on interoperability and cross-chain potential
- BCH: Suitable for investors seeking established payment networks and potential store of value
Risk Management and Asset Allocation
- Conservative investors: OBT: 10% vs BCH: 90%
- Aggressive investors: OBT: 30% vs BCH: 70%
- Hedging tools: Stablecoin allocation, options, cross-currency portfolios
V. Potential Risk Comparison
Market Risks
- OBT: Higher volatility, less liquidity, and potential for rapid price swings
- BCH: Susceptible to overall cryptocurrency market trends and Bitcoin price movements
Technical Risks
- OBT: Scalability, network stability, and potential vulnerabilities in cross-chain operations
- BCH: Mining centralization, potential security vulnerabilities
Regulatory Risks
- Global regulatory policies may impact both differently, with BCH potentially facing more scrutiny due to its longer history and wider adoption
VI. Conclusion: Which Is the Better Buy?
📌 Investment Value Summary:
- OBT advantages: Innovative cross-chain technology, potential for growth in interoperability solutions
- BCH advantages: Established network, wider adoption for payments, longer track record
✅ Investment Advice:
- New investors: Consider a small allocation to BCH as part of a diversified crypto portfolio
- Experienced investors: Explore a balanced mix of OBT and BCH based on risk tolerance and market outlook
- Institutional investors: Conduct thorough due diligence on both, with potentially higher allocation to BCH due to its established market presence
⚠️ Risk Warning: The cryptocurrency market is highly volatile. This article does not constitute investment advice. None
VII. FAQ
Q1: What are the main differences between OBT and BCH? A: OBT is a newer cryptocurrency focused on interoperability and cross-chain solutions, while BCH is an established cryptocurrency that functions as a peer-to-peer electronic cash system. OBT has a fixed supply of 1 billion tokens, while BCH has a maximum supply of 21 million coins with a halving mechanism.
Q2: Which cryptocurrency has shown better price performance historically? A: BCH has a longer price history and has shown more stability since its inception in 2017, with an all-time high of $3,785.82. OBT, being newer, has experienced significant volatility in 2025, with its all-time high at $0.0335.
Q3: How do the current market situations of OBT and BCH compare? A: As of 2025-11-20, OBT's price is $0.0029 with a 24-hour trading volume of $267,563.33, while BCH's price is $498.71 with a 24-hour trading volume of $5,085,879.14. BCH has significantly higher liquidity and trading volume.
Q4: What are the key factors affecting the investment value of OBT and BCH? A: Key factors include supply mechanisms, institutional adoption, market applications, technical development, ecosystem building, and macroeconomic factors. BCH generally has more established use cases and institutional adoption, while OBT is developing its ecosystem with a focus on interoperability.
Q5: What are the price predictions for OBT and BCH in the coming years? A: By 2030, OBT is predicted to reach $0.003980 - $0.005647 in the base to optimistic scenarios, while BCH is expected to reach $659.09 - $905.26. However, these predictions are subject to market volatility and should not be considered financial advice.
Q6: How should investors approach allocating between OBT and BCH? A: Conservative investors might consider allocating 10% to OBT and 90% to BCH, while aggressive investors might opt for 30% OBT and 70% BCH. The specific allocation should be based on individual risk tolerance and market outlook.
Q7: What are the potential risks associated with investing in OBT and BCH? A: Both face market risks related to cryptocurrency volatility. OBT has higher volatility and less liquidity, while BCH is susceptible to overall crypto market trends. Technical risks include scalability and security vulnerabilities. Regulatory risks may impact both, with BCH potentially facing more scrutiny due to its wider adoption.
Share
Content
Introduction: OBT vs BCH Investment Comparison
I. Price History Comparison and Current Market Status
II. Key Factors Affecting the Investment Value of OBT vs BCH
III. Price Prediction 2025-2030: OBT vs BCH
IV. Investment Strategy Comparison: OBT vs BCH
V. Potential Risk Comparison
VI. Conclusion: Which Is the Better Buy?
VII. FAQ

