PNG vs ETH: Which Digital Asset Offers Better Long-Term Growth Potential?
Introduction: PNG vs ETH Investment Comparison
In the cryptocurrency market, Pangolin (PNG) vs Ethereum (ETH) comparison has always been a topic that investors cannot ignore. The two not only have significant differences in market cap ranking, application scenarios, and price performance, but also represent different cryptocurrency asset positioning.
Pangolin (PNG): Since its launch, it has gained market recognition for its role as a decentralized exchange (DEX) operating on the Avalanche network.
Ethereum (ETH): Since its inception in 2015, it has been hailed as the foundation for decentralized applications and smart contracts, and is one of the cryptocurrencies with the highest global trading volume and market capitalization.
This article will provide a comprehensive analysis of the investment value comparison between PNG and ETH, focusing on historical price trends, supply mechanisms, institutional adoption, technological ecosystems, and future predictions, while attempting to answer the question most concerning to investors:
"Which is the better buy right now?"
I. Price History Comparison and Current Market Status
PNG (Coin A) and ETH (Coin B) Historical Price Trends
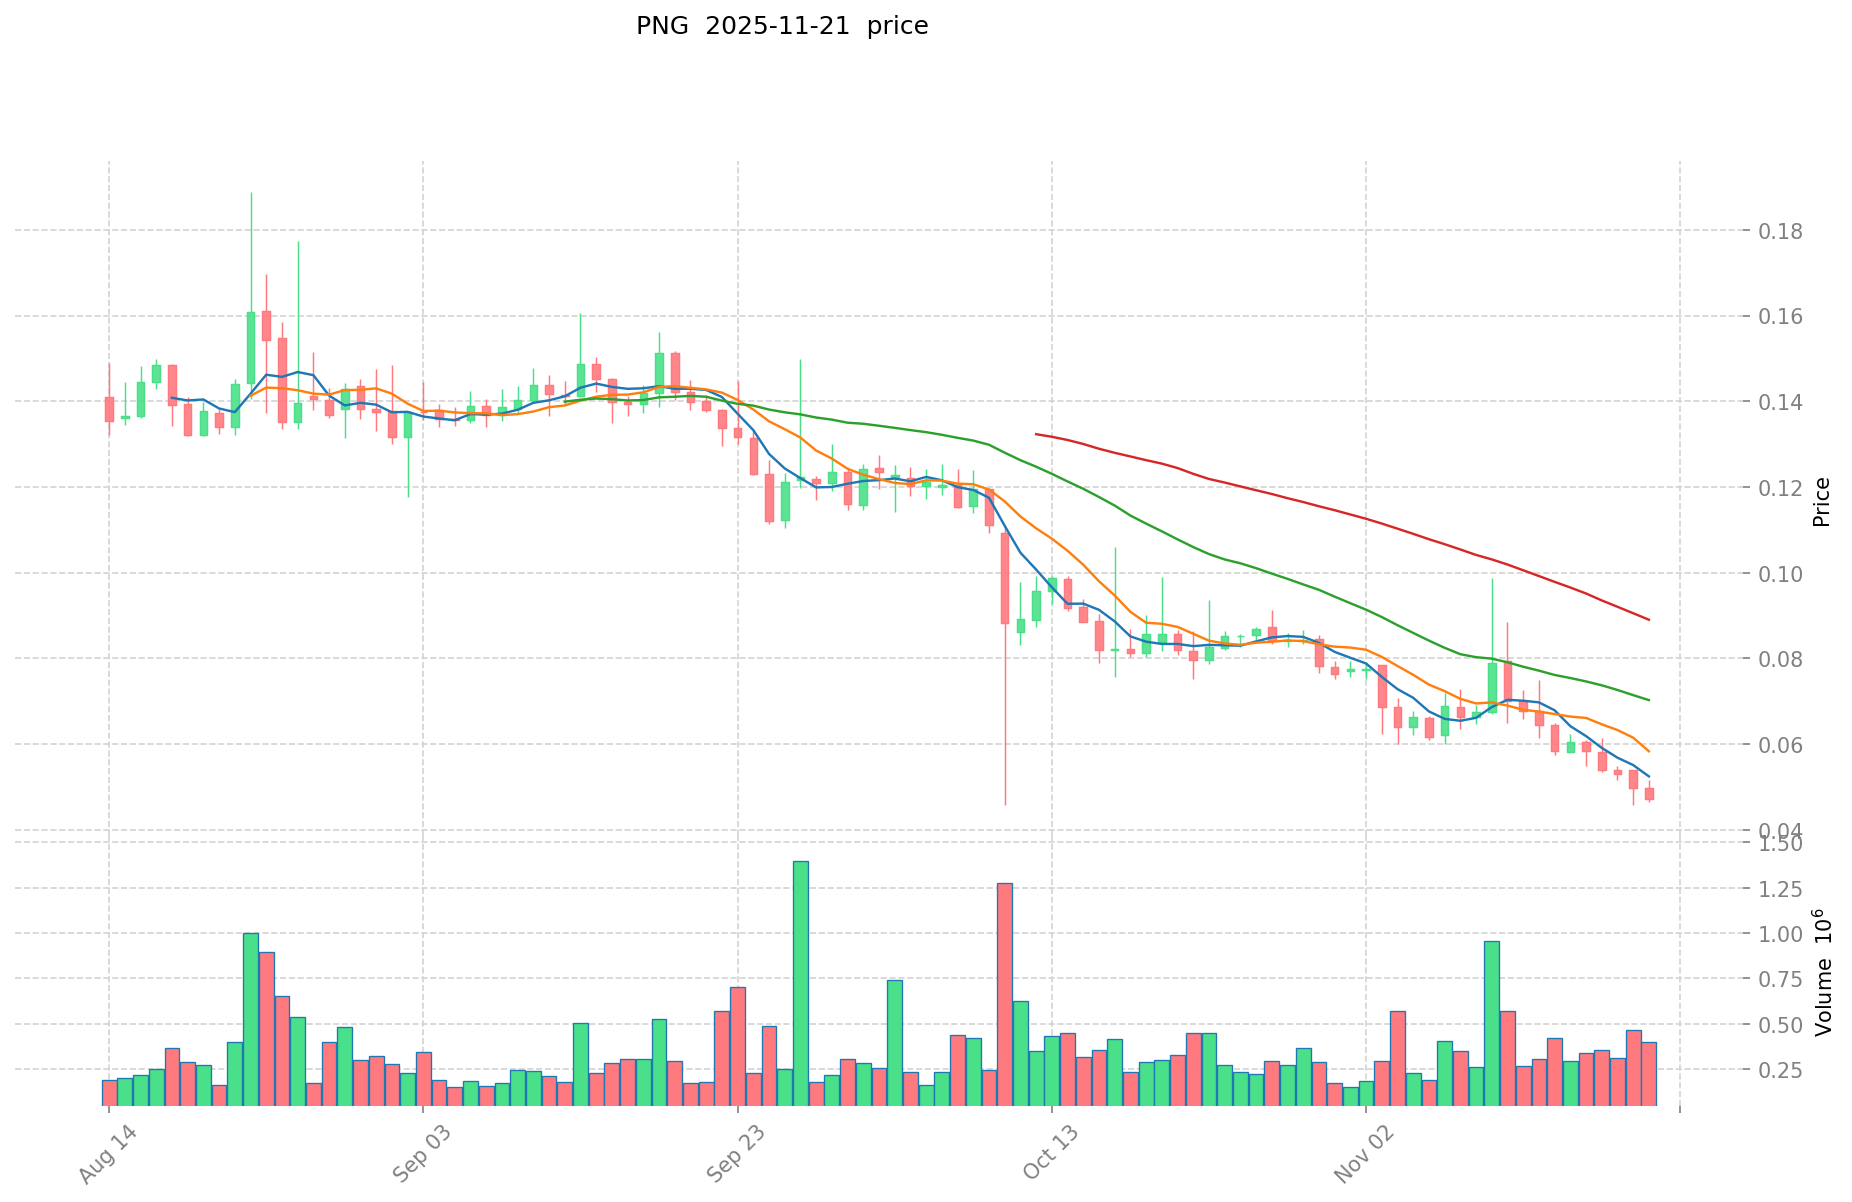
- 2023: PNG reached its all-time low of $0.01180712 on October 25, 2023, showing significant price decline.
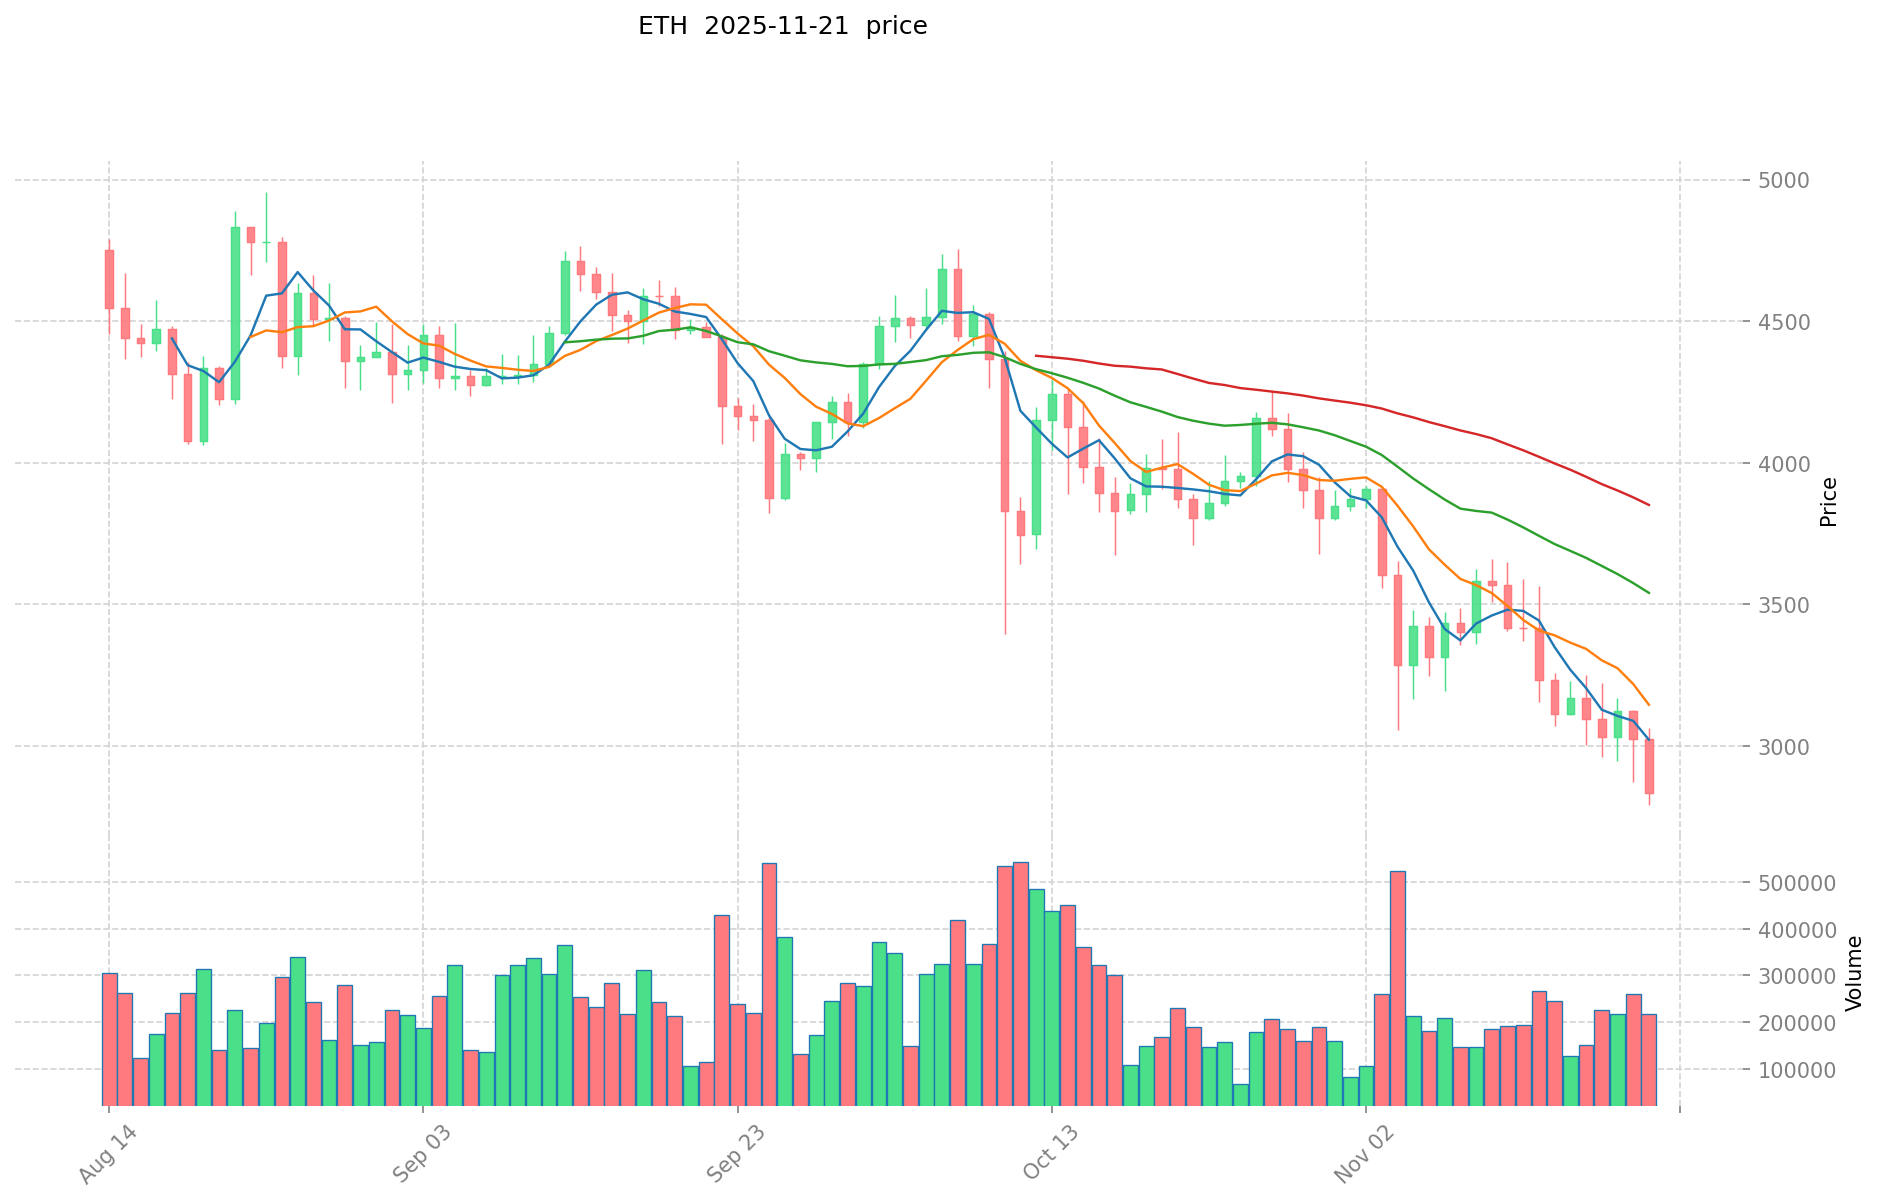
- 2025: ETH hit its all-time high of $4,946.05 on August 25, 2025, demonstrating strong market performance.
- Comparative Analysis: In recent market cycles, PNG dropped from its all-time high of $18.85 to its current price of $0.04762, while ETH has shown more resilience, currently trading at $2,855.37 after reaching its peak.
Current Market Situation (2025-11-21)
- PNG current price: $0.04762
- ETH current price: $2,855.37
- 24-hour trading volume: PNG $19,243.99 vs ETH $623,097,966.35
- Market Sentiment Index (Fear & Greed Index): 14 (Extreme Fear)
Click to view real-time prices:
- View PNG current price Market Price
- View ETH current price Market Price
II. Core Factors Affecting PNG vs ETH Investment Value
Supply Mechanisms Comparison (Tokenomics)
-
ETH: Deflationary model following EIP-1559 implementation; issuance reduced by ~90% post-merge with transaction fee burning mechanism
-
PNG: Fixed supply of 100 million tokens; 30% locked for 3 years with 10% released annually
-
📌 Historical Pattern: Ethereum's shift from inflationary to deflationary supply has historically supported price stability during market downturns, while PNG's fixed supply model aims to create scarcity as adoption increases.
Institutional Adoption and Market Applications
- Institutional Holdings: ETH has significantly higher institutional adoption, with major funds and corporations adding it to their balance sheets; PNG has limited institutional presence
- Enterprise Adoption: ETH powers major DeFi protocols, NFT marketplaces, and enterprise blockchain solutions; PNG serves primarily as a governance and utility token within the Pangolin ecosystem
- Regulatory Attitudes: ETH has gained regulatory clarity in most jurisdictions as a commodity rather than security; PNG's regulatory status remains less defined across different countries
Technical Development and Ecosystem Building
- ETH Technical Upgrades: Transition to PoS consensus, upcoming sharding solutions, and L2 scaling solutions providing enhanced throughput and reduced transaction costs
- PNG Technical Development: Integration with Avalanche C-Chain, improved liquidity pooling mechanisms, and cross-chain bridging capabilities
- Ecosystem Comparison: ETH dominates in DeFi TVL, NFT market volume, developer activity, and enterprise blockchain applications; PNG primarily functions within the Avalanche ecosystem with focus on DEX functionality
Macroeconomic Factors and Market Cycles
- Inflation Performance: ETH has demonstrated moderate inflation hedge properties due to its utility and supply constraints; PNG lacks sufficient market history to evaluate inflation resistance
- Macroeconomic Policy Impact: ETH shows higher correlation with technology stocks and risk assets during rate hike cycles; both assets face pressure during liquidity contractions
- Geopolitical Factors: ETH benefits from global recognition and availability across jurisdictions; PNG has more limited global footprint and accessibility
III. 2025-2030 Price Prediction: PNG vs ETH
Short-term Prediction (2025)
- PNG: Conservative $0.0463 - $0.0478 | Optimistic $0.0478 - $0.0559
- ETH: Conservative $2,134 - $2,845 | Optimistic $2,845 - $3,329
Mid-term Prediction (2027)
- PNG may enter a growth phase, with prices expected in the range of $0.0351 - $0.0590
- ETH may enter a consolidation phase, with prices expected in the range of $2,032 - $3,644
- Key drivers: Institutional fund inflows, ETF, ecosystem development
Long-term Prediction (2030)
- PNG: Base scenario $0.0800 - $0.0834 | Optimistic scenario $0.0834 - $0.1176
- ETH: Base scenario $3,130 - $4,891 | Optimistic scenario $4,891 - $7,043
Disclaimer: The above predictions are based on historical data and market analysis. Cryptocurrency markets are highly volatile and subject to rapid changes. These projections should not be considered as financial advice. Always conduct your own research before making investment decisions.
PNG:
| 年份 | 预测最高价 | 预测平均价格 | 预测最低价 | 涨跌幅 |
|---|---|---|---|---|
| 2025 | 0.0558909 | 0.04777 | 0.0463369 | 0 |
| 2026 | 0.0544219725 | 0.05183045 | 0.046647405 | 8 |
| 2027 | 0.0589700944875 | 0.05312621125 | 0.035063299425 | 11 |
| 2028 | 0.082390784717062 | 0.05604815286875 | 0.045399003823687 | 17 |
| 2029 | 0.097599450997997 | 0.069219468792906 | 0.050530212218821 | 45 |
| 2030 | 0.117607338452587 | 0.083409459895452 | 0.080073081499634 | 75 |
ETH:
| 年份 | 预测最高价 | 预测平均价格 | 预测最低价 | 涨跌幅 |
|---|---|---|---|---|
| 2025 | 3329.1999 | 2845.47 | 2134.1025 | 0 |
| 2026 | 3920.9153865 | 3087.33495 | 1605.414174 | 7 |
| 2027 | 3644.29017498 | 3504.12516825 | 2032.392597585 | 22 |
| 2028 | 4932.4065868287 | 3574.207671615 | 3145.3027510212 | 24 |
| 2029 | 5529.299267988405 | 4253.30712922185 | 3700.3772024230095 | 48 |
| 2030 | 7043.4766059913836 | 4891.3031986051275 | 3130.4340471072816 | 71 |
IV. Investment Strategy Comparison: PNG vs ETH
Long-term vs Short-term Investment Strategies
- PNG: Suitable for investors focused on DEX ecosystem potential and Avalanche network growth
- ETH: Suitable for investors seeking stability, inflation resistance, and broad ecosystem exposure
Risk Management and Asset Allocation
- Conservative investors: PNG: 5% vs ETH: 95%
- Aggressive investors: PNG: 20% vs ETH: 80%
- Hedging tools: Stablecoin allocation, options, cross-currency portfolio
V. Potential Risk Comparison
Market Risks
- PNG: High volatility, limited liquidity, and dependency on Avalanche ecosystem growth
- ETH: Correlation with broader crypto market trends, susceptibility to macroeconomic factors
Technical Risks
- PNG: Scalability, network stability, and cross-chain bridge security
- ETH: Network congestion, gas fee fluctuations, and potential smart contract vulnerabilities
Regulatory Risks
- Global regulatory policies may have different impacts on both assets, with ETH having a more established regulatory status
VI. Conclusion: Which Is the Better Buy?
📌 Investment Value Summary:
- PNG advantages: Potential for high growth within the Avalanche ecosystem, DEX functionality
- ETH advantages: Established market presence, widespread adoption, deflationary model, and ongoing technical improvements
✅ Investment Advice:
- Novice investors: Consider allocating a larger portion to ETH for stability and broader market exposure
- Experienced investors: Explore a balanced portfolio with both ETH and PNG, adjusting based on risk tolerance
- Institutional investors: Focus primarily on ETH for its liquidity, regulatory clarity, and institutional adoption
⚠️ Risk Warning: The cryptocurrency market is highly volatile. This article does not constitute investment advice. None
FAQ
Q1: What are the key differences between PNG and ETH in terms of market status? A: PNG has a much smaller market cap and 24-hour trading volume compared to ETH. As of November 21, 2025, PNG's price is $0.04762 with a 24-hour volume of $19,243.99, while ETH's price is $2,855.37 with a volume of $623,097,966.35. ETH has a more established market presence and higher liquidity.
Q2: How do the supply mechanisms of PNG and ETH differ? A: PNG has a fixed supply of 100 million tokens, with 30% locked for 3 years and 10% released annually. ETH follows a deflationary model after implementing EIP-1559, with issuance reduced by ~90% post-merge and a transaction fee burning mechanism in place.
Q3: Which cryptocurrency has higher institutional adoption? A: Ethereum (ETH) has significantly higher institutional adoption, with major funds and corporations adding it to their balance sheets. PNG has limited institutional presence in comparison.
Q4: What are the main technical developments for each cryptocurrency? A: ETH is transitioning to Proof-of-Stake consensus, implementing sharding solutions, and developing L2 scaling solutions. PNG is integrating with Avalanche C-Chain, improving liquidity pooling mechanisms, and developing cross-chain bridging capabilities.
Q5: How do the long-term price predictions for PNG and ETH compare? A: By 2030, PNG's base scenario price range is predicted to be $0.0800 - $0.0834, with an optimistic scenario of $0.0834 - $0.1176. For ETH, the base scenario range is $3,130 - $4,891, with an optimistic scenario of $4,891 - $7,043.
Q6: What are the recommended asset allocation strategies for PNG and ETH? A: For conservative investors, a suggested allocation is 5% PNG and 95% ETH. For aggressive investors, the recommendation is 20% PNG and 80% ETH. These allocations should be adjusted based on individual risk tolerance and investment goals.
Q7: Which cryptocurrency might be better suited for different types of investors? A: Novice investors may consider allocating a larger portion to ETH for stability and broader market exposure. Experienced investors could explore a balanced portfolio with both ETH and PNG. Institutional investors may focus primarily on ETH due to its liquidity, regulatory clarity, and widespread adoption.
Share
Content
Introduction: PNG vs ETH Investment Comparison
I. Price History Comparison and Current Market Status
II. Core Factors Affecting PNG vs ETH Investment Value
III. 2025-2030 Price Prediction: PNG vs ETH
IV. Investment Strategy Comparison: PNG vs ETH
V. Potential Risk Comparison
VI. Conclusion: Which Is the Better Buy?
FAQ

