PONKE vs QNT: A Battle of Innovative Technologies Shaping the Future of Blockchain
Introduction: PONKE vs QNT Investment Comparison
In the cryptocurrency market, the comparison between PONKE and QNT has been an unavoidable topic for investors. The two not only show significant differences in market cap ranking, application scenarios, and price performance but also represent different positioning in crypto assets.
PONKE (PONKE): Since its launch, it has gained market recognition for its positioning as the number 1 onboarding vehicle into the world of crypto, particularly for the Solana ecosystem.
Quant (QNT): Since its inception in 2018, it has been recognized for solving interoperability through the creation of a global blockchain operating system, Overledger.
This article will comprehensively analyze the investment value comparison between PONKE and QNT, focusing on historical price trends, supply mechanisms, institutional adoption, technological ecosystems, and future predictions, attempting to answer the question most concerning to investors:
"Which is the better buy right now?"
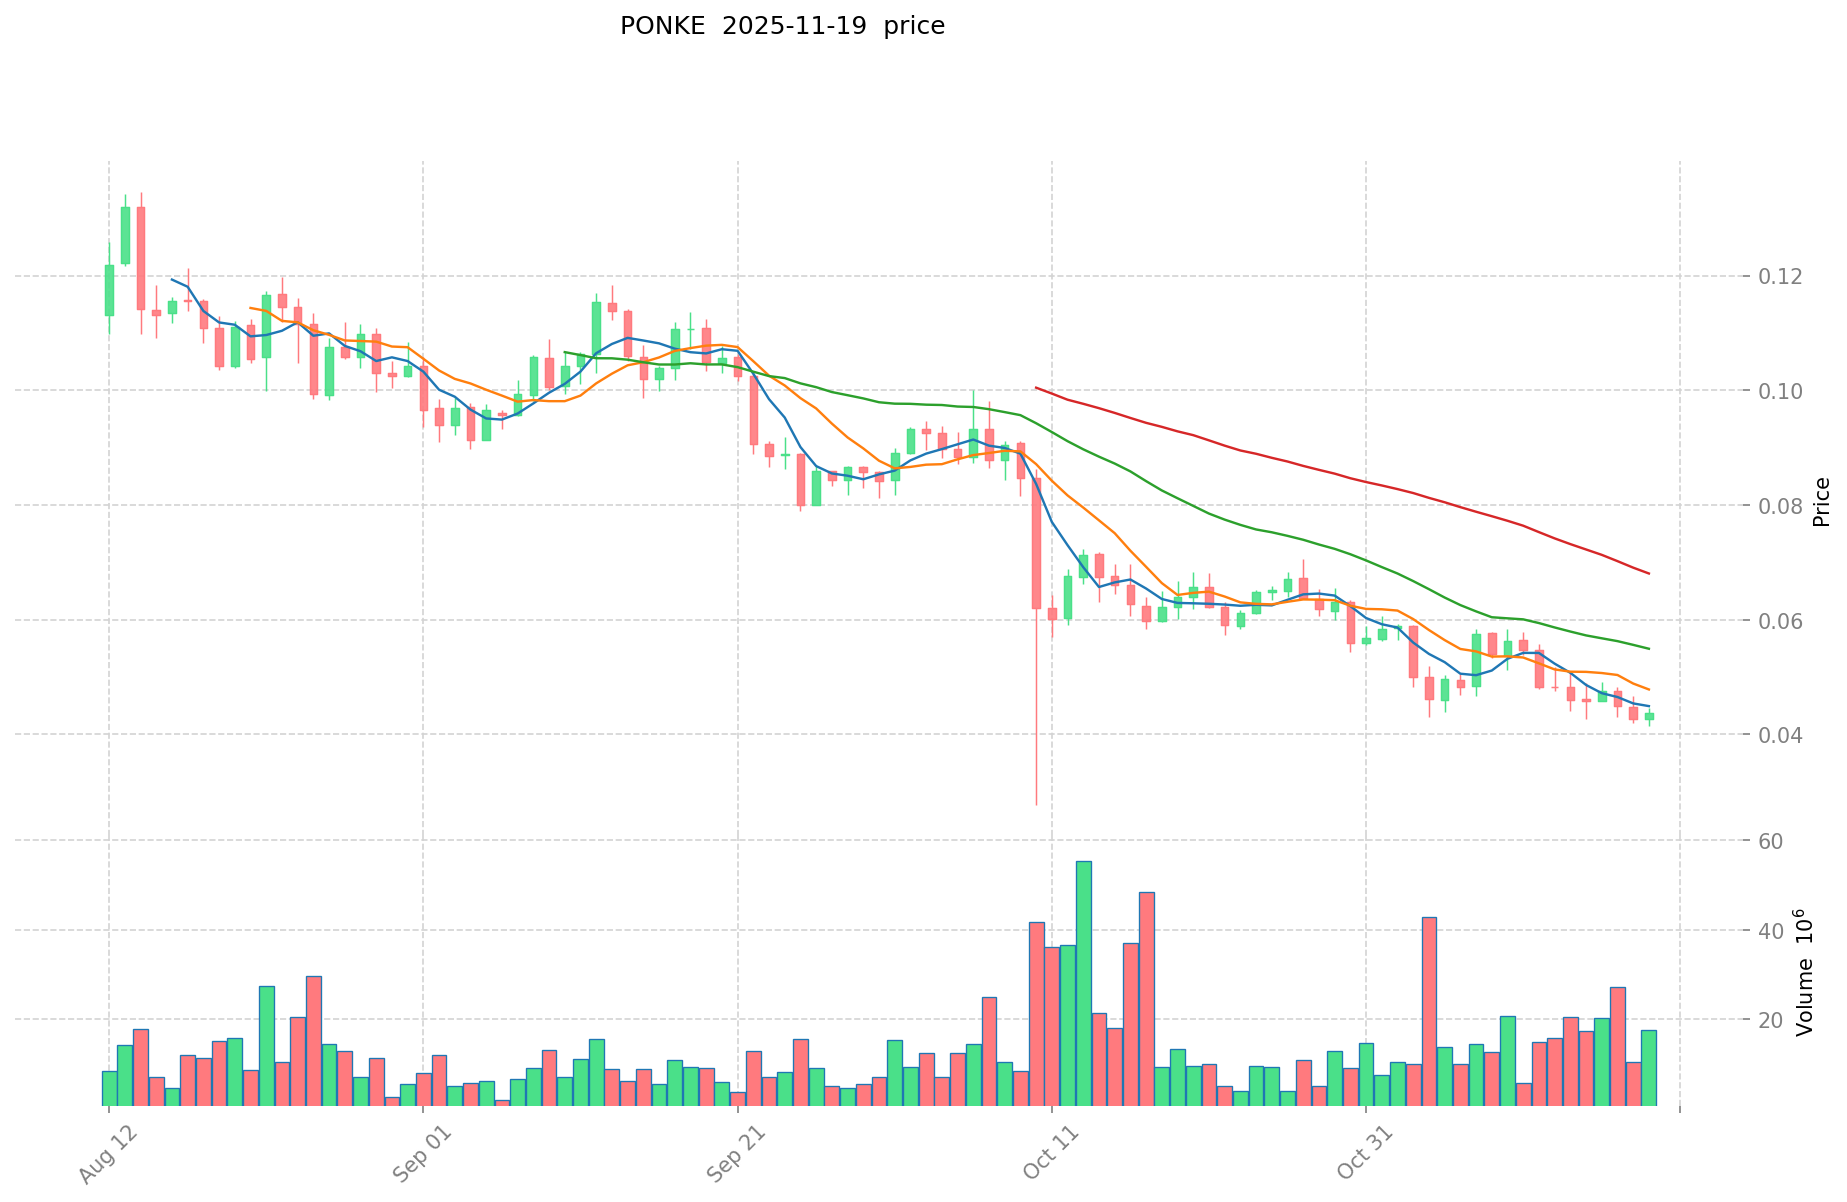
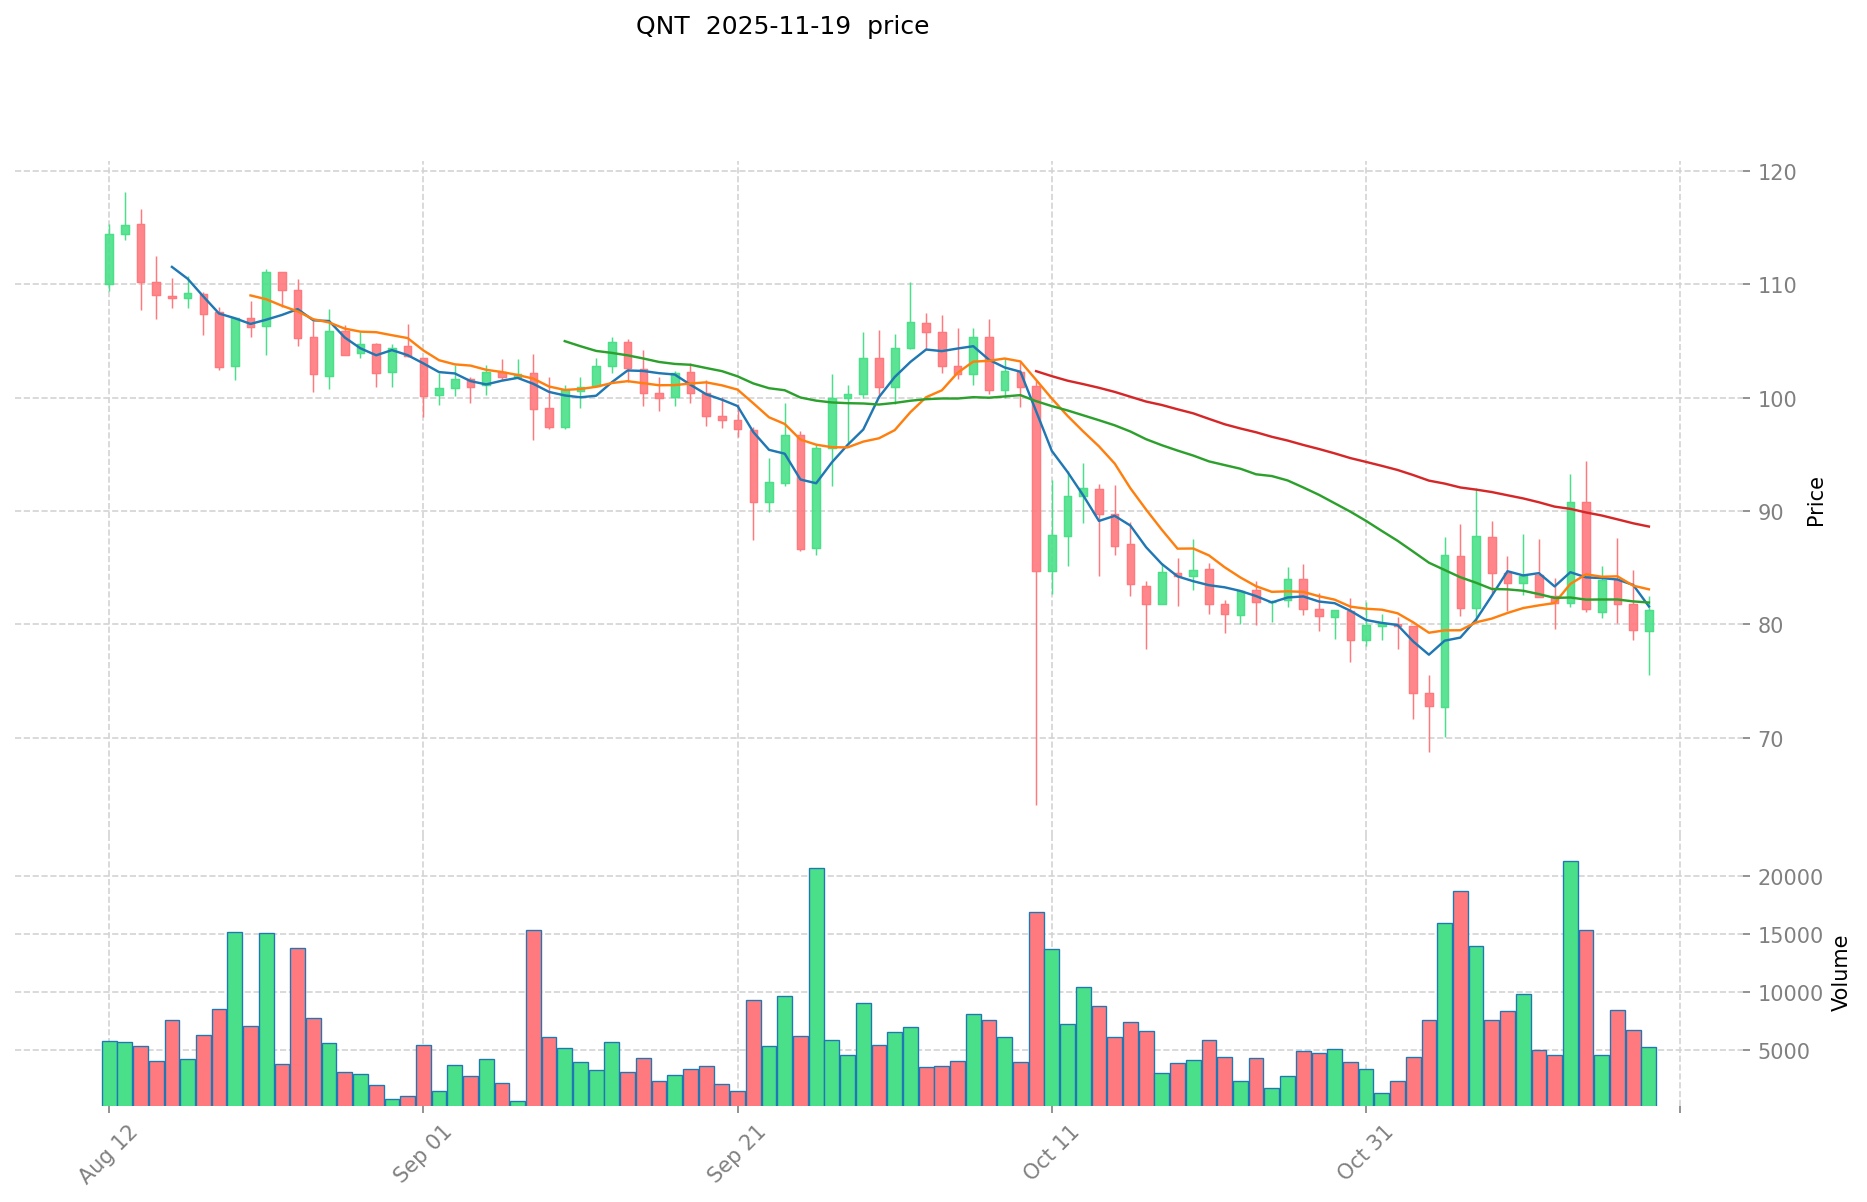
I. Price History Comparison and Current Market Status
PONKE and QNT Historical Price Trends
- 2024: PONKE reached its all-time high of $0.846 due to increased adoption on Solana.
- 2021: QNT hit its record high of $427.42 amid growing interest in interoperability solutions.
- Comparative analysis: In the recent bear market, PONKE dropped from $0.846 to $0.02762, while QNT showed more resilience, falling from $427.42 to around $80.
Current Market Situation (2025-11-19)
- PONKE current price: $0.04297
- QNT current price: $79.00
- 24-hour trading volume: $1,152,557 (PONKE) vs $310,668 (QNT)
- Market Sentiment Index (Fear & Greed Index): 15 (Extreme Fear)
Click to view real-time prices:
- Check PONKE current price Market Price
- Check QNT current price Market Price
II. Key Metrics Comparison
Market Capitalization
- PONKE: $23,871,882
- QNT: $1,175,627,756
Circulating Supply
- PONKE: 555,474,270 PONKE
- QNT: 14,544,176 QNT
Total Supply
- PONKE: 555,547,646 PONKE
- QNT: 14,881,364 QNT
Key Ratios
- Price to All-Time High Ratio: PONKE: 0.0508 (Current price / ATH) QNT: 0.1849 (Current price / ATH)
- Market Cap to Volume Ratio: PONKE: 20.71 QNT: 3,784.01
III. Technical Analysis
Short-term Indicators
- PONKE:
- 24h change: -0.94%
- 7d change: -13.22%
- QNT:
- 24h change: +2.63%
- 7d change: -4.6%
Long-term Trends
- PONKE:
- 30d change: -35.26%
- 1y change: -93.96%
- QNT:
- 30d change: -8.73%
- 1y change: -9.82%
IV. Project Fundamentals
PONKE
- Focus: Onboarding tool for Solana ecosystem
- Key feature: User-friendly entry point for newcomers to crypto
QNT
- Focus: Interoperability solution for blockchain networks
- Key feature: Overledger operating system for connecting different blockchains
V. Recent Developments and Future Outlook
PONKE
- Recent updates: [No specific recent updates mentioned in the provided data]
- Future potential: Aims to become the primary onboarding vehicle for Solana
QNT
- Recent updates: [No specific recent updates mentioned in the provided data]
- Future potential: Continued focus on enterprise blockchain adoption and interoperability solutions
VI. Investment Considerations
Potential Advantages
- PONKE: Lower market cap, potential for higher percentage gains if Solana ecosystem grows
- QNT: More established project, higher market cap, and potential for steady growth in the interoperability sector
Potential Risks
- PONKE: Higher volatility, dependent on Solana's success
- QNT: Competition in the interoperability space, potential for slower growth due to higher market cap
Disclaimer: This report is for informational purposes only and should not be considered as financial advice. Cryptocurrency investments are subject to high market risks. Please conduct your own research and consult with a financial advisor before making any investment decisions.
Impact Factors on PONKE vs QNT Investment Value
Supply Mechanism Comparison (Tokenomics)
- PONKE: Limited information available regarding its supply mechanism
- QNT: Limited information available regarding its supply mechanism
- 📌 Historical Pattern: Insufficient data on how these supply mechanisms drive price cycle changes.
Institutional Adoption and Market Applications
- Institutional Holdings: Insufficient information on institutional preference between PONKE and QNT
- Enterprise Adoption: Limited data on applications in cross-border payments, settlements, or portfolio investments
- National Policies: No clear information on regulatory attitudes toward these tokens across different countries
Technological Development and Ecosystem Building
- PONKE: Based on limited information, appears to have some unique functionalities contributing to market appeal
- QNT: Seems to offer market data prediction capabilities, though details are limited
- Ecosystem Comparison: Insufficient information on DeFi, NFT, payment, or smart contract implementations
Macroeconomic Factors and Market Cycles
- Performance in Inflationary Environments: Insufficient data on anti-inflationary properties
- Macroeconomic Monetary Policies: Limited information on how interest rates or USD index affect these tokens
- Geopolitical Factors: No clear data on cross-border transaction demands or international situation impacts
III. 2025-2030 Price Prediction: PONKE vs QNT
Short-term Prediction (2025)
- PONKE: Conservative $0.0270 - $0.0429 | Optimistic $0.0429 - $0.0494
- QNT: Conservative $62.46 - $79.07 | Optimistic $79.07 - $103.58
Mid-term Prediction (2027)
- PONKE may enter a growth phase, with estimated prices ranging from $0.0359 to $0.0776
- QNT may enter a bullish market, with estimated prices ranging from $97.24 to $154.70
- Key drivers: Institutional capital inflow, ETF, ecosystem development
Long-term Prediction (2030)
- PONKE: Base scenario $0.0479 - $0.0887 | Optimistic scenario $0.0887 - $0.0923
- QNT: Base scenario $174.38 - $187.51 | Optimistic scenario $187.51 - $230.64
Disclaimer: This analysis is based on historical data and projections. Cryptocurrency markets are highly volatile and unpredictable. These predictions should not be considered as financial advice. Always conduct your own research before making investment decisions.
PONKE:
| 年份 | 预测最高价 | 预测平均价格 | 预测最低价 | 涨跌幅 |
|---|---|---|---|---|
| 2025 | 0.0494155 | 0.04297 | 0.0270711 | 0 |
| 2026 | 0.06097443 | 0.04619275 | 0.0327968525 | 7 |
| 2027 | 0.0776962055 | 0.05358359 | 0.0359010053 | 24 |
| 2028 | 0.0781114783225 | 0.06563989775 | 0.035445544785 | 52 |
| 2029 | 0.105657261413287 | 0.07187568803625 | 0.064688119232625 | 67 |
| 2030 | 0.092317133713759 | 0.088766474724768 | 0.047933896351375 | 106 |
QNT:
| 年份 | 预测最高价 | 预测平均价格 | 预测最低价 | 涨跌幅 |
|---|---|---|---|---|
| 2025 | 103.5817 | 79.07 | 62.4653 | 0 |
| 2026 | 129.682707 | 91.32585 | 51.142476 | 15 |
| 2027 | 154.7059899 | 110.5042785 | 97.24376508 | 39 |
| 2028 | 171.060623118 | 132.6051342 | 72.93282381 | 67 |
| 2029 | 223.19433162873 | 151.832878659 | 130.57627564674 | 91 |
| 2030 | 230.64173432695395 | 187.513605143865 | 174.38765278379445 | 136 |
IV. Investment Strategy Comparison: PONKE vs QNT
Long-term vs Short-term Investment Strategies
- PONKE: Suitable for investors focused on Solana ecosystem growth and potential high-risk, high-reward opportunities
- QNT: Suitable for investors looking for more established projects with interoperability solutions and potential steady growth
Risk Management and Asset Allocation
- Conservative investors: PONKE: 10% vs QNT: 90%
- Aggressive investors: PONKE: 30% vs QNT: 70%
- Hedging tools: Stablecoin allocation, options, cross-currency portfolio
V. Potential Risk Comparison
Market Risk
- PONKE: High volatility, heavily dependent on Solana ecosystem performance
- QNT: Potential market saturation in the interoperability sector
Technical Risk
- PONKE: Scalability, network stability within Solana ecosystem
- QNT: Overledger system complexity, potential security vulnerabilities
Regulatory Risk
- Global regulatory policies may have different impacts on both tokens, with potential scrutiny on new projects like PONKE and established platforms like QNT
VI. Conclusion: Which Is the Better Buy?
📌 Investment Value Summary:
- PONKE advantages: Lower market cap, potential for higher percentage gains, strong positioning in Solana ecosystem
- QNT advantages: More established project, higher market cap, focus on interoperability solutions
✅ Investment Advice:
- New investors: Consider a small allocation to PONKE for higher risk/reward, larger allocation to QNT for stability
- Experienced investors: Balanced approach with both tokens, adjusting based on risk tolerance
- Institutional investors: Focus on QNT for its established presence and interoperability solutions
⚠️ Risk Warning: Cryptocurrency markets are highly volatile. This article does not constitute investment advice. None
VII. FAQ
Q1: What are the main differences between PONKE and QNT? A: PONKE is focused on being an onboarding tool for the Solana ecosystem, while QNT is an interoperability solution for blockchain networks. PONKE has a lower market cap and higher volatility, while QNT is more established with a higher market cap and potential for steady growth.
Q2: Which token has performed better in the recent market? A: QNT has shown more resilience in the recent bear market. While PONKE dropped from $0.846 to $0.02762, QNT fell from $427.42 to around $80, demonstrating better price stability.
Q3: What are the potential advantages of investing in PONKE? A: PONKE has a lower market cap, which could lead to higher percentage gains if the Solana ecosystem grows. It's positioned as the primary onboarding vehicle for Solana, potentially benefiting from the ecosystem's expansion.
Q4: What are the potential advantages of investing in QNT? A: QNT is a more established project with a higher market cap. It focuses on interoperability solutions, which could see steady growth as blockchain adoption increases. QNT may be more attractive to risk-averse and institutional investors.
Q5: How do the supply mechanisms of PONKE and QNT compare? A: Limited information is available regarding the supply mechanisms of both PONKE and QNT. This lack of data makes it difficult to assess how their respective tokenomics might drive price changes.
Q6: What are the key risks associated with investing in PONKE and QNT? A: For PONKE, the main risks include high volatility and dependence on Solana's success. For QNT, risks include potential market saturation in the interoperability sector and competition. Both face regulatory risks as global policies evolve.
Q7: How should investors approach allocating between PONKE and QNT? A: Conservative investors might consider allocating 10% to PONKE and 90% to QNT, while more aggressive investors could opt for 30% PONKE and 70% QNT. The exact allocation should be based on individual risk tolerance and investment goals.
Share
Content
Introduction: PONKE vs QNT Investment Comparison
I. Price History Comparison and Current Market Status
II. Key Metrics Comparison
III. Technical Analysis
IV. Project Fundamentals
V. Recent Developments and Future Outlook
VI. Investment Considerations
Impact Factors on PONKE vs QNT Investment Value
III. 2025-2030 Price Prediction: PONKE vs QNT
IV. Investment Strategy Comparison: PONKE vs QNT
V. Potential Risk Comparison
VI. Conclusion: Which Is the Better Buy?
VII. FAQ

