PORT3 vs BNB: Comparing Two Blockchain Ecosystems for DeFi and NFT Development
Introduction: PORT3 vs BNB Investment Comparison
In the cryptocurrency market, PORT3 vs BNB comparison has always been a topic that investors can't avoid. The two not only have significant differences in market cap ranking, application scenarios, and price performance, but also represent different crypto asset positioning.
Port3 Network (PORT3): Since its launch, it has gained market recognition for its AI data layer network for Web3.
Binance Coin (BNB): Since its inception in 2017, it has been hailed as the fuel for the Binance ecosystem, and is one of the cryptocurrencies with the highest global trading volume and market capitalization.
This article will provide a comprehensive analysis of the investment value comparison between PORT3 and BNB, focusing on historical price trends, supply mechanisms, institutional adoption, technological ecosystems, and future predictions, attempting to answer the question that concerns investors the most:
"Which is the better buy right now?"
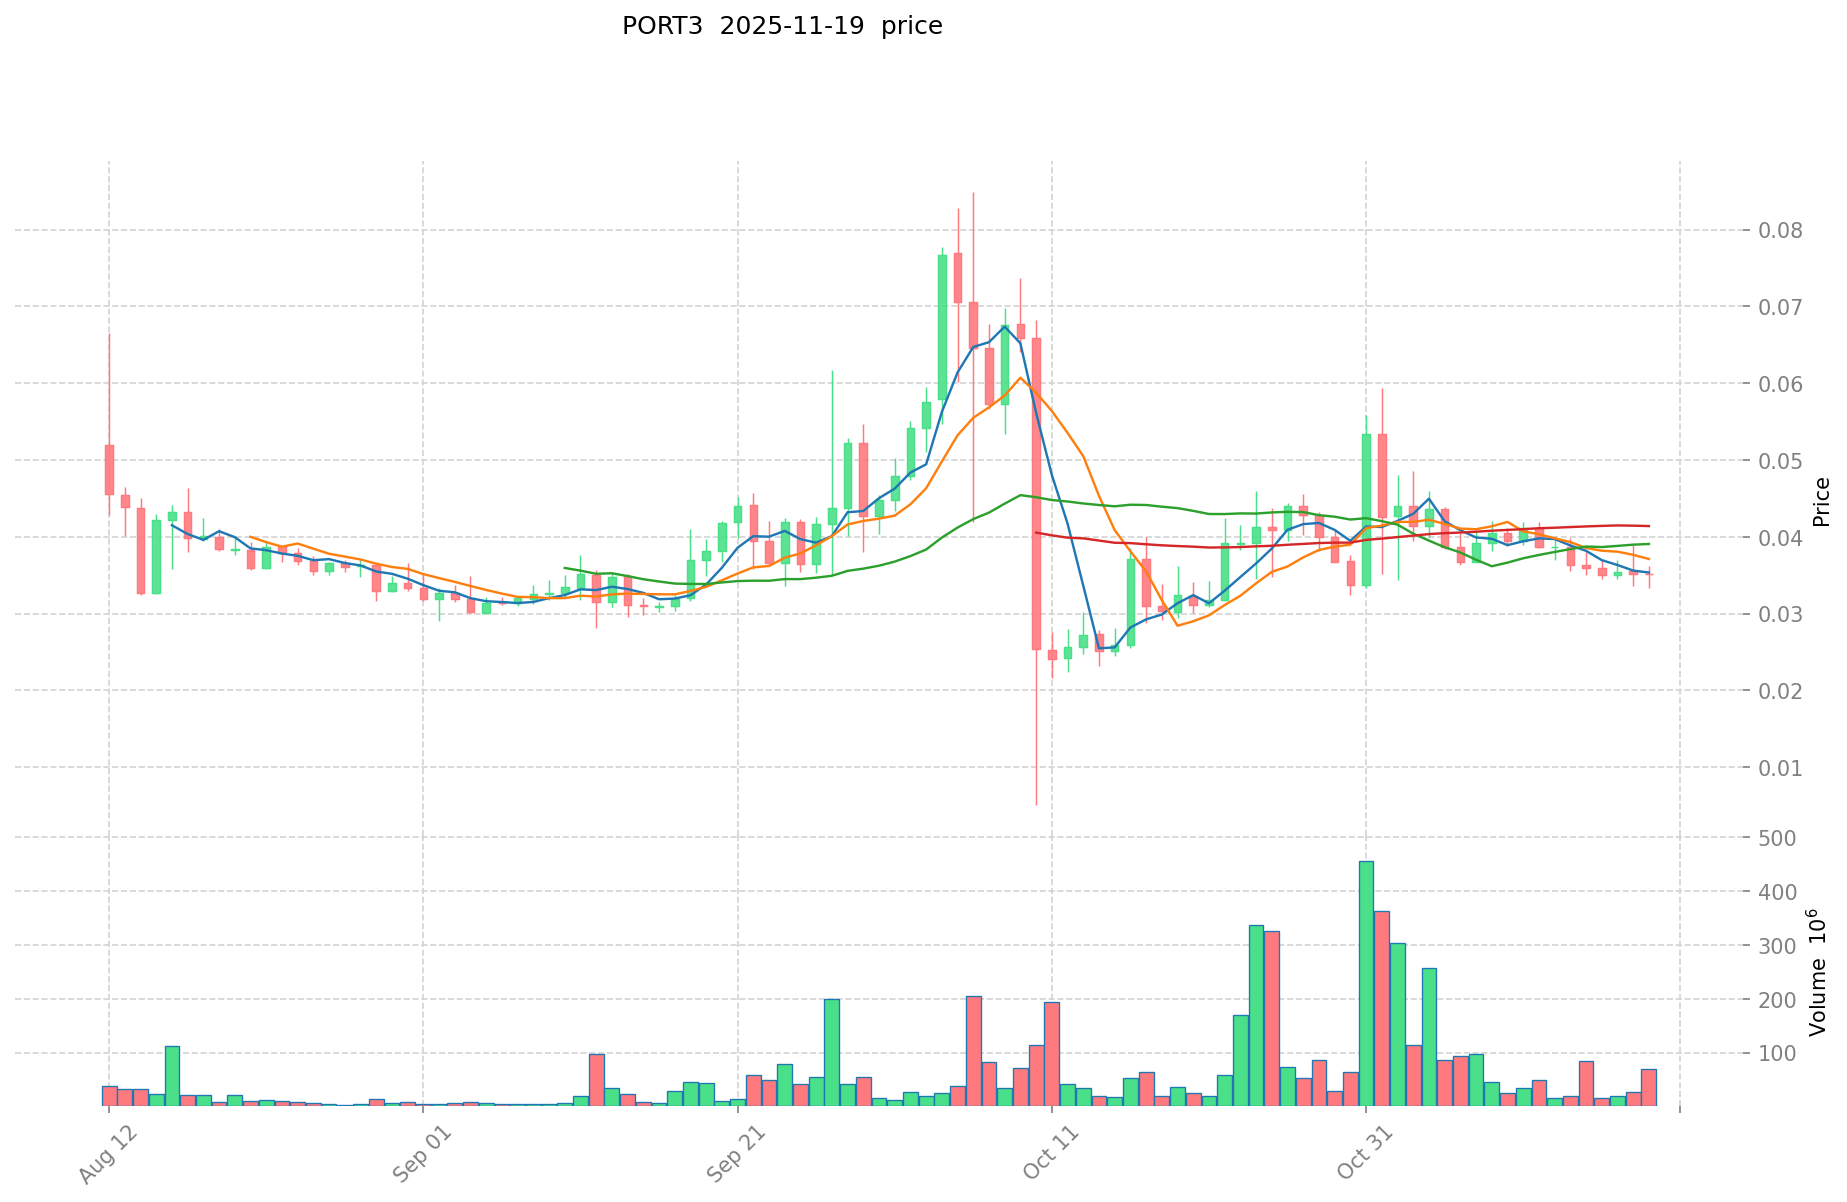
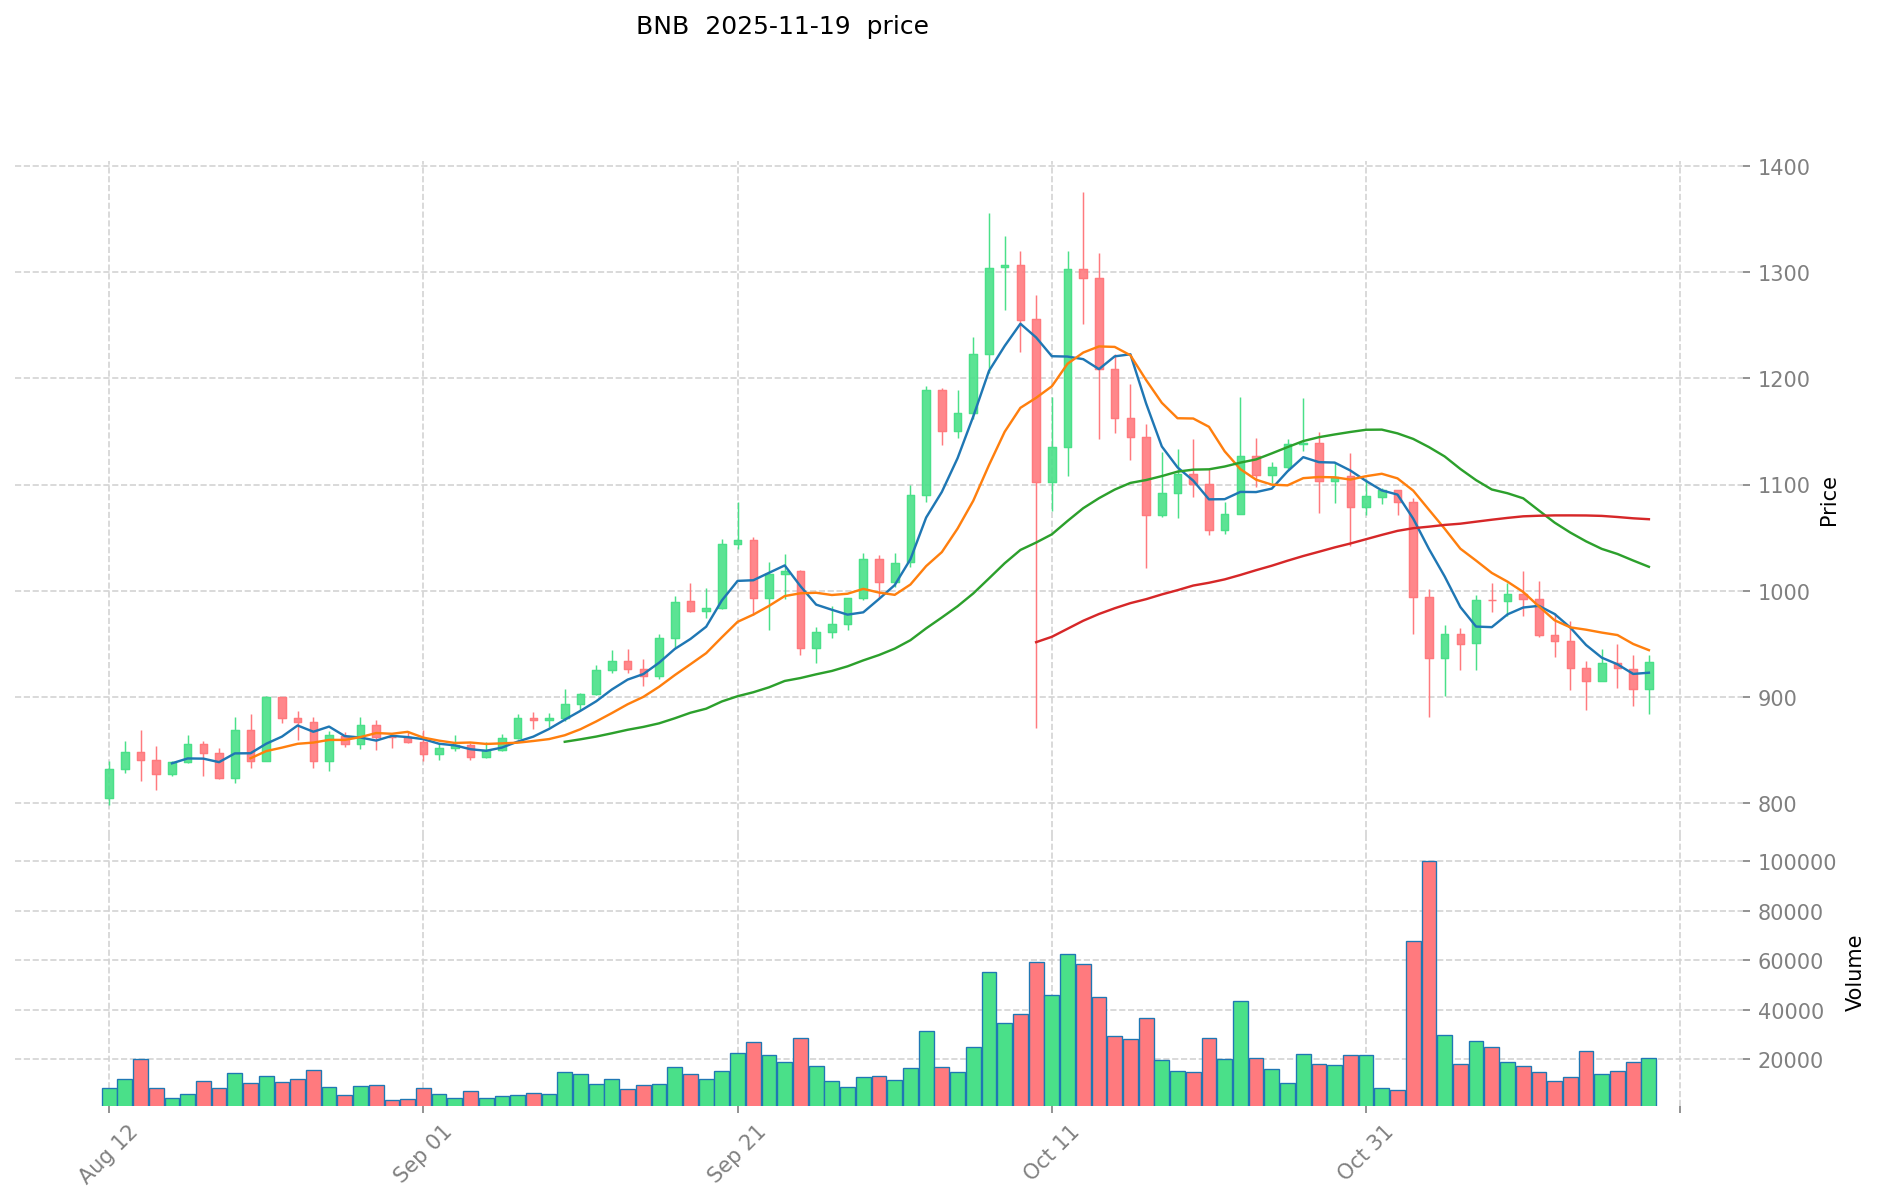
I. Price History Comparison and Current Market Status
PORT3 and BNB Historical Price Trends
- 2024: PORT3 reached an all-time high of $0.33 due to increased adoption.
- 2025: BNB hit a new record high of $1,369.99, driven by the expansion of the Binance ecosystem.
- Comparative analysis: During the recent bull market, PORT3 rose from its low of $0.00501 to $0.03492, while BNB demonstrated stronger performance, climbing from $0.0398177 to $878.8.
Current Market Situation (2025-11-20)
- PORT3 current price: $0.03492
- BNB current price: $878.8
- 24-hour trading volume: $5,757,987 (PORT3) vs $14,531,688,716 (BNB)
- Market Sentiment Index (Fear & Greed Index): 15 (Extreme Fear)
Click to view real-time prices:
- Check PORT3 current price Market Price
- Check BNB current price Market Price
Key Factors Affecting Investment Value of PORT3 vs BNB
Supply Mechanism Comparison (Tokenomics)
- PORT3: Fixed maximum supply of 1 billion tokens with strategic distribution to support long-term network growth
- BNB: Deflationary model with regular token burns that reduce total supply over time
- 📌 Historical pattern: Deflationary models like BNB's have historically supported price stability during market volatility
Institutional Adoption and Market Applications
- Institutional holdings: BNB has stronger institutional support through Binance ecosystem
- Enterprise adoption: PORT3 focuses on data infrastructure services while BNB serves as utility token across Binance's extensive financial services
- Regulatory stance: Both face regulatory uncertainties, with BNB having more regulatory exposure due to its association with Binance exchange
Technical Development and Ecosystem Building
- PORT3 technical upgrades: AI-powered data infrastructure connecting Web2 and Web3, with SoQuest and Rankit as flagship applications
- BNB technical development: Powers the BNB Chain with established DeFi infrastructure and Binance Alpha platform for project incubation
- Ecosystem comparison: BNB has a mature ecosystem with deep liquidity and diverse applications, while PORT3 is building specialized data services for Web3
Macroeconomic Factors and Market Cycles
- Performance during inflation: BNB has demonstrated more resilience due to Binance ecosystem's diversified revenue streams
- Macroeconomic monetary policy: Both tokens show sensitivity to broader crypto market trends influenced by interest rates
- Geopolitical factors: BNB has wider global adoption, while PORT3 is expanding regionally, starting from Korea
III. 2025-2030 Price Prediction: PORT3 vs BNB
Short-term Prediction (2025)
- PORT3: Conservative $0.0300 - $0.0349 | Optimistic $0.0349 - $0.0458
- BNB: Conservative $474.01 - $877.80 | Optimistic $877.80 - $1,044.58
Mid-term Prediction (2027)
- PORT3 may enter a growth phase, with estimated prices ranging from $0.0357 to $0.0565
- BNB may enter a consolidation phase, with estimated prices ranging from $809.70 to $1,319.52
- Key drivers: Institutional capital inflow, ETF, ecosystem development
Long-term Prediction (2030)
- PORT3: Base scenario $0.0565 - $0.0792 | Optimistic scenario $0.0792+
- BNB: Base scenario $1,725.65 - $1,932.73 | Optimistic scenario $1,932.73+
Disclaimer: This analysis is for informational purposes only and should not be considered as financial advice. Cryptocurrency markets are highly volatile and unpredictable. Always conduct your own research before making any investment decisions.
PORT3:
| 年份 | 预测最高价 | 预测平均价格 | 预测最低价 | 涨跌幅 |
|---|---|---|---|---|
| 2025 | 0.0458107 | 0.03497 | 0.0300742 | 0 |
| 2026 | 0.050084034 | 0.04039035 | 0.0286771485 | 15 |
| 2027 | 0.05654649 | 0.045237192 | 0.03573738168 | 29 |
| 2028 | 0.05954345397 | 0.050891841 | 0.03358861506 | 45 |
| 2029 | 0.05797852985925 | 0.055217647485 | 0.0496958827365 | 58 |
| 2030 | 0.079237324140975 | 0.056598088672125 | 0.047542394484585 | 62 |
BNB:
| 年份 | 预测最高价 | 预测平均价格 | 预测最低价 | 涨跌幅 |
|---|---|---|---|---|
| 2025 | 1044.582 | 877.8 | 474.012 | 0 |
| 2026 | 1038.08628 | 961.191 | 893.90763 | 9 |
| 2027 | 1319.5230048 | 999.63864 | 809.7072984 | 13 |
| 2028 | 1704.583808928 | 1159.5808224 | 869.6856168 | 31 |
| 2029 | 2019.23606508624 | 1432.082315664 | 1031.09926727808 | 62 |
| 2030 | 1932.7382932201344 | 1725.65919037512 | 1018.1389223213208 | 96 |
IV. Investment Strategy Comparison: PORT3 vs BNB
Long-term vs Short-term Investment Strategy
- PORT3: Suitable for investors focused on AI and Web3 data infrastructure potential
- BNB: Suitable for investors seeking exposure to a large crypto ecosystem and exchange-related growth
Risk Management and Asset Allocation
- Conservative investors: PORT3: 10% vs BNB: 90%
- Aggressive investors: PORT3: 30% vs BNB: 70%
- Hedging tools: stablecoin allocation, options, cross-currency portfolio
V. Potential Risk Comparison
Market Risk
- PORT3: Higher volatility due to smaller market cap and lower liquidity
- BNB: Exposure to overall crypto market sentiment and Binance exchange performance
Technical Risk
- PORT3: Scalability, network stability
- BNB: Centralization concerns, security vulnerabilities in the BNB Chain
Regulatory Risk
- Global regulatory policies may impact both, with potentially higher scrutiny on BNB due to Binance's prominence
VI. Conclusion: Which Is the Better Buy?
📌 Investment Value Summary:
- PORT3 advantages: Niche focus on AI-powered Web3 data infrastructure, potential for high growth
- BNB advantages: Established ecosystem, strong liquidity, deflationary model
✅ Investment Advice:
- New investors: Consider a smaller allocation to PORT3 for higher risk/reward, larger allocation to BNB for stability
- Experienced investors: Balanced portfolio with both assets, adjusting based on risk tolerance
- Institutional investors: Evaluate PORT3 for long-term potential, BNB for liquidity and ecosystem exposure
⚠️ Risk Warning: The cryptocurrency market is highly volatile. This article does not constitute investment advice. None
VII. FAQ
Q1: What are the main differences between PORT3 and BNB? A: PORT3 is an AI data layer network for Web3, while BNB is the native token of the Binance ecosystem. PORT3 has a smaller market cap and focuses on data infrastructure, whereas BNB has a larger market cap and serves as utility across Binance's financial services.
Q2: Which token has shown better historical price performance? A: BNB has demonstrated stronger historical price performance. During the recent bull market, BNB rose from $0.0398177 to $878.8, while PORT3 increased from $0.00501 to $0.03492.
Q3: How do the supply mechanisms of PORT3 and BNB differ? A: PORT3 has a fixed maximum supply of 1 billion tokens, while BNB follows a deflationary model with regular token burns that reduce the total supply over time.
Q4: What are the key factors affecting the investment value of PORT3 and BNB? A: Key factors include supply mechanisms, institutional adoption, technical development, ecosystem building, macroeconomic factors, and market cycles.
Q5: What are the long-term price predictions for PORT3 and BNB by 2030? A: For PORT3, the base scenario is $0.0565 - $0.0792, with an optimistic scenario of $0.0792+. For BNB, the base scenario is $1,725.65 - $1,932.73, with an optimistic scenario of $1,932.73+.
Q6: How should investors allocate their portfolio between PORT3 and BNB? A: Conservative investors might consider 10% PORT3 and 90% BNB, while aggressive investors might opt for 30% PORT3 and 70% BNB. However, allocations should be adjusted based on individual risk tolerance and investment goals.
Q7: What are the main risks associated with investing in PORT3 and BNB? A: Risks include market volatility, technical challenges (such as scalability for PORT3 and centralization concerns for BNB), and regulatory uncertainties, with potentially higher scrutiny on BNB due to Binance's prominence in the crypto space.
Share
Content
Introduction: PORT3 vs BNB Investment Comparison
I. Price History Comparison and Current Market Status
Key Factors Affecting Investment Value of PORT3 vs BNB
III. 2025-2030 Price Prediction: PORT3 vs BNB
IV. Investment Strategy Comparison: PORT3 vs BNB
V. Potential Risk Comparison
VI. Conclusion: Which Is the Better Buy?
VII. FAQ

