ZEUS vs QNT: The Battle for Blockchain Supremacy in Enterprise Solutions
Introduction: Investment Comparison between ZEUS and QNT
In the cryptocurrency market, the comparison between ZEUS vs QNT has been an unavoidable topic for investors. The two not only show significant differences in market cap ranking, application scenarios, and price performance, but also represent different positioning in the crypto asset space.
Zeus Network (ZEUS): Launched as a cross-chain communication layer implemented on SVM, aiming to introduce Bitcoin liquidity to Solana through its first DApp APOLLO.
Quant (QNT): Since its inception, it has been recognized for solving interoperability through the creation of a global blockchain operating system, Overledger, positioning itself as a leading technology provider for enterprise innovation and blockchain adoption.
This article will comprehensively analyze the investment value comparison between ZEUS vs QNT, focusing on historical price trends, supply mechanisms, institutional adoption, technological ecosystems, and future predictions, attempting to answer the question most concerning to investors:
"Which is the better buy right now?"
I. Price History Comparison and Current Market Status
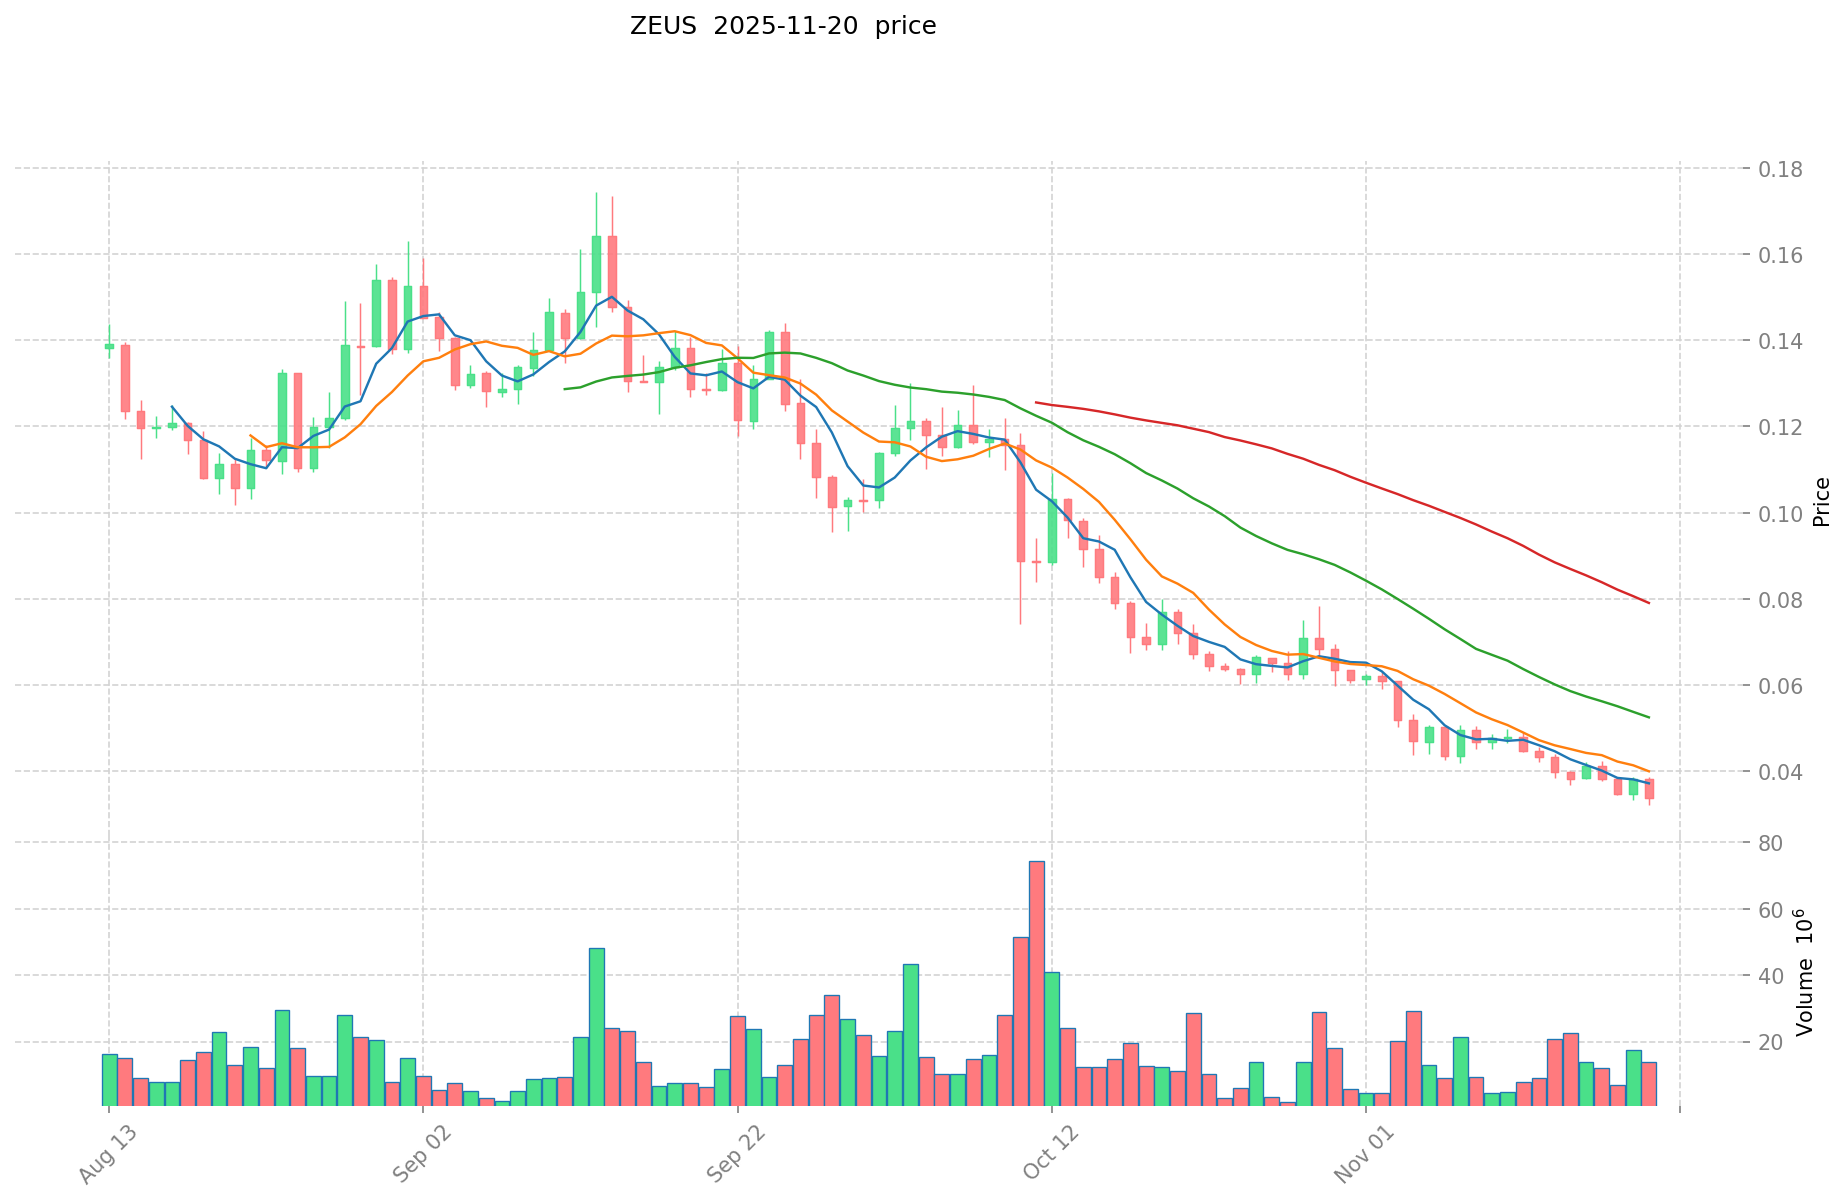
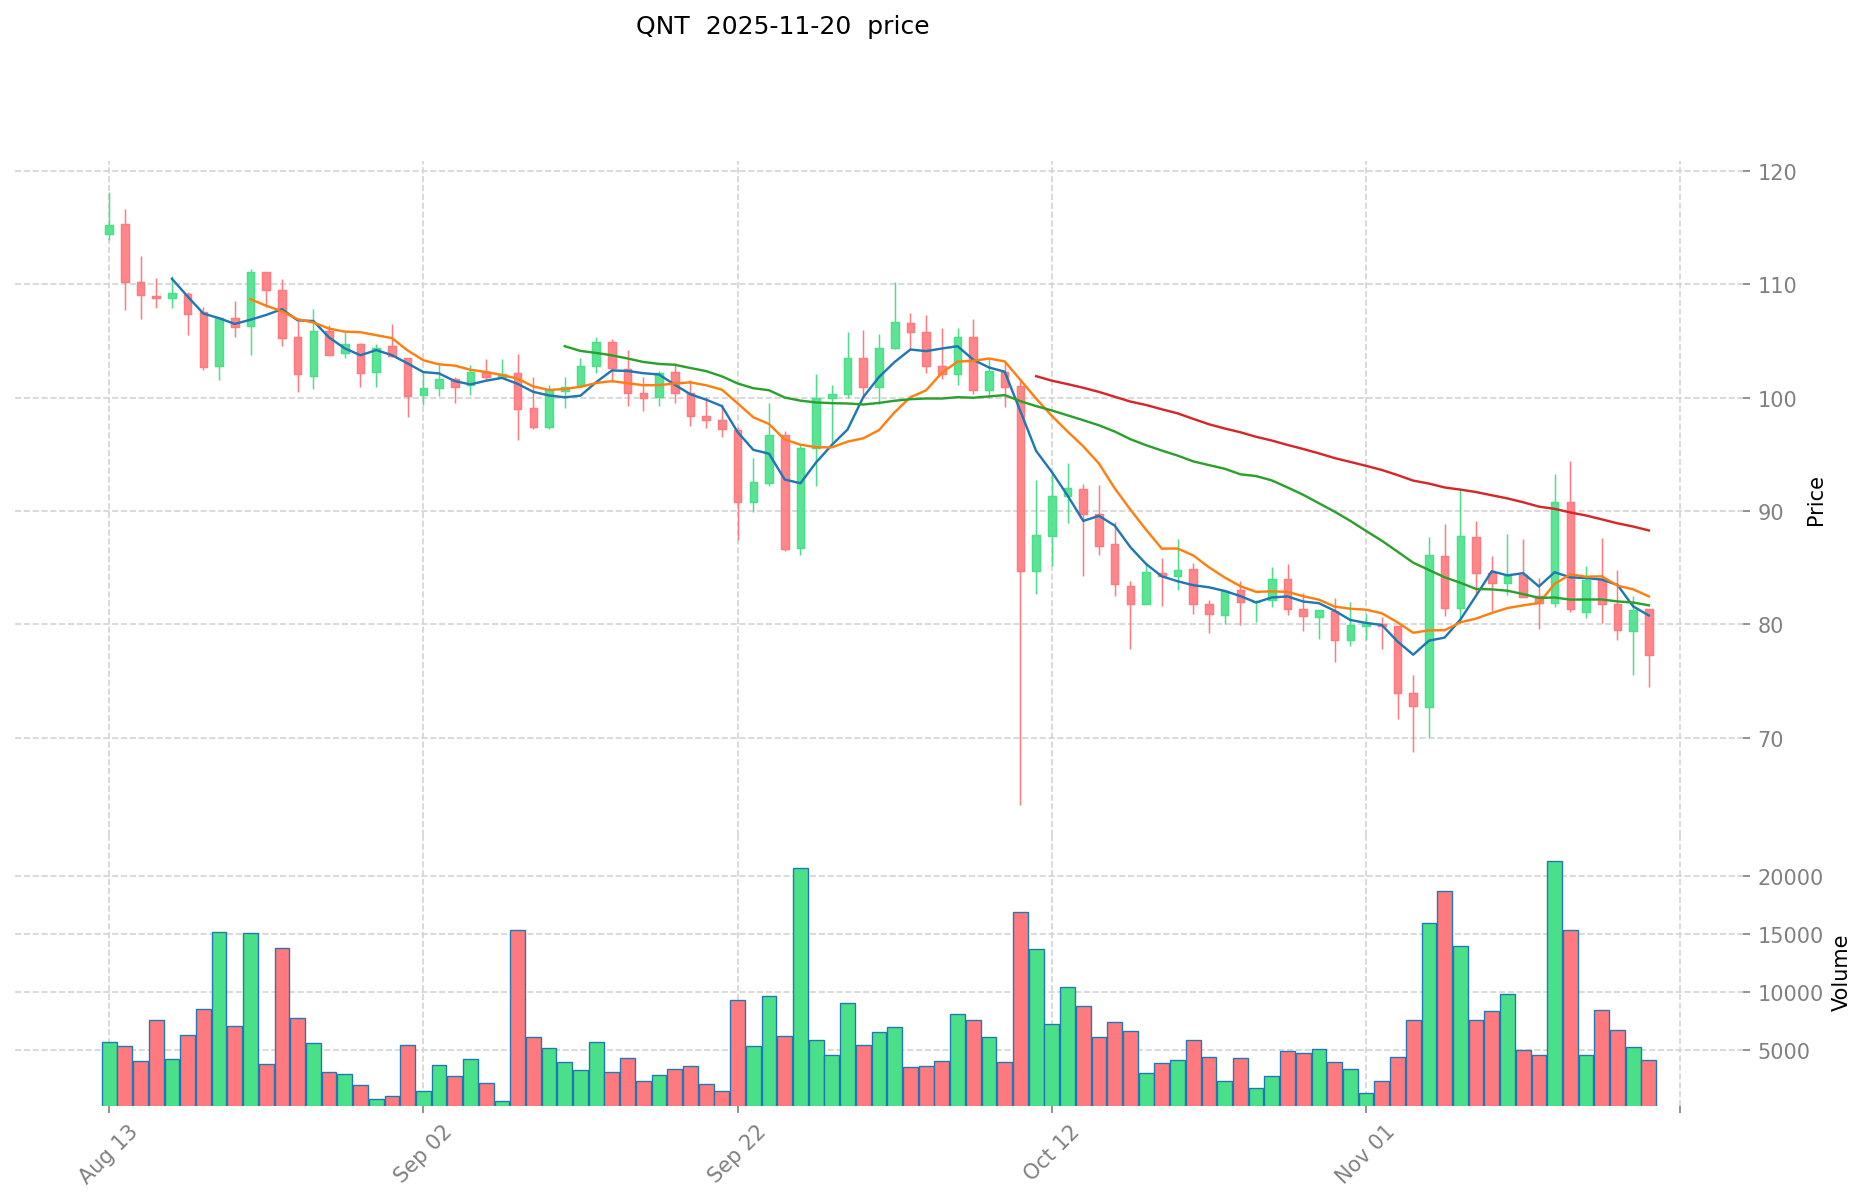
ZEUS (Coin A) and QNT (Coin B) Historical Price Trends
- 2024: ZEUS reached its all-time high of $1.1485 on April 8, 2024.
- 2021: QNT hit its all-time high of $427.42 on September 11, 2021.
- Comparative analysis: In the current market cycle, ZEUS has dropped from its high of $1.1485 to a low of $0.03206, while QNT has declined from its peak of $427.42 to its current price of $77.18.
Current Market Situation (2025-11-20)
- ZEUS current price: $0.03459
- QNT current price: $77.18
- 24-hour trading volume: ZEUS $570,655.18 vs QNT $509,739.50
- Market Sentiment Index (Fear & Greed Index): 11 (Extreme Fear)
Click to view real-time prices:
- Check ZEUS current price Market Price
- Check QNT current price Market Price
II. Core Factors Influencing the Investment Value of ZEUS vs QNT
Supply Mechanisms Comparison (Tokenomics)
- ZEUS: Inflationary supply model with an initial max supply of 15,000,000 tokens and emissions that decrease over time
- QNT: Fixed supply of 14,612,493 tokens with a deflationary mechanism through token burning during network usage
- 📌 Historical pattern: Limited supply assets like QNT tend to experience greater price appreciation during bull markets, while ZEUS's decreasing emission model aims to balance growth with sustainability.
Institutional Adoption and Market Applications
- Institutional holdings: QNT has gained more institutional interest with adoption by major financial institutions through its Overledger platform
- Enterprise adoption: QNT has secured partnerships with Oracle, SIA, and government institutions for interoperability solutions, while ZEUS is expanding through decentralized oracle networks
- Regulatory attitudes: QNT benefits from regulatory clarity in various jurisdictions due to its enterprise focus, while ZEUS faces varying regulatory environments globally
Technical Development and Ecosystem Building
- ZEUS technical upgrades: Layer-1 blockchain with high throughput capabilities and oracle functionality focused on data reliability
- QNT technical development: Overledger operating system enabling multi-DLT interoperability and enterprise blockchain solutions
- Ecosystem comparison: QNT has stronger enterprise integration and payment systems, while ZEUS focuses on decentralized oracle networks and DeFi applications
Macroeconomic Factors and Market Cycles
- Performance in inflationary environments: QNT's fixed supply model provides better store of value properties during inflation
- Macroeconomic monetary policy: Both assets show sensitivity to interest rate changes and USD strength, with QNT historically showing more resilience
- Geopolitical factors: QNT's enterprise solutions for cross-border transactions offer advantages during geopolitical uncertainty
III. 2025-2030 Price Prediction: ZEUS vs QNT
Short-term Prediction (2025)
- ZEUS: Conservative $0.0213032 - $0.03436 | Optimistic $0.03436 - $0.0402012
- QNT: Conservative $55.0728 - $76.49 | Optimistic $76.49 - $79.5496
Mid-term Prediction (2027)
- ZEUS may enter a growth phase, with expected prices ranging from $0.03406514825 to $0.05330193785
- QNT may enter a steady growth phase, with expected prices ranging from $63.8982162 to $90.112869
- Key drivers: Institutional capital inflow, ETF, ecosystem development
Long-term Prediction (2030)
- ZEUS: Base scenario $0.061629864681 - $0.0554668782129 | Optimistic scenario $0.061629864681 - $0.08566551190659
- QNT: Base scenario $81.99240310659825 - $98.786027839275 | Optimistic scenario $98.786027839275 - $104.7131895096315
Disclaimer: This analysis is based on historical data and projections. Cryptocurrency markets are highly volatile and unpredictable. This information should not be considered as financial advice. Always conduct your own research before making investment decisions.
ZEUS:
| 年份 | 预测最高价 | 预测平均价格 | 预测最低价 | 涨跌幅 |
|---|---|---|---|---|
| 2025 | 0.0402012 | 0.03436 | 0.0213032 | 0 |
| 2026 | 0.04287269 | 0.0372806 | 0.031315704 | 7 |
| 2027 | 0.05330193785 | 0.040076645 | 0.03406514825 | 15 |
| 2028 | 0.065365007995 | 0.046689291425 | 0.03875211188275 | 34 |
| 2029 | 0.067232579652 | 0.05602714971 | 0.0347368328202 | 61 |
| 2030 | 0.08566551190659 | 0.061629864681 | 0.0554668782129 | 78 |
QNT:
| 年份 | 预测最高价 | 预测平均价格 | 预测最低价 | 涨跌幅 |
|---|---|---|---|---|
| 2025 | 79.5496 | 76.49 | 55.0728 | 0 |
| 2026 | 85.82178 | 78.0198 | 67.877226 | 1 |
| 2027 | 90.112869 | 81.92079 | 63.8982162 | 6 |
| 2028 | 105.800700285 | 86.0168295 | 78.275314845 | 11 |
| 2029 | 101.66329078605 | 95.9087648925 | 78.64518721185 | 24 |
| 2030 | 104.7131895096315 | 98.786027839275 | 81.99240310659825 | 27 |
IV. Investment Strategy Comparison: ZEUS vs QNT
Long-term vs Short-term Investment Strategies
- ZEUS: Suitable for investors focused on DeFi potential and cross-chain liquidity
- QNT: Suitable for investors seeking enterprise adoption and interoperability solutions
Risk Management and Asset Allocation
- Conservative investors: ZEUS: 20% vs QNT: 80%
- Aggressive investors: ZEUS: 40% vs QNT: 60%
- Hedging tools: Stablecoin allocation, options, cross-currency portfolios
V. Potential Risk Comparison
Market Risks
- ZEUS: Higher volatility due to newer project status and smaller market cap
- QNT: Dependence on enterprise adoption and market cycles
Technical Risks
- ZEUS: Scalability, network stability
- QNT: Centralization concerns, potential security vulnerabilities
Regulatory Risks
- Global regulatory policies have different impacts on both assets, with QNT potentially facing less scrutiny due to its enterprise focus
VI. Conclusion: Which Is the Better Buy?
📌 Investment Value Summary:
- ZEUS advantages: Cross-chain communication, Bitcoin liquidity on Solana, potential for rapid growth
- QNT advantages: Established enterprise partnerships, interoperability solutions, fixed supply tokenomics
✅ Investment Advice:
- New investors: Consider a balanced approach with a slight bias towards QNT for its established market presence
- Experienced investors: Explore a diversified portfolio including both assets, with allocation based on risk tolerance
- Institutional investors: Focus on QNT for its enterprise solutions and regulatory clarity, while monitoring ZEUS for potential growth opportunities
⚠️ Risk Warning: The cryptocurrency market is highly volatile. This article does not constitute investment advice. None
VII. FAQ
Q1: What are the main differences between ZEUS and QNT? A: ZEUS is a cross-chain communication layer on Solana, focusing on Bitcoin liquidity, while QNT is an enterprise-focused interoperability solution. ZEUS has an inflationary supply model, while QNT has a fixed supply with deflationary mechanisms.
Q2: Which coin has performed better historically? A: QNT reached its all-time high of $427.42 in September 2021, while ZEUS peaked at $1.1485 in April 2024. However, both have experienced significant declines since their peaks.
Q3: How do their market applications differ? A: QNT has gained more institutional adoption and enterprise partnerships, including Oracle and SIA. ZEUS is expanding through decentralized oracle networks and DeFi applications on Solana.
Q4: What are the price predictions for ZEUS and QNT by 2030? A: For ZEUS, the base scenario predicts $0.061629864681 - $0.0554668782129, with an optimistic scenario of up to $0.08566551190659. For QNT, the base scenario predicts $81.99240310659825 - $98.786027839275, with an optimistic scenario up to $104.7131895096315.
Q5: How should investors approach ZEUS and QNT in their portfolio? A: Conservative investors might consider allocating 20% to ZEUS and 80% to QNT, while aggressive investors might opt for 40% ZEUS and 60% QNT. The specific allocation should be based on individual risk tolerance and investment goals.
Q6: What are the main risks associated with investing in ZEUS and QNT? A: ZEUS faces higher volatility and technical risks due to its newer status. QNT's main risks include dependence on enterprise adoption and potential centralization concerns. Both face regulatory risks, though QNT may have less scrutiny due to its enterprise focus.
Q7: Which coin might be better for different types of investors? A: New investors might prefer a balanced approach with a slight bias towards QNT. Experienced investors could explore a diversified portfolio including both assets. Institutional investors may focus more on QNT due to its enterprise solutions and regulatory clarity.
Share
Content
Introduction: Investment Comparison between ZEUS and QNT
I. Price History Comparison and Current Market Status
II. Core Factors Influencing the Investment Value of ZEUS vs QNT
III. 2025-2030 Price Prediction: ZEUS vs QNT
IV. Investment Strategy Comparison: ZEUS vs QNT
V. Potential Risk Comparison
VI. Conclusion: Which Is the Better Buy?
VII. FAQ

