#Gate广场五月交易分享 #BTC重返8万 Bitcoin Returns to the 80k Level: A New Market Pattern of Institutional Funds Inflow Coexisting with Altcoin Cleanup!
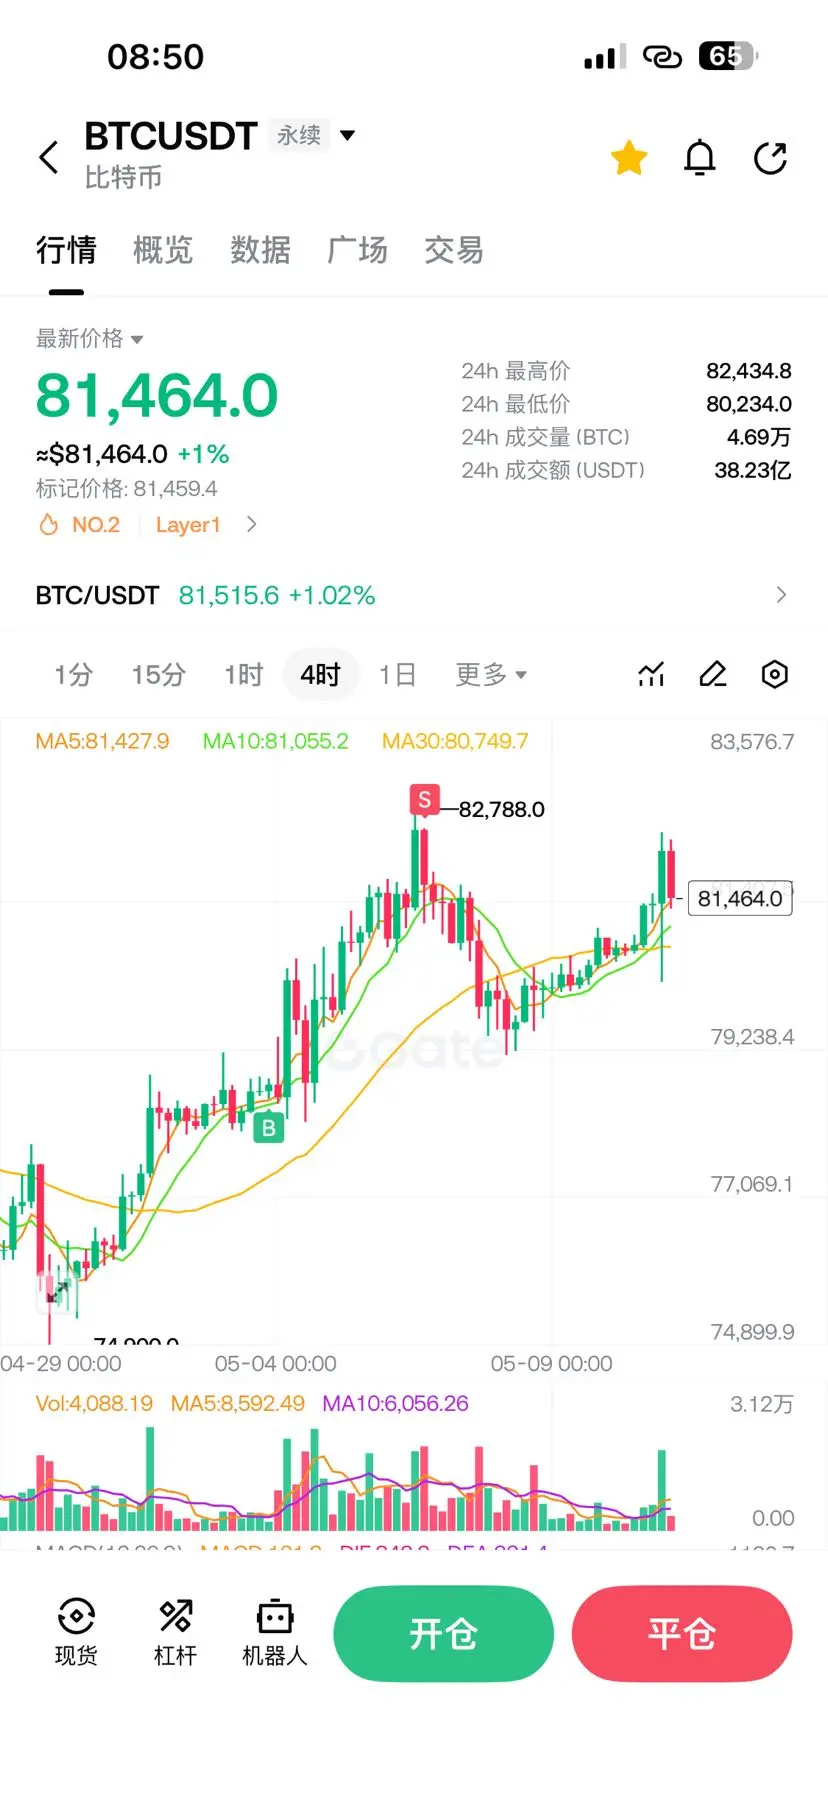
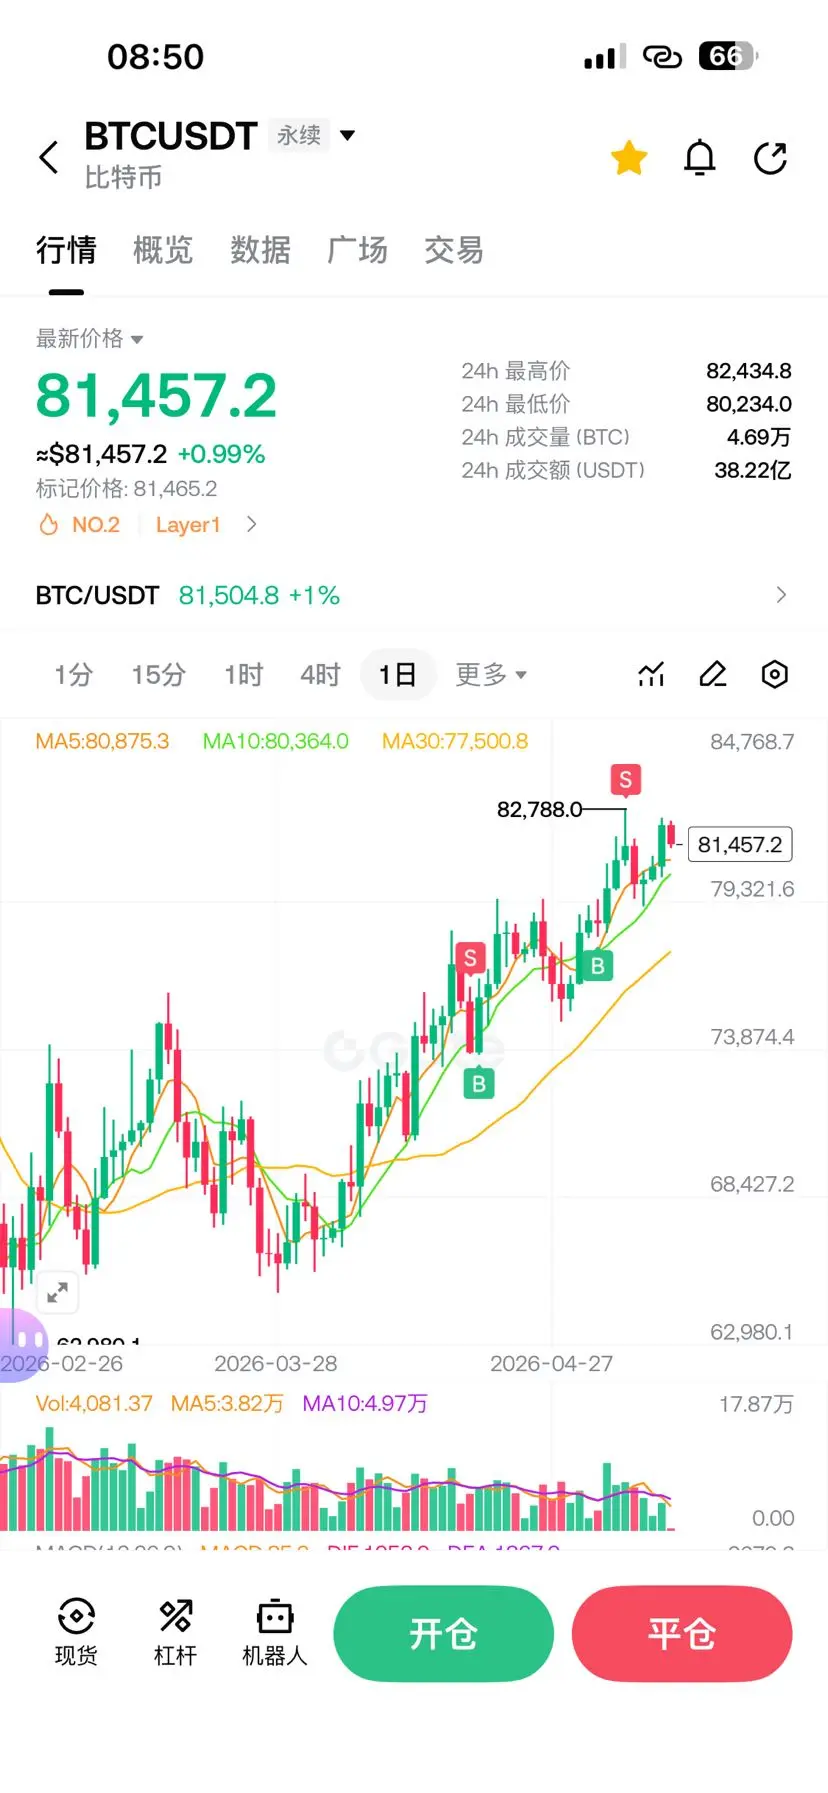
In early May 2026, Bitcoin strongly broke through the $80k psychological barrier, reaching a new high since February of this year, with a monthly increase of over 20%. The core driving force behind this rally comes from the continuous net inflow of the US spot Bitcoin ETF—$2.44 billion in April alone, setting a record for the year—while large whales have increased their holdings by about 270k BTC over the past month, exchange reserves have fallen to multi-year lows, and supply-demand dynamics continue to tighten. However, the market shows a clear pattern of "Bitcoin dominance, Ethereum following the rise, and altcoin divergence," with BitM founder Arthur Hayes publicly warning at Consensus Miami 2026 that 99% of altcoins will eventually go to zero.
Against the macro backdrop of the Federal Reserve maintaining interest rates in the 3.5%-3.75% range, unresolved US-Iran conflicts, and the new Fed chair’s unclear policy style, the crypto market is at a critical decision point. This article provides an in-depth analysis from four dimensions: macro liquidity, on-chain data, technical structure, and sector rotation, along with corresponding operational strategies and risk management suggestions.
1. Macro Environment: The Battle Between Liquidity Expectations and Geopolitical Risks
The current global macro environment has a dual impact on crypto assets. On one hand, the Fed has maintained interest rates between 3.5% and 3.75% since the beginning of the year, with market expectations leaning toward easing monetary policy; OECD forecasts that by the end of 2026, the Fed may cut rates to 3.25%-3.5%. The relative weakness of the dollar provides risk assets with breathing room, and Bitcoin’s narrative as "digital gold" has regained institutional favor. The total market cap of stablecoins has surpassed $306.7 billion, with USDT accounting for over 60%, indicating ongoing inflows of off-chain funds into the crypto ecosystem. On the other hand, uncertainty is accumulating. Economist Pan Helin pointed out that if the US-Iran conflict becomes prolonged, it may force global central banks to raise interest rates to control inflation, directly impacting the liquidity-dependent crypto market. Additionally, the appointment of new Fed Chair Kevin Woorch could change the communication style and policy pace of the Fed, which the market has not fully priced in. Wang Peng, a deputy researcher at Beijing Academy of Social Sciences, also warned that high leverage positions in the market could trigger large-scale liquidations once macro expectations reverse.
2. Bitcoin: Structural Bullishness Built by ETF Funds and Whale Accumulation
Bitcoin’s recent break above $80,000 is not a mere rebound but the result of institutional allocation needs and on-chain supply-demand imbalance. Data shows that US spot Bitcoin ETFs recorded a net inflow of about $2.44 billion in April, the highest monthly inflow since 2026; after entering May, the inflow momentum continued, with a single-day net inflow of $532 million on May 4, mainly contributed by BlackRock’s IBIT and Fidelity’s FBTC. This sustained, large-scale, institutionalized capital inflow signals Bitcoin’s transition from a speculative asset to a regular component of institutional portfolios. On-chain data further confirms the tightening supply trend. Monitored data shows that whale groups have accumulated about 270k BTC over the past month, while exchange reserves continue to decline to multi-year lows. This indicates that circulating supply available for trading is decreasing, while absorption by institutions and long-term holders is increasing. MicroStrategy founder Michael Saylor publicly called on May 7 to "buy more than sell," reflecting the prevailing institutional sentiment.
From a market structure perspective, Bitcoin’s dominance has rebounded to the 58.91%-61% range, with funds clearly concentrating in leading assets. This "Bitcoin siphoning" pattern is typical in mid-cycle bull markets—when macro uncertainty is high, funds tend to retreat into the most liquid and narratively clear assets.
3. Ethereum and Altcoins: Increasing Divergence, Distinguishing True from False
Compared to Bitcoin’s strength, Ethereum shows a moderate follow-up trend. ETH’s rise relies more on continuous on-chain ecosystem iterations and the maturity of Layer 2 networks rather than pure speculative capital. However, the persistent weakness of the ETH/BTC ratio indicates that, in the current phase dominated by institutional funds, Ethereum has not yet achieved the same level of allocation priority as Bitcoin.
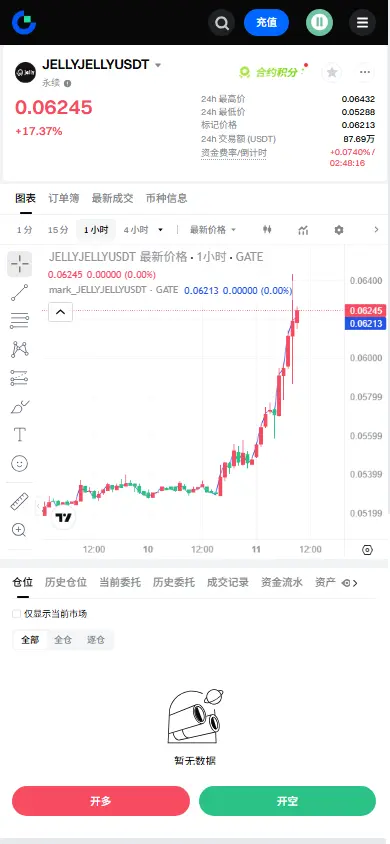
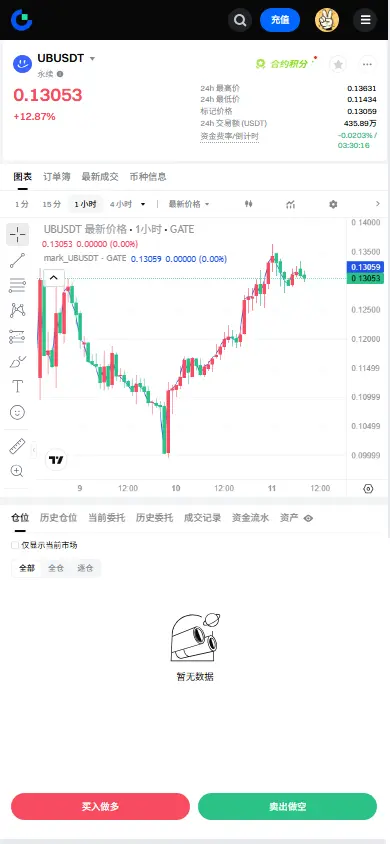
The altcoin market shows extreme divergence. On one hand, some sector leaders perform well: AI concept SkyAI surged 358% in seven days; privacy coin Dash broke a six-month downtrend; RWA (Real-World Asset) sector’s Ondo Finance emerged from a three-month sideways consolidation. These tokens’ gains are supported by clear narratives and technical breakthroughs. On the other hand, market cleansing signals are also strong. Hayes at Consensus Miami 2026 openly stated that 99% of altcoins will eventually go to zero, considering this a normal market cleansing process. This judgment aligns with the current trend of capital concentration in top assets. For investors, altcoin investing has shifted from "broadly spreading" to "deep fundamental research," with projects lacking real income, active developer communities, and regulatory compliance gradually phased out.
4. Key Technical Levels and Market Sentiment Analysis
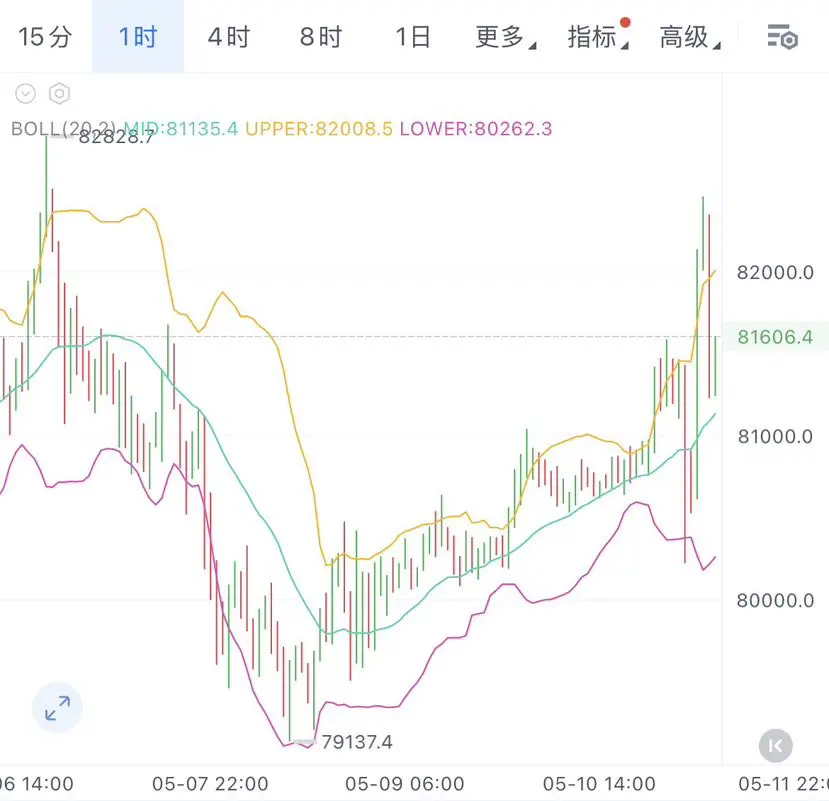
From a technical perspective, Bitcoin is at a critical decision point. The average cost basis of new whales (entities that accumulated within the past 155 days) is around $80,300, meaning current prices are near the breakeven point for these large participants. If Bitcoin can hold above $82,000 steadily, it may open the path toward $85,000; according to Glassnode, significant structural resistance exists near $85,200, seen as a medium-term "ceiling." Breaking this resistance could target $90,000, with a further challenge to the psychological $100k mark under favorable conditions.
Downside risks are also significant. Key support levels are at $78,000, $76,000, and $74,300. If prices fall below $74,300, the short-term uptrend could fail, and the market may retest $70,000 or even the deeper support at $56,000.
Notably, Santiment data shows that Bitcoin holders are decreasing at the fastest rate in nearly two years, with about 245k wallets reduced over five days, mainly due to retail profit-taking during the rally. The shift from retail to institutional accumulation is often seen as a medium-term bullish signal, but it also suggests increased short-term volatility.
5. Trading Strategies and Risk Management
Based on the above analysis, we propose layered trading strategies: for Bitcoin holders: if already holding low-cost positions, use $78,000 as a short-term trend stop-loss; if prices hold above $82,000, consider adding positions toward $90,000-$100k. Pay close attention to daily fund flows of spot ETFs—if large net outflows occur consecutively, beware of a shift in institutional sentiment.
For Ethereum investors: currently, ETH acts more as a "beta asset." It’s advisable to keep its allocation within 20%-30% of total crypto holdings, focusing on its relative rebound against Bitcoin. On-chain activity and Layer 2 ecosystem development are key indicators of whether its independent rally can start.
For altcoin participants: strictly follow the "distinguish true from false" principle, concentrating positions in three to five leading projects with genuine fundamentals, such as RWA, AI infrastructure, and privacy sectors. Avoid investing in purely speculative tokens without narratives. Hayes’ "99% will go to zero" warning should be viewed as a risk alert—set strict stop-losses, and no single project should exceed 5% of total funds.
Macro hedging: considering US-Iran tensions and Fed policy uncertainty, keep 20%-30% in cash or stablecoins to enable bottom-fishing during irrational declines. Avoid holding highly leveraged positions overnight; in the current environment, 10%-20% price corrections can occur within hours.
6. Future Outlook and Predictions
Looking ahead to mid-to-late May and the second quarter, we believe Bitcoin will likely trade within a broad range of $74,000 to $90,000, with the direction depending on three variables: the sustainability of ETF fund inflows, the tone of the June Fed meeting, and the evolution of geopolitical tensions.
Baseline scenario (50% probability): Bitcoin stabilizes above $82,000 before the end of May, and from June to July, it targets $90,000, but faces strong selling pressure near the 2025 high of $126,272, making a full breakout of the all-time high unlikely at this stage.
Optimistic scenario (30% probability): If the Fed signals clear rate cuts and geopolitical conflicts ease, Bitcoin could break $100k in Q3 and challenge the $110,000-$120,000 range.
Pessimistic scenario (20% probability): If inflation data rebounds, prompting the Fed to stay hawkish, or if Middle East tensions escalate sharply, Bitcoin could retreat below $70,000, testing the key long-term support at $65,000.
For the altcoin market, we maintain the view of "divergence and cleansing in a structural bull market." Bitcoin dominance is expected to remain high over the next one to two months, and the real "altcoin season" will only arrive after Bitcoin completes sufficient rotation at high levels and market confidence fully recovers. During this period, only projects with institutional backing, compliance frameworks, and genuine cash flow will survive the cycle.
Conclusion: The crypto market in May 2026 is at a critical turning point of institutionalization and de-bubbling. Bitcoin’s ETF narrative and whale accumulation provide solid mid-term support, but macro policy uncertainties and geopolitical risks remain threats overhead. For investors, this is neither a time of full bullish euphoria nor a panic exit, but a period requiring more refined, institutionalized risk management, and rational valuation of true value.
In early May 2026, Bitcoin strongly broke through the $80k psychological barrier, reaching a new high since February of this year, with a monthly increase of over 20%. The core driving force behind this rally comes from the continuous net inflow of the US spot Bitcoin ETF—$2.44 billion in April alone, setting a record for the year—while large whales have increased their holdings by about 270k BTC over the past month, exchange reserves have fallen to multi-year lows, and supply-demand dynamics continue to tighten. However, the market shows a clear pattern of "Bitcoin dominance, Ethereum following the rise, and altcoin divergence," with BitM founder Arthur Hayes publicly warning at Consensus Miami 2026 that 99% of altcoins will eventually go to zero.
Against the macro backdrop of the Federal Reserve maintaining interest rates in the 3.5%-3.75% range, unresolved US-Iran conflicts, and the new Fed chair’s unclear policy style, the crypto market is at a critical decision point. This article provides an in-depth analysis from four dimensions: macro liquidity, on-chain data, technical structure, and sector rotation, along with corresponding operational strategies and risk management suggestions.
1. Macro Environment: The Battle Between Liquidity Expectations and Geopolitical Risks
The current global macro environment has a dual impact on crypto assets. On one hand, the Fed has maintained interest rates between 3.5% and 3.75% since the beginning of the year, with market expectations leaning toward easing monetary policy; OECD forecasts that by the end of 2026, the Fed may cut rates to 3.25%-3.5%. The relative weakness of the dollar provides risk assets with breathing room, and Bitcoin’s narrative as "digital gold" has regained institutional favor. The total market cap of stablecoins has surpassed $306.7 billion, with USDT accounting for over 60%, indicating ongoing inflows of off-chain funds into the crypto ecosystem. On the other hand, uncertainty is accumulating. Economist Pan Helin pointed out that if the US-Iran conflict becomes prolonged, it may force global central banks to raise interest rates to control inflation, directly impacting the liquidity-dependent crypto market. Additionally, the appointment of new Fed Chair Kevin Woorch could change the communication style and policy pace of the Fed, which the market has not fully priced in. Wang Peng, a deputy researcher at Beijing Academy of Social Sciences, also warned that high leverage positions in the market could trigger large-scale liquidations once macro expectations reverse.
2. Bitcoin: Structural Bullishness Built by ETF Funds and Whale Accumulation
Bitcoin’s recent break above $80,000 is not a mere rebound but the result of institutional allocation needs and on-chain supply-demand imbalance. Data shows that US spot Bitcoin ETFs recorded a net inflow of about $2.44 billion in April, the highest monthly inflow since 2026; after entering May, the inflow momentum continued, with a single-day net inflow of $532 million on May 4, mainly contributed by BlackRock’s IBIT and Fidelity’s FBTC. This sustained, large-scale, institutionalized capital inflow signals Bitcoin’s transition from a speculative asset to a regular component of institutional portfolios. On-chain data further confirms the tightening supply trend. Monitored data shows that whale groups have accumulated about 270k BTC over the past month, while exchange reserves continue to decline to multi-year lows. This indicates that circulating supply available for trading is decreasing, while absorption by institutions and long-term holders is increasing. MicroStrategy founder Michael Saylor publicly called on May 7 to "buy more than sell," reflecting the prevailing institutional sentiment.
From a market structure perspective, Bitcoin’s dominance has rebounded to the 58.91%-61% range, with funds clearly concentrating in leading assets. This "Bitcoin siphoning" pattern is typical in mid-cycle bull markets—when macro uncertainty is high, funds tend to retreat into the most liquid and narratively clear assets.
3. Ethereum and Altcoins: Increasing Divergence, Distinguishing True from False
Compared to Bitcoin’s strength, Ethereum shows a moderate follow-up trend. ETH’s rise relies more on continuous on-chain ecosystem iterations and the maturity of Layer 2 networks rather than pure speculative capital. However, the persistent weakness of the ETH/BTC ratio indicates that, in the current phase dominated by institutional funds, Ethereum has not yet achieved the same level of allocation priority as Bitcoin.
The altcoin market shows extreme divergence. On one hand, some sector leaders perform well: AI concept SkyAI surged 358% in seven days; privacy coin Dash broke a six-month downtrend; RWA (Real-World Asset) sector’s Ondo Finance emerged from a three-month sideways consolidation. These tokens’ gains are supported by clear narratives and technical breakthroughs. On the other hand, market cleansing signals are also strong. Hayes at Consensus Miami 2026 openly stated that 99% of altcoins will eventually go to zero, considering this a normal market cleansing process. This judgment aligns with the current trend of capital concentration in top assets. For investors, altcoin investing has shifted from "broadly spreading" to "deep fundamental research," with projects lacking real income, active developer communities, and regulatory compliance gradually phased out.
4. Key Technical Levels and Market Sentiment Analysis
From a technical perspective, Bitcoin is at a critical decision point. The average cost basis of new whales (entities that accumulated within the past 155 days) is around $80,300, meaning current prices are near the breakeven point for these large participants. If Bitcoin can hold above $82,000 steadily, it may open the path toward $85,000; according to Glassnode, significant structural resistance exists near $85,200, seen as a medium-term "ceiling." Breaking this resistance could target $90,000, with a further challenge to the psychological $100k mark under favorable conditions.
Downside risks are also significant. Key support levels are at $78,000, $76,000, and $74,300. If prices fall below $74,300, the short-term uptrend could fail, and the market may retest $70,000 or even the deeper support at $56,000.
Notably, Santiment data shows that Bitcoin holders are decreasing at the fastest rate in nearly two years, with about 245k wallets reduced over five days, mainly due to retail profit-taking during the rally. The shift from retail to institutional accumulation is often seen as a medium-term bullish signal, but it also suggests increased short-term volatility.
5. Trading Strategies and Risk Management
Based on the above analysis, we propose layered trading strategies: for Bitcoin holders: if already holding low-cost positions, use $78,000 as a short-term trend stop-loss; if prices hold above $82,000, consider adding positions toward $90,000-$100k. Pay close attention to daily fund flows of spot ETFs—if large net outflows occur consecutively, beware of a shift in institutional sentiment.
For Ethereum investors: currently, ETH acts more as a "beta asset." It’s advisable to keep its allocation within 20%-30% of total crypto holdings, focusing on its relative rebound against Bitcoin. On-chain activity and Layer 2 ecosystem development are key indicators of whether its independent rally can start.
For altcoin participants: strictly follow the "distinguish true from false" principle, concentrating positions in three to five leading projects with genuine fundamentals, such as RWA, AI infrastructure, and privacy sectors. Avoid investing in purely speculative tokens without narratives. Hayes’ "99% will go to zero" warning should be viewed as a risk alert—set strict stop-losses, and no single project should exceed 5% of total funds.
Macro hedging: considering US-Iran tensions and Fed policy uncertainty, keep 20%-30% in cash or stablecoins to enable bottom-fishing during irrational declines. Avoid holding highly leveraged positions overnight; in the current environment, 10%-20% price corrections can occur within hours.
6. Future Outlook and Predictions
Looking ahead to mid-to-late May and the second quarter, we believe Bitcoin will likely trade within a broad range of $74,000 to $90,000, with the direction depending on three variables: the sustainability of ETF fund inflows, the tone of the June Fed meeting, and the evolution of geopolitical tensions.
Baseline scenario (50% probability): Bitcoin stabilizes above $82,000 before the end of May, and from June to July, it targets $90,000, but faces strong selling pressure near the 2025 high of $126,272, making a full breakout of the all-time high unlikely at this stage.
Optimistic scenario (30% probability): If the Fed signals clear rate cuts and geopolitical conflicts ease, Bitcoin could break $100k in Q3 and challenge the $110,000-$120,000 range.
Pessimistic scenario (20% probability): If inflation data rebounds, prompting the Fed to stay hawkish, or if Middle East tensions escalate sharply, Bitcoin could retreat below $70,000, testing the key long-term support at $65,000.
For the altcoin market, we maintain the view of "divergence and cleansing in a structural bull market." Bitcoin dominance is expected to remain high over the next one to two months, and the real "altcoin season" will only arrive after Bitcoin completes sufficient rotation at high levels and market confidence fully recovers. During this period, only projects with institutional backing, compliance frameworks, and genuine cash flow will survive the cycle.
Conclusion: The crypto market in May 2026 is at a critical turning point of institutionalization and de-bubbling. Bitcoin’s ETF narrative and whale accumulation provide solid mid-term support, but macro policy uncertainties and geopolitical risks remain threats overhead. For investors, this is neither a time of full bullish euphoria nor a panic exit, but a period requiring more refined, institutionalized risk management, and rational valuation of true value.