Trade
Basic
Futures
Futures
Hundreds of contracts settled in USDT or BTC
TradFi
Gold
Trade global traditional assets with USDT in one place
Options
Hot
Trade European-style vanilla options
Unified Account
Maximize your capital efficiency
Demo Trading
Futures Kickoff
Get prepared for your futures trading
Futures Events
Participate in events to win generous rewards
Demo Trading
Use virtual funds to experience risk-free trading
Earn
Launch
CandyDrop
Collect candies to earn airdrops
Launchpool
Quick staking, earn potential new tokens
HODLer Airdrop
Hold GT and get massive airdrops for free
Launchpad
Be early to the next big token project
Alpha Points
New
Trade on-chain assets and enjoy airdrop rewards!
Futures Points
New
Earn futures points and claim airdrop rewards
Investment
Simple Earn
Earn interests with idle tokens
Auto-Invest
Auto-invest on a regular basis
Dual Investment
Buy low and sell high to take profits from price fluctuations
Soft Staking
Earn rewards with flexible staking
Crypto Loan
0 Fees
Pledge one crypto to borrow another
Lending Center
One-stop lending hub
VIP Wealth Hub
Customized wealth management empowers your assets growth
Private Wealth Management
Customized asset management to grow your digital assets
Quant Fund
Top asset management team helps you profit without hassle
Staking
Stake cryptos to earn in PoS products
Smart Leverage
New
No forced liquidation before maturity, worry-free leveraged gains
GUSD Minting
Use USDT/USDC to mint GUSD for treasury-level yields
More
MrFive
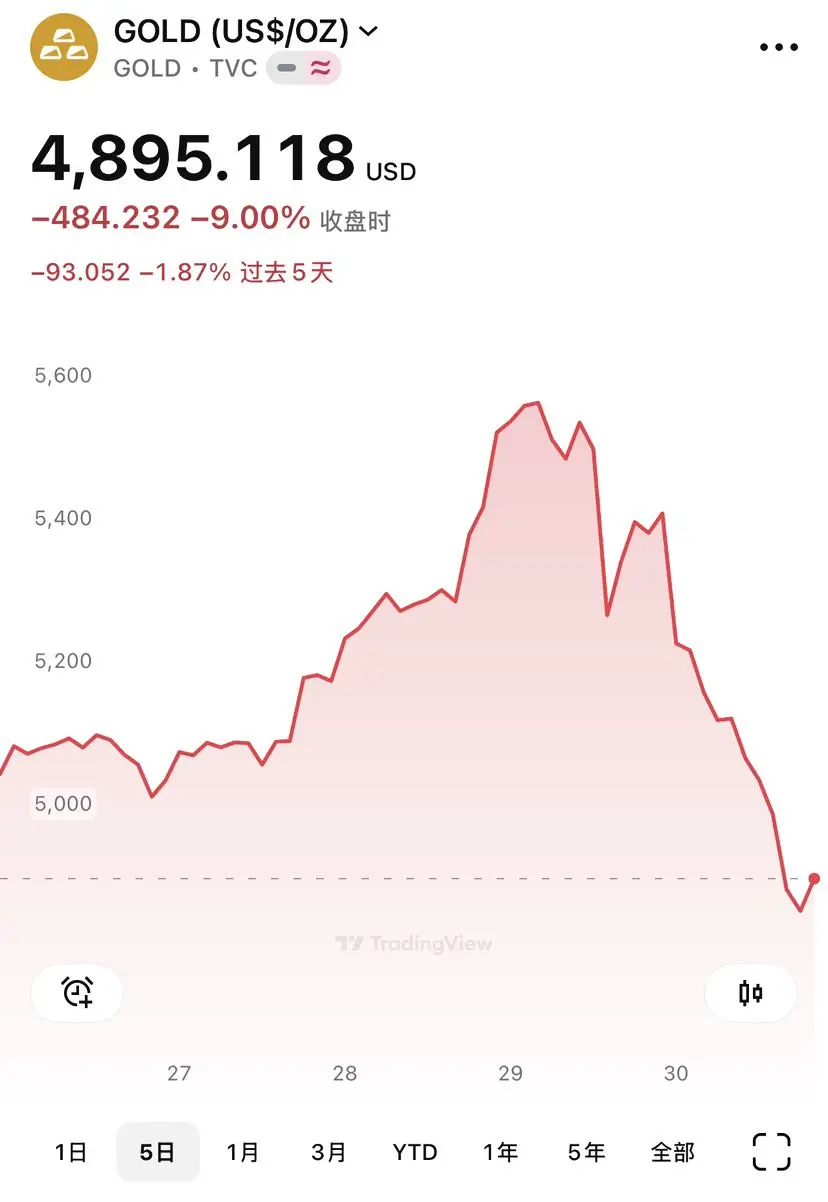
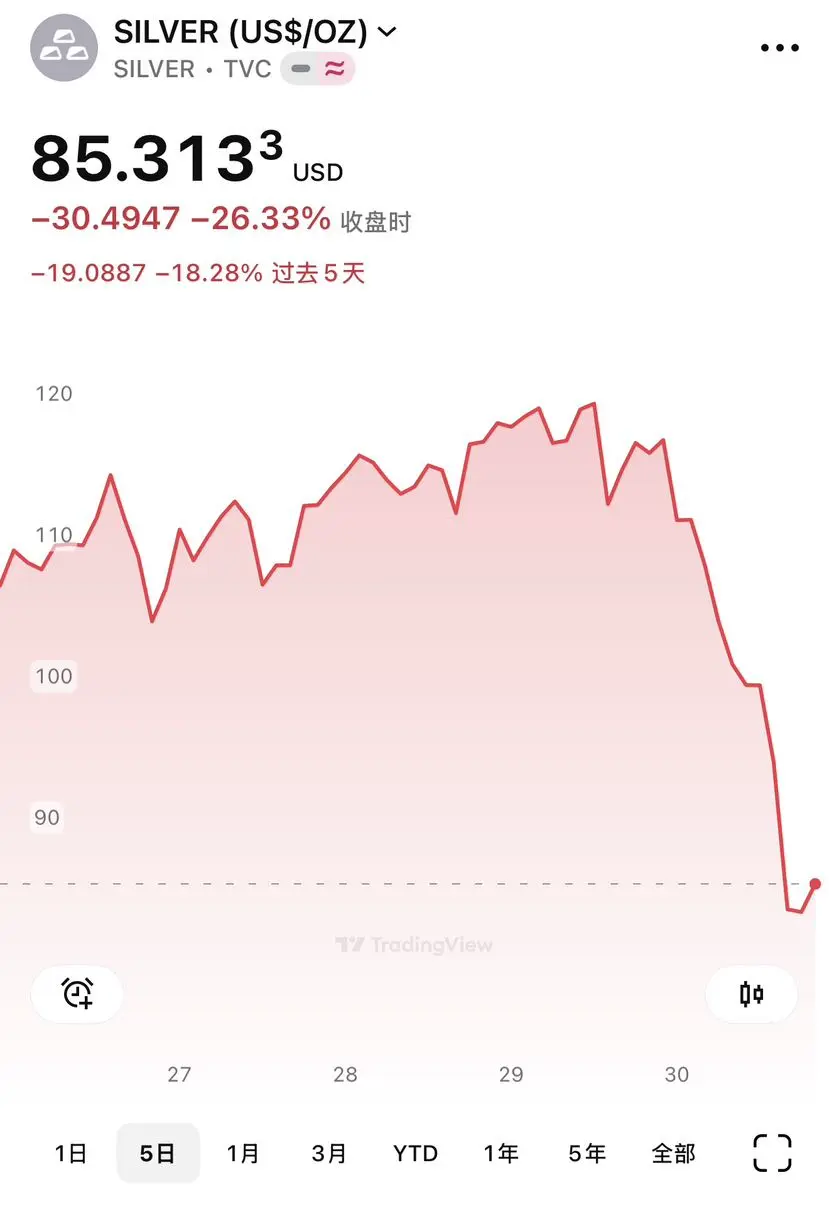
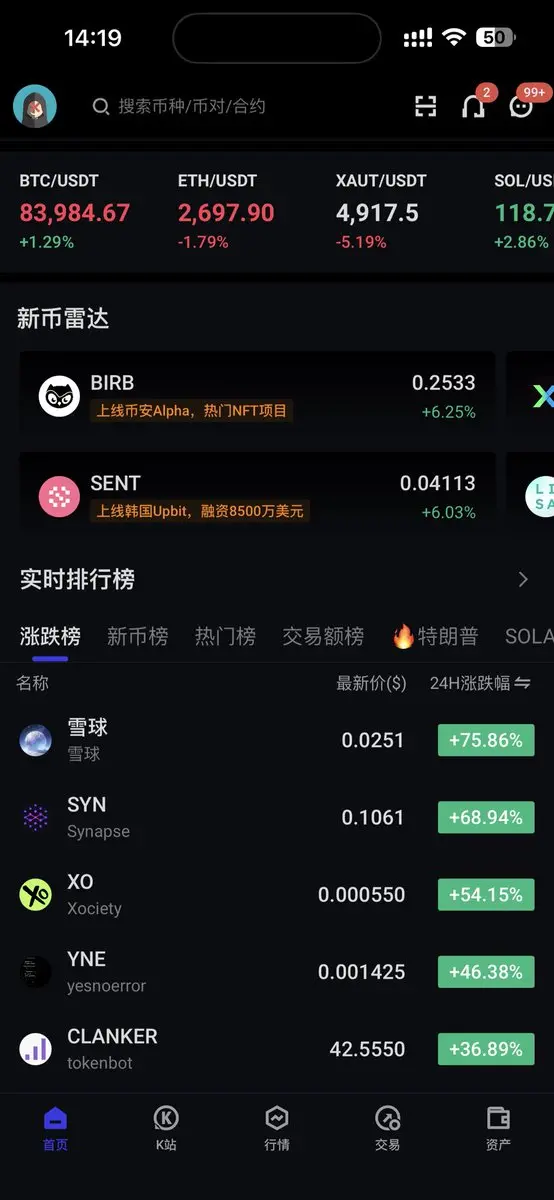
On the early morning of January 31, 2026, the global precious metals market experienced a rare "Black Friday" not seen in nearly 40 years. The international spot gold price plummeted by 12.92% in a single day, repeatedly breaching multiple thresholds from $5,400 to $4,700 during trading, with a low of $4,682 per ounce, marking the largest single-day decline since 1980. The silver market also collapsed simultaneously, with spot silver plunging over 35%, erasing nearly 30% of its market value in one day. This epic shockwave quickly triggered a chain reaction across global financial markets.
The
The
View Original

- Reward
- 2
- Comment
- Repost
- Share


- Reward
- 2
- 1
- Repost
- Share
HeavenSlayerSupporter :
:
Experienced driver, guide me 📈马勒戈币
马勒戈币
Created By@LittlePonyGogo
Listing Progress
100.00%
MC:
$48.18K
Create My Token
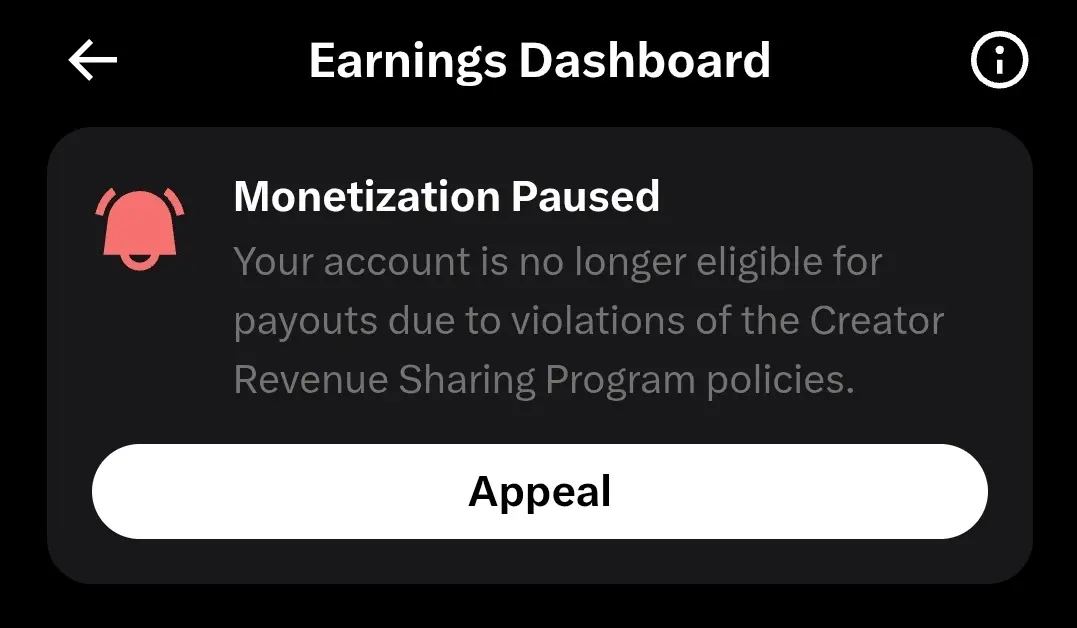
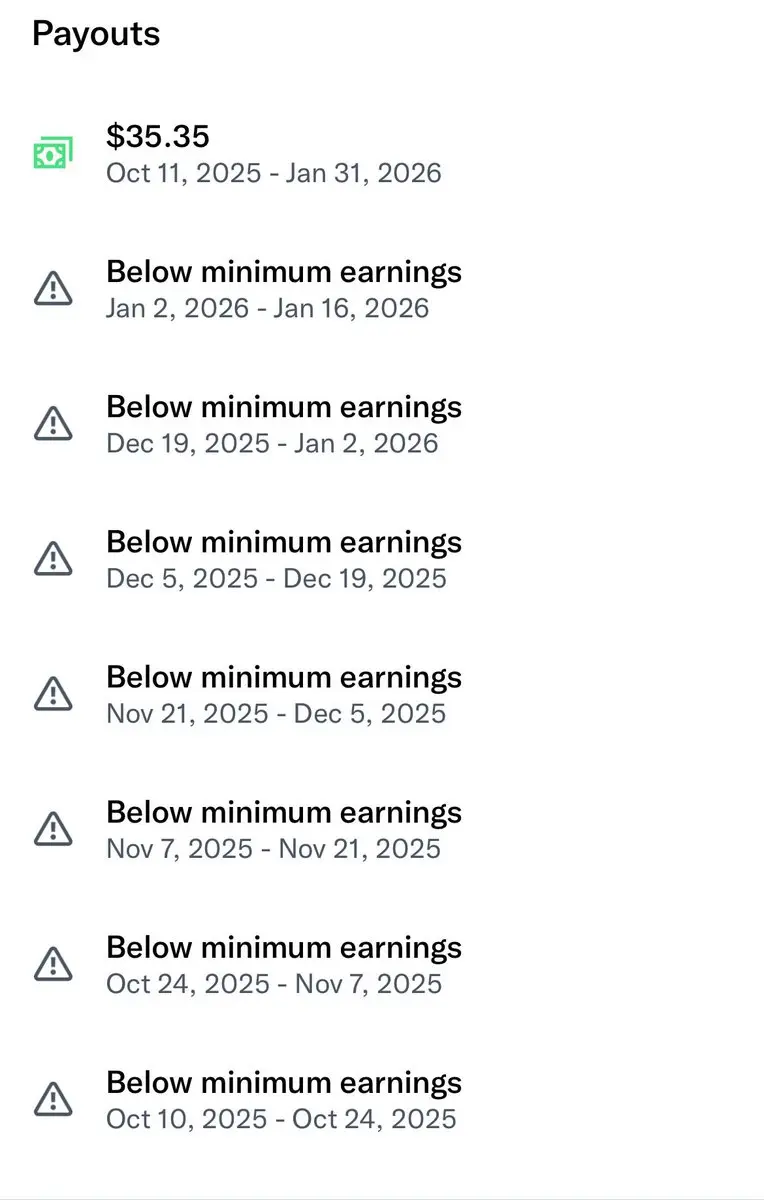
Everyone posting their x revenue payout But I woke to this:What\'s going on here?
- Reward
- like
- Comment
- Repost
- Share
Gm my internet frens
- Reward
- like
- Comment
- Repost
- Share
The drought has ended Good morning chads
- Reward
- like
- Comment
- Repost
- Share
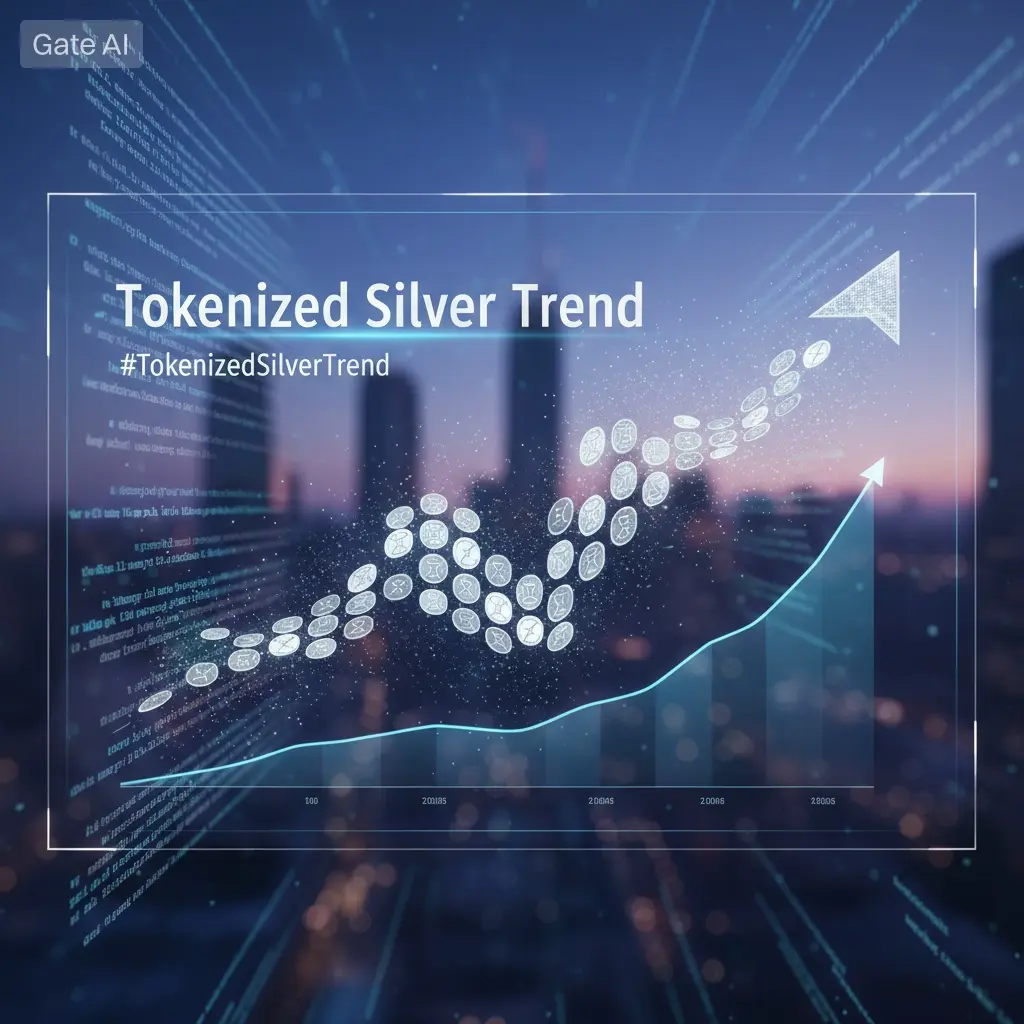
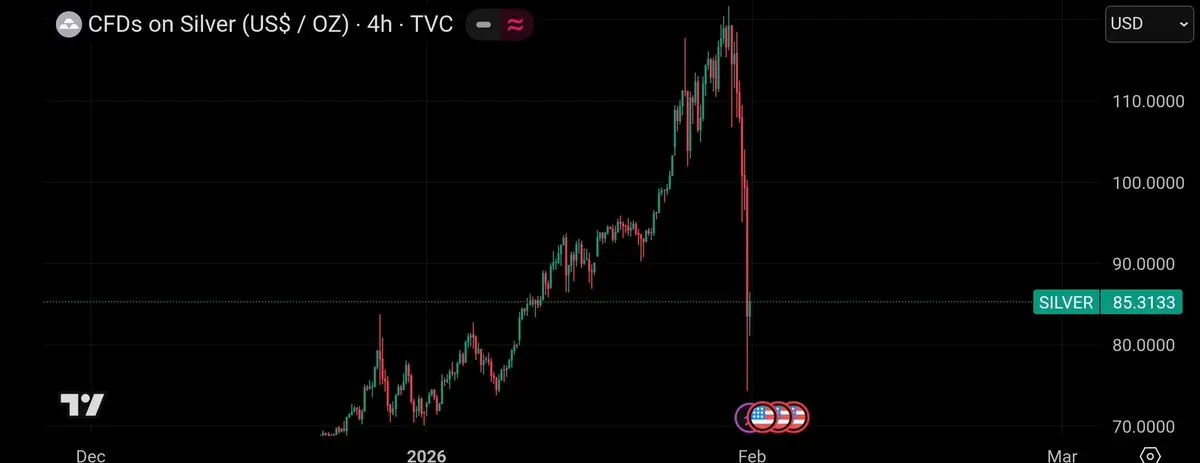
#TokenizedSilverTrend
Tokenized silver has emerged as one of the most volatile and debated commodity-linked digital assets in early 2026. After staging an aggressive breakout above the $120 level in January, prices quickly reversed, pulling back sharply into the $85–$98 zone. This move has exposed both the opportunity and the structural risks embedded in tokenized precious metals.
What Drove the Explosive Rally
The initial surge above $120 was not purely speculative. It was fueled by a convergence of macro and structural factors:
Rising geopolitical risk premiums pushed investors toward hard
- Reward
- 3
- 4
- Repost
- Share
HighAmbition :
:
Watching Closely 🔍️View More
GM Everyone!Happy weekend!Let\'s touch some grass Today 😄

- Reward
- like
- Comment
- Repost
- Share
🇺🇸 BLACKROCK CEO LARRY FINK SAID, " NO ONE SHOULD BE SURPRISED IF BITCOIN HITS $700,000."TIGHTEN YOUR SEATBELTS 🚀
BTC1,38%

- Reward
- like
- Comment
- Repost
- Share
Downside inefficiency:Price drops lack continuation follow-through
209
- Reward
- like
- Comment
- Repost
- Share
#PreciousMetalsPullBack Hurry up and participate in the event to receive attractive rewards!
View Original
- Reward
- like
- Comment
- Repost
- Share
Live Trading and Learning with Chillzzz
1
- Reward
- like
- Comment
- Repost
- Share
intrvrt
introvert
Created By@AmirUser
Listing Progress
0.00%
MC:
$3.23K
Create My Token
$GT GT/USDT, here is a technical analysis:
1. Current Price & Trend
· Current Price: ~9.40 USDT
· Short-term trend: Slightly bearish (down -0.53% in 24h)
· Price is trading between the 24h High (9.46) and Low (9.20), suggesting consolidation.
2. Key Indicators
Bollinger Bands (20,2)
· Middle Band (BOLL): 9.34
· Upper Band (UB): 9.45
· Lower Band (LB): 9.24
· Price (~9.40) is hovering near the middle band, indicating a neutral to slightly bearish momentum.
· The bands are relatively narrow, suggesting low volatility and possible consolidation.
Parabolic SAR (0.02,0.02,0.2)
· SAR Value: 9.32
· S
GT0,32%
- Reward
- 1
- Comment
- Repost
- Share
- Reward
- 1
- 3
- Repost
- Share
價值投資小七 :
:
I've been mapping for a long time; it's not something unusual or surprising.View More
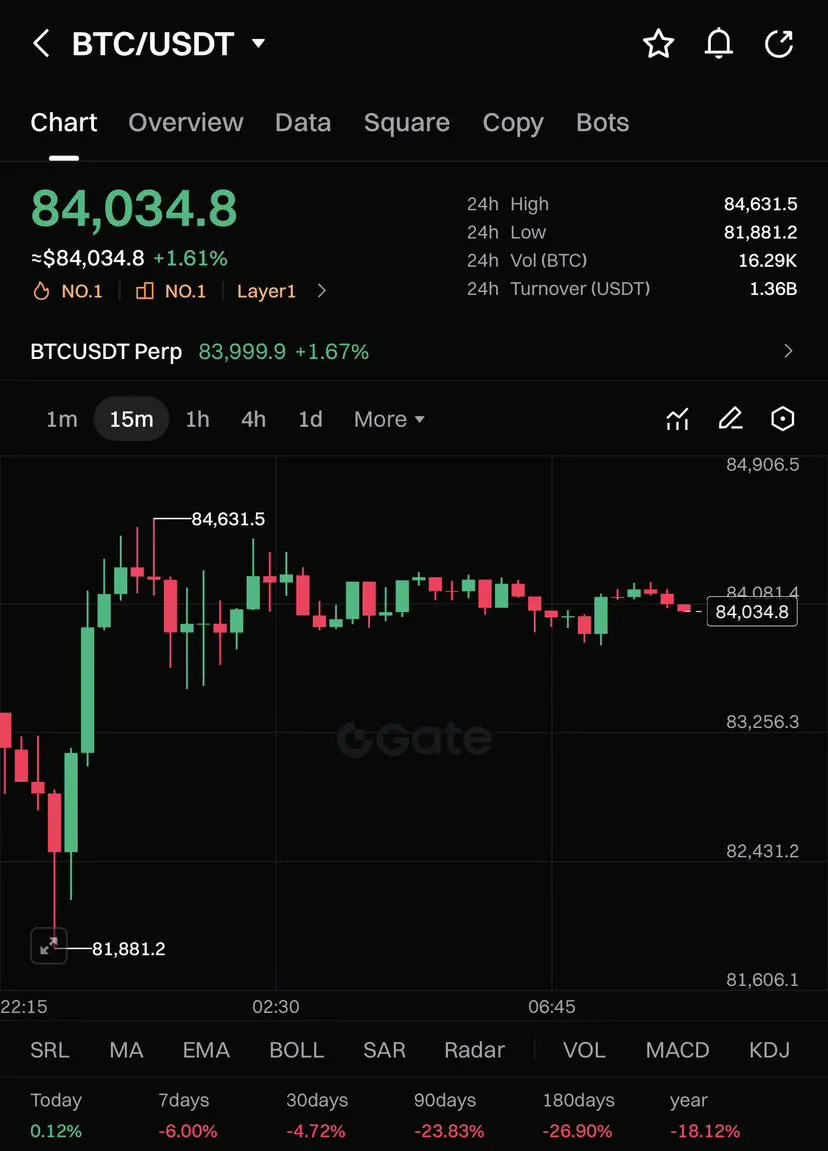
BTC around $82K-$84K today—deeper pullback amid market adjustments & macro noise.
Like koi gliding steadily through turbulent waters, true value endures with patience & solid foundations.
MKI stays focused on transparent, long-term blockchain growth—no hype.
Stay patient, family.
#MKI #A59 #PreciousMetalsPullBack #NextFedChairPredictions #GateLiveMiningProgramPublicBeta
Like koi gliding steadily through turbulent waters, true value endures with patience & solid foundations.
MKI stays focused on transparent, long-term blockchain growth—no hype.
Stay patient, family.
#MKI #A59 #PreciousMetalsPullBack #NextFedChairPredictions #GateLiveMiningProgramPublicBeta
BTC1,38%


- Reward
- 1
- Comment
- Repost
- Share
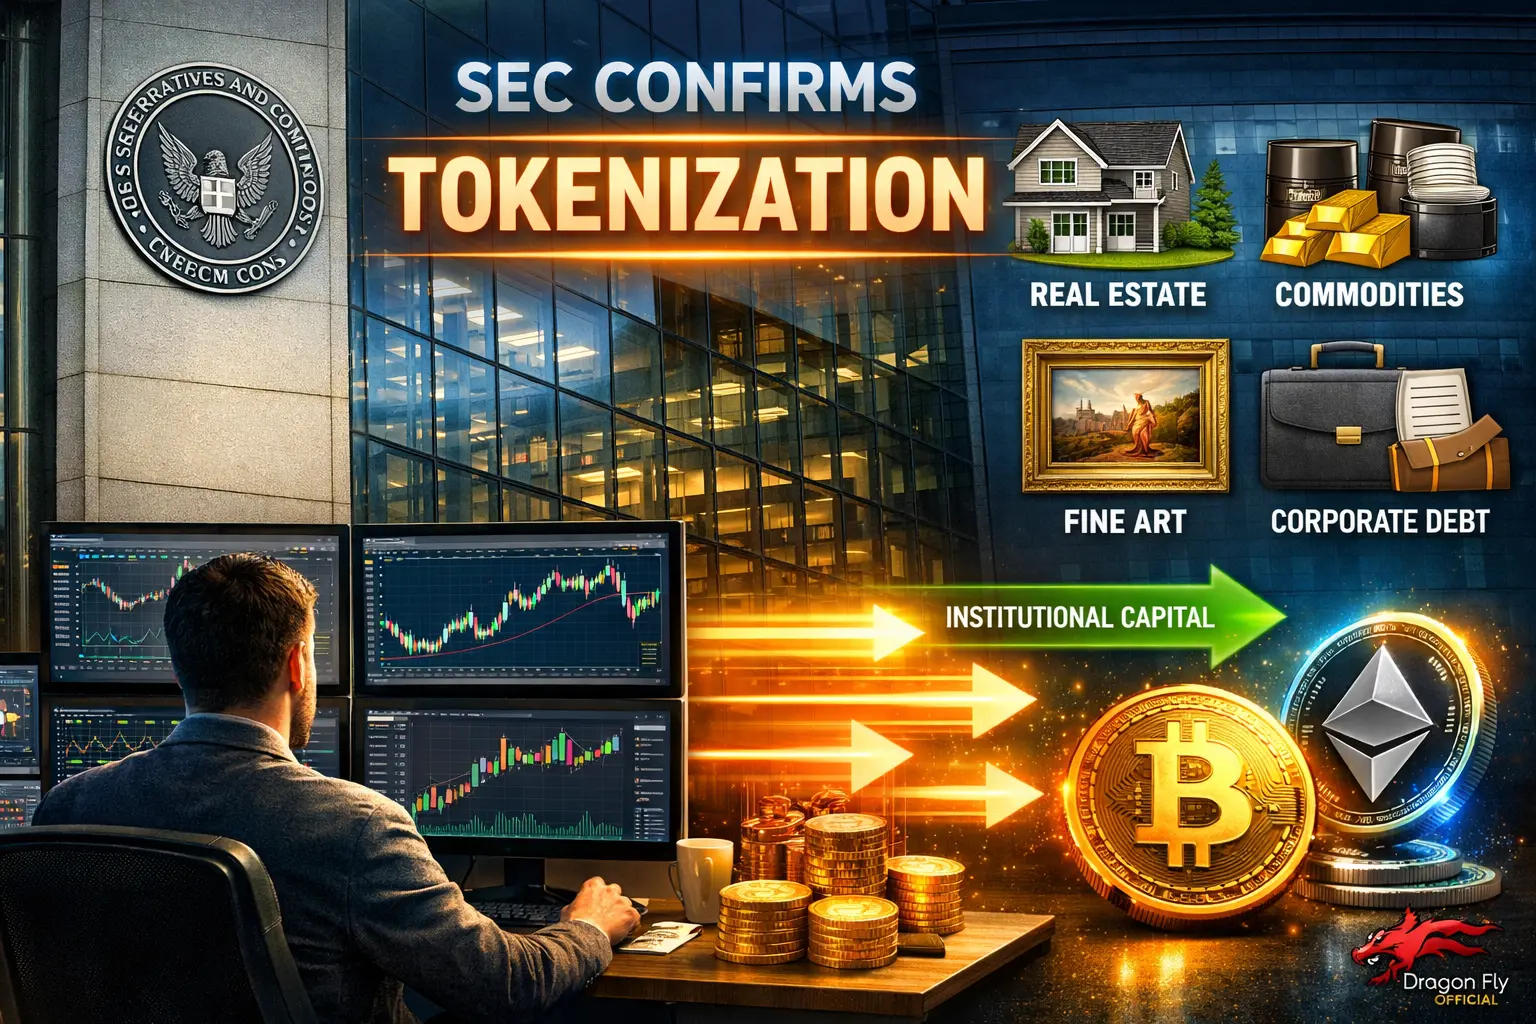
🏛️ SEC Clarifies Tokenization — Institutional Doors Opening?
Insights from Dragon Fly Official indicate that the SEC has confirmed tokenization does not alter existing securities regulations. This is a pivotal statement for the crypto ecosystem, especially for real-world asset (RWA) tokenization, as it signals a framework where institutional players can participate with regulatory clarity. ⚖️💡
📊 Market Analysis:
Institutional Confidence: By affirming that tokenized assets remain under existing securities rules, the SEC reduces regulatory ambiguity, a key barrier preventing large institution
RWA2,78%
- Reward
- 5
- 13
- Repost
- Share
DragonFlyOfficial:
SEC confirms tokenization is still under securities rules — Dragon Fly Official wants to know: Which RWA sectors are you exploring first? 🏛️💬View More
$BTC is holding strong after the rebound and showing clear resilience.
Market structure remains controlled with buyers defending the range.
EP
83,500 - 84,300
TP
TP1 85,200
TP2 86,500
TP3 88,000
SL
81,800
Sell-side liquidity was swept near the lows and price reacted cleanly back into range. Consolidation above demand suggests strong absorption, with structure holding firm and upside continuation favored if control remains intact.
Let’s go $BTC
BTC1,38%
- Reward
- 1
- 1
- Repost
- Share
GateUser-1311b497:
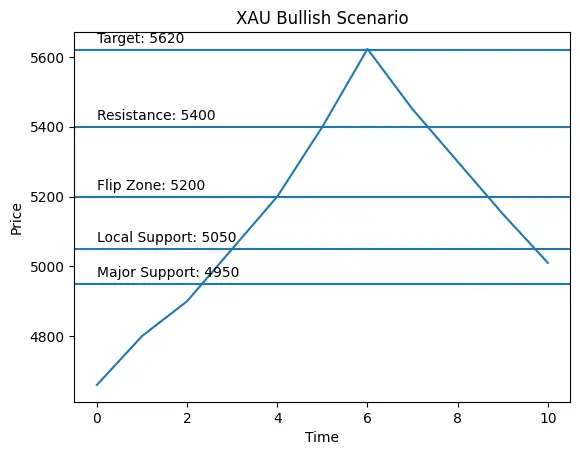
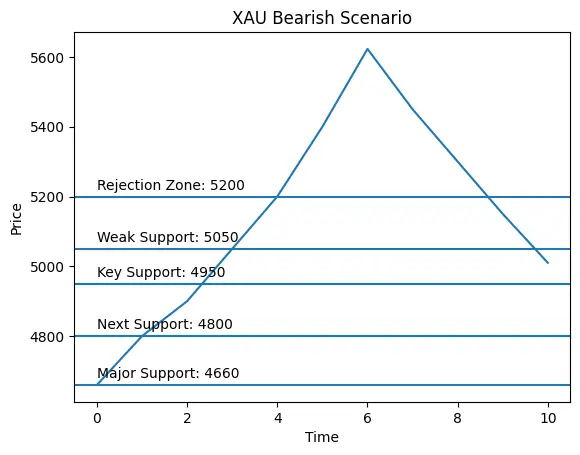
Tether forecasts a profit of approximately $10.10 billion for 2025, with about $192.90 billion in reserve assets at the end of the period.$XAUT Gold faced significant selling pressure after failing to maintain its higher range. The price dropped sharply from its recent high and is now trading around 5,010, where the market is attempting to stabilize. The 4,950 to 5,050 zone is the key support to monitor. This area served as demand previously and is being tested again. As long as the price stays above this zone, a short-term bounce is still possible. A move back above 5,200 would signal the first signs of recovery. If buyers take control, the next resistance levels are near 5,400 and then 5,620. On the downside, a rejection nea
XAUT-4,35%
- Reward
- 1
- 1
- Repost
- Share
Gboy1:
After the huge drop to $4694 what's your thought ? continue dump or a recovery rally first before we see another drop ?
- Reward
- 1
- Comment
- Repost
- Share
Load More
Join 40M users in our growing community
⚡️ Join 40M users in the crypto craze discussion
💬 Engage with your favorite top creators
👍 See what interests you
Trending Topics
View More30.43K Popularity
41.93K Popularity
359.32K Popularity
36.44K Popularity
54.33K Popularity
News
View MoreCircle's USDC circulation decreased by 3.4 billion tokens within a week
8 m
Gate Research Institute: The market remains in defensive consolidation, with capital rotation shifting towards high-elasticity small-cap sectors
36 m
Huatai Macro: Wosh may promote the policy combination of "interest rate cuts + balance sheet reduction"
48 m
Santiment: The ongoing extreme panic in the crypto market is a "strong bullish" signal
50 m
Federal Reserve Chair Nominee Jerome Powell is revealed to have been involved in the Epstein case.
1 h
Pin