BitDemonBrotherPlayingWith
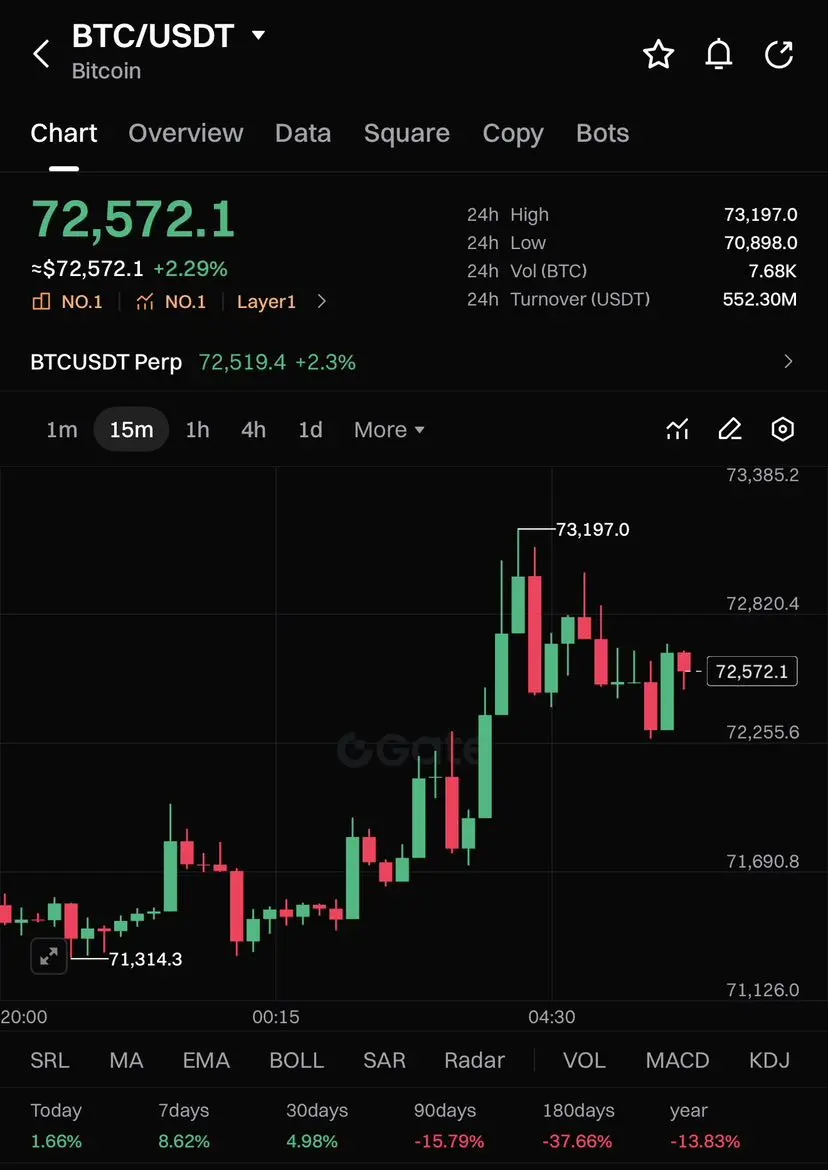
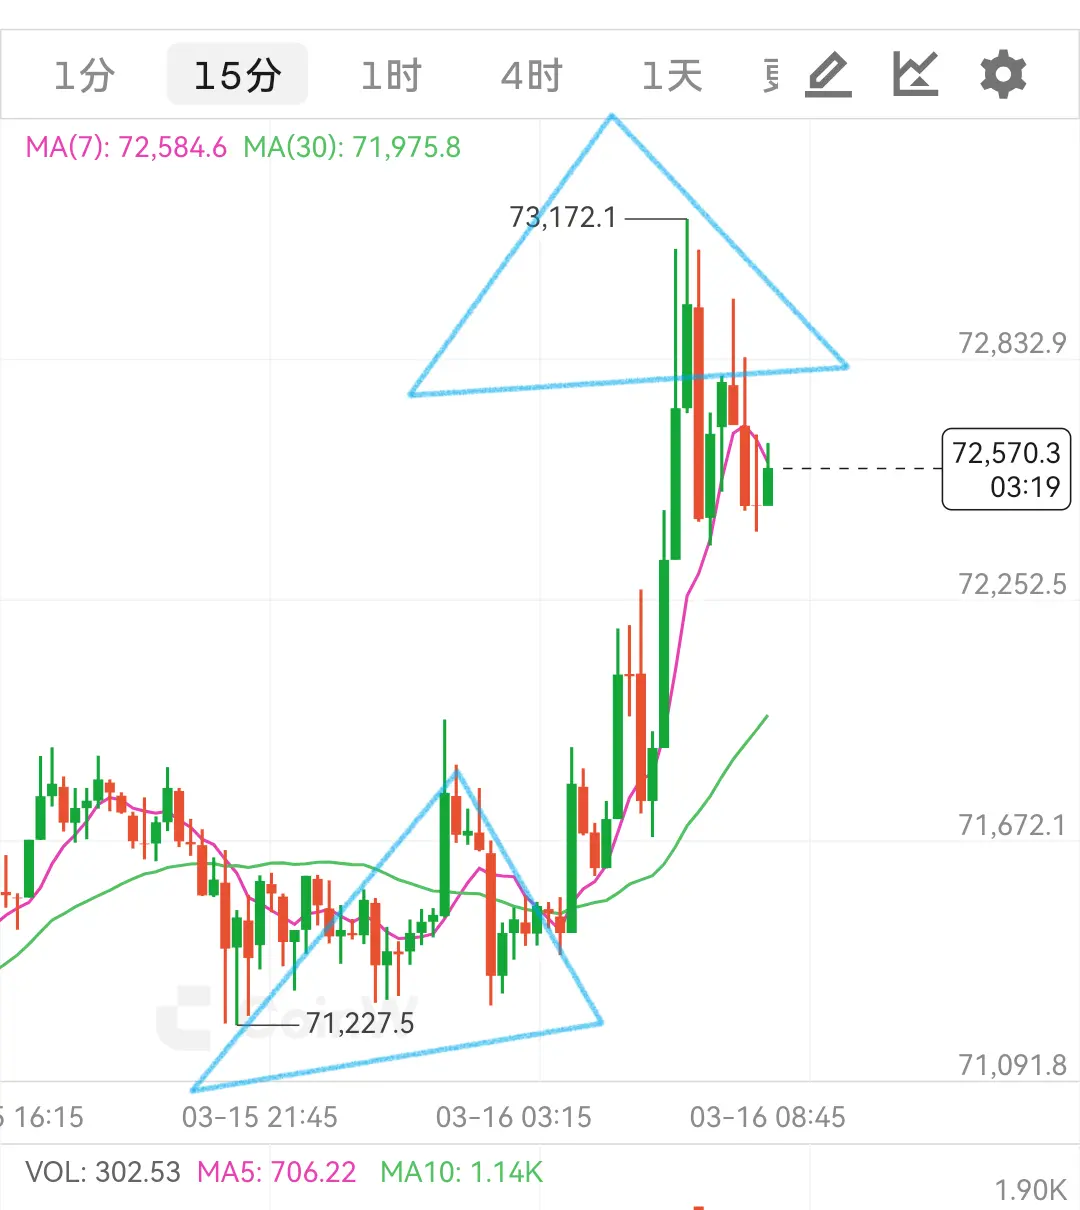
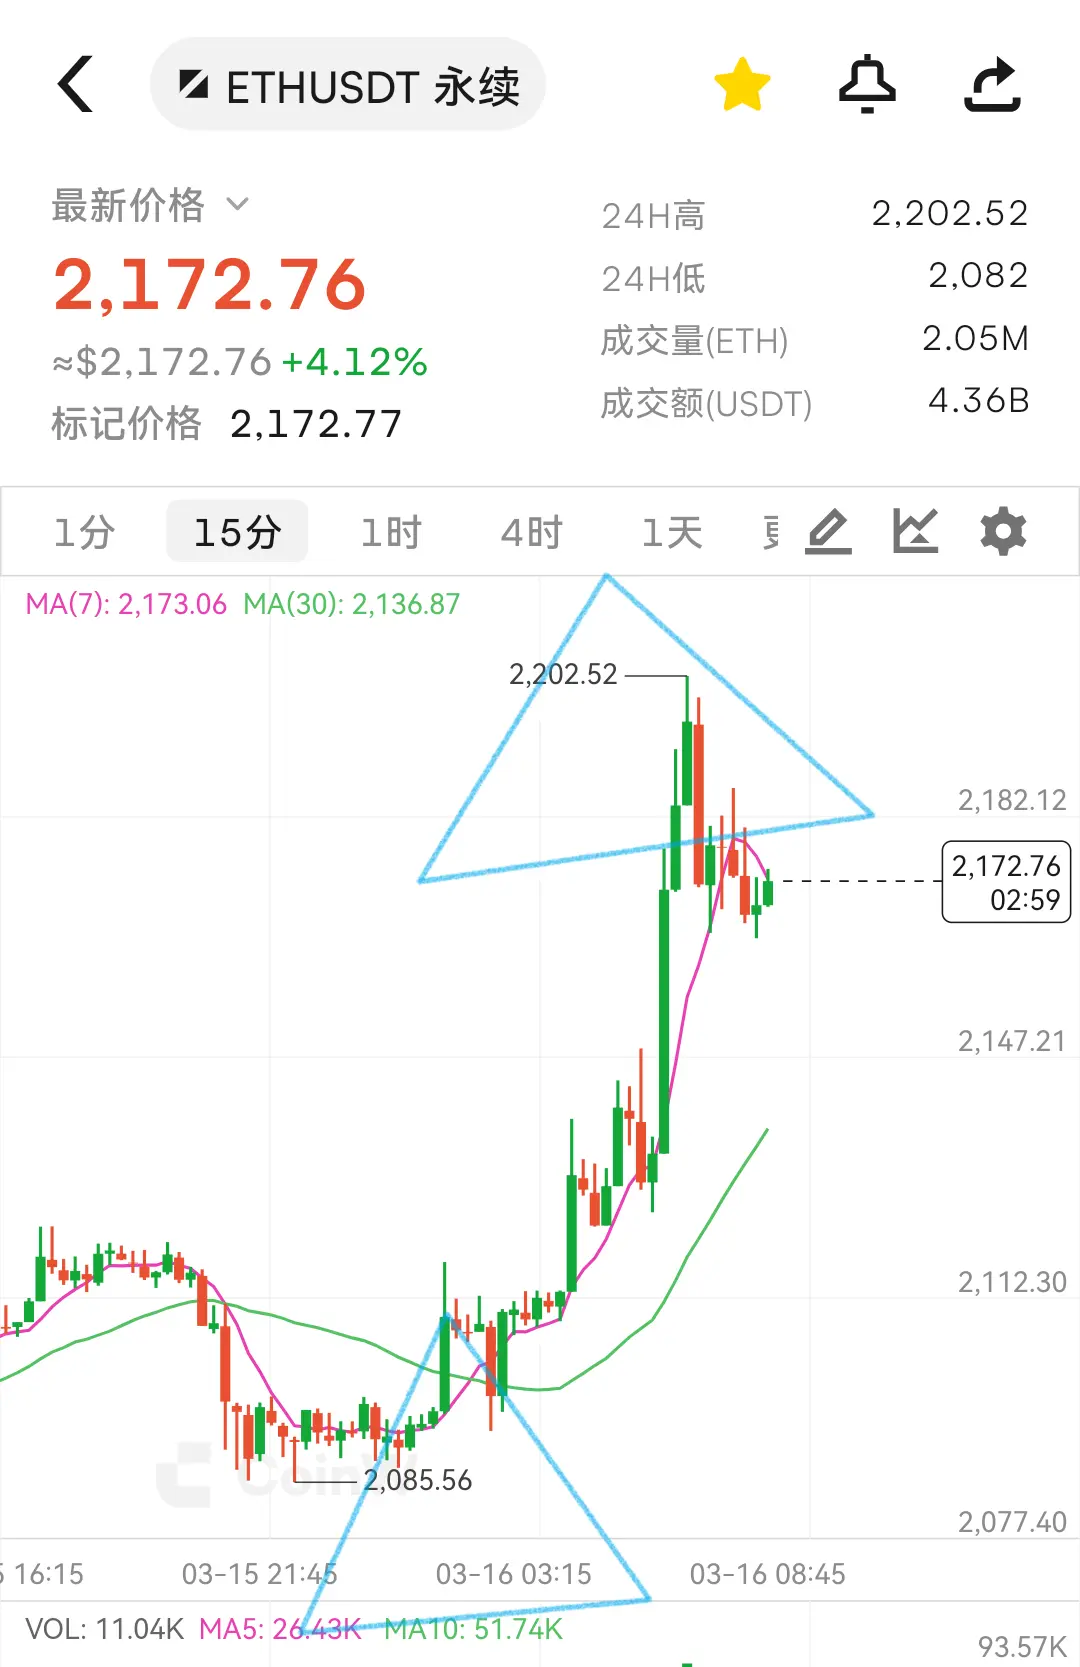
3月16日にビットコインが土曜日に共有したポイントは再び正確であり、ビットコインは73,000〜74,000の範囲で圧力を形成し、突破すれば引き続き買い、突破できなければ売りとなる。損切りは74,000以上に置き、イーサは2200も同じ考え方である。
BTC2.34%
- 報酬
- いいね
- コメント
- リポスト
- 共有

DOGK
Dog King
作成者@Remember
申込状況
0.00%
時価総額:
$0
より多くのトークン
#VanEckCryptoETFJoins401kPlan 金融情勢は、VanEckがそのVanEck暗号資産ETFを401(k)退職金計画に組み入れることで大きな変化を迎えています。この動きは、従来の退職投資手段とダイナミックな暗号資産の世界との間のギャップを埋める重要なマイルストーンを示しています。数十年にわたり、401(k)計画は主に株式、債券、投資信託に焦点を当て、従来の金融商品を通じて長期的な成長を目指してきました。暗号資産に焦点を当てたETFの導入は、重要な進化を示し、主流の退職計画においてデジタル資産の受け入れが拡大していることを示しています。
VanEck暗号資産ETFは、投資家に多様化された暗号資産ポートフォリオへのエクスポージャーを提供しつつ、ETFに伴う利便性と規制の監督を維持しています。これは、ボラティリティの高さや保管・セキュリティの複雑さから、従来は暗号資産への直接投資に慎重だった退職口座の保有者にとって特に魅力的です。ETFの仕組みを活用することで、VanEckはこれらの投資家が秘密鍵やデジタルウォレットを自ら管理することなく、暗号資産の潜在的な上昇に参加できるようにしています。
退職計画の観点から、この動きは新たな戦略的機会をもたらします。デジタル資産に馴染みのある若い投資家は、今後、401(k)の拠出金の一部をこのETFに配分し、従来の投資と暗号
原文表示VanEck暗号資産ETFは、投資家に多様化された暗号資産ポートフォリオへのエクスポージャーを提供しつつ、ETFに伴う利便性と規制の監督を維持しています。これは、ボラティリティの高さや保管・セキュリティの複雑さから、従来は暗号資産への直接投資に慎重だった退職口座の保有者にとって特に魅力的です。ETFの仕組みを活用することで、VanEckはこれらの投資家が秘密鍵やデジタルウォレットを自ら管理することなく、暗号資産の潜在的な上昇に参加できるようにしています。
退職計画の観点から、この動きは新たな戦略的機会をもたらします。デジタル資産に馴染みのある若い投資家は、今後、401(k)の拠出金の一部をこのETFに配分し、従来の投資と暗号

- 報酬
- 3
- 6
- リポスト
- 共有
Vortex_King :
:
月へ 🌕もっと見る
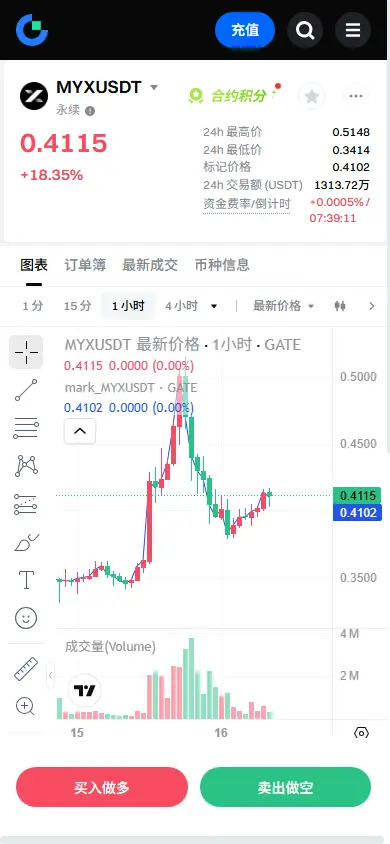
【MYXUSDTシグナル】ロング:4Hでのボリュームブレイクアウト確認とプルバック
価格は3月15日の4Hタイムフレーム内で重要なブレイクアウトを完了しました。最初の4Hキャンドル (04:00-08:00 では、0.3628から0.4357へ上昇し、出来高は6047万、次の2番目のキャンドル )08:00-12:00 では出来高を1億200万に拡大し、価格は0.5164の高値に到達しました。これは典型的なボリューム・プライス共鳴のブレイクアウトであり、機関資金の流入の明確な兆候です。
ブレイクアウト後、価格はリトレースしましたが、そのリトレースは出来高の減少を示しています。12:00から20:00にかけて、3つの4Hキャンドルを通じて出来高は5200万から2586万、その後1853万へと減少しました。1Hレベルでは、価格は0.3883から0.4025の範囲内で変動し、買い側の深さは売り側を大きく上回っています。オーダーブックは、レベル1から10までの買い注文合計が183,000に達し、売り注文は同じレベルで47,700に過ぎず、買い側の深さは売り側の3.84倍となり、堅固なサポートウォールを形成しています。
オープンインタレスト (OI) は安定しており、リトレース中に急激に減少していないことから、ブレイクアウト時に入ったロングポジションはパニック売りに走っていないことを示してい
原文表示価格は3月15日の4Hタイムフレーム内で重要なブレイクアウトを完了しました。最初の4Hキャンドル (04:00-08:00 では、0.3628から0.4357へ上昇し、出来高は6047万、次の2番目のキャンドル )08:00-12:00 では出来高を1億200万に拡大し、価格は0.5164の高値に到達しました。これは典型的なボリューム・プライス共鳴のブレイクアウトであり、機関資金の流入の明確な兆候です。
ブレイクアウト後、価格はリトレースしましたが、そのリトレースは出来高の減少を示しています。12:00から20:00にかけて、3つの4Hキャンドルを通じて出来高は5200万から2586万、その後1853万へと減少しました。1Hレベルでは、価格は0.3883から0.4025の範囲内で変動し、買い側の深さは売り側を大きく上回っています。オーダーブックは、レベル1から10までの買い注文合計が183,000に達し、売り注文は同じレベルで47,700に過ぎず、買い側の深さは売り側の3.84倍となり、堅固なサポートウォールを形成しています。
オープンインタレスト (OI) は安定しており、リトレース中に急激に減少していないことから、ブレイクアウト時に入ったロングポジションはパニック売りに走っていないことを示してい
- 報酬
- 2
- コメント
- リポスト
- 共有
- 報酬
- 2
- コメント
- リポスト
- 共有
一度にすべてのチャンスを掴もうとするな。真に希少な能力は、買うことができることではなく、いつ空のポジションを持つべきかを理解することだ。方向性のない乱高下の相場は最も人を疲弊させ、大金は決して衝動的に早期に手放さない。#达沃斯世界经济论坛2026 Ethereum マルチサイクル共振トレーディングシステム。
ETH4.47%
- 報酬
- 1
- コメント
- リポスト
- 共有
🔥 NOW: Over $120B が#crypto market cap in the past 5 days. #暗号資産に追加されました
原文表示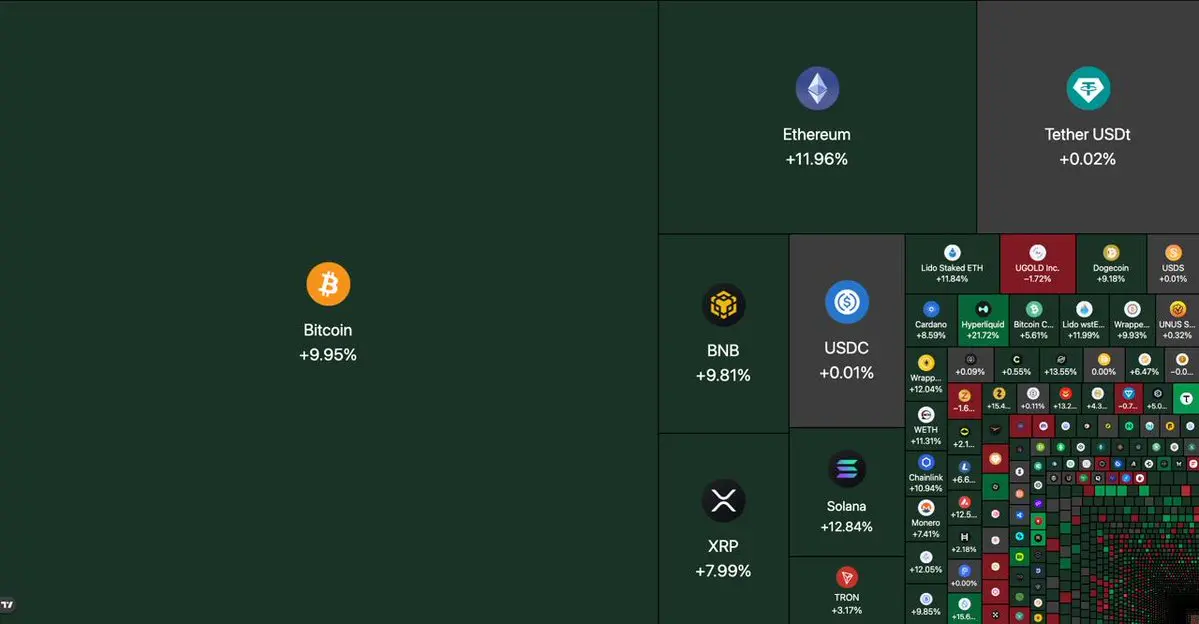
- 報酬
- 1
- コメント
- リポスト
- 共有
ゲートアイオーの次の記念日をお祝い申し上げます #GateDerivativesHitsNewHighInFebruary #AAVETokenSwapControversy #AAVETokenSwapControversy
原文表示

- 報酬
- 2
- コメント
- リポスト
- 共有
月曜日、風も穏やかで晴れやか、ロングは依然無敵
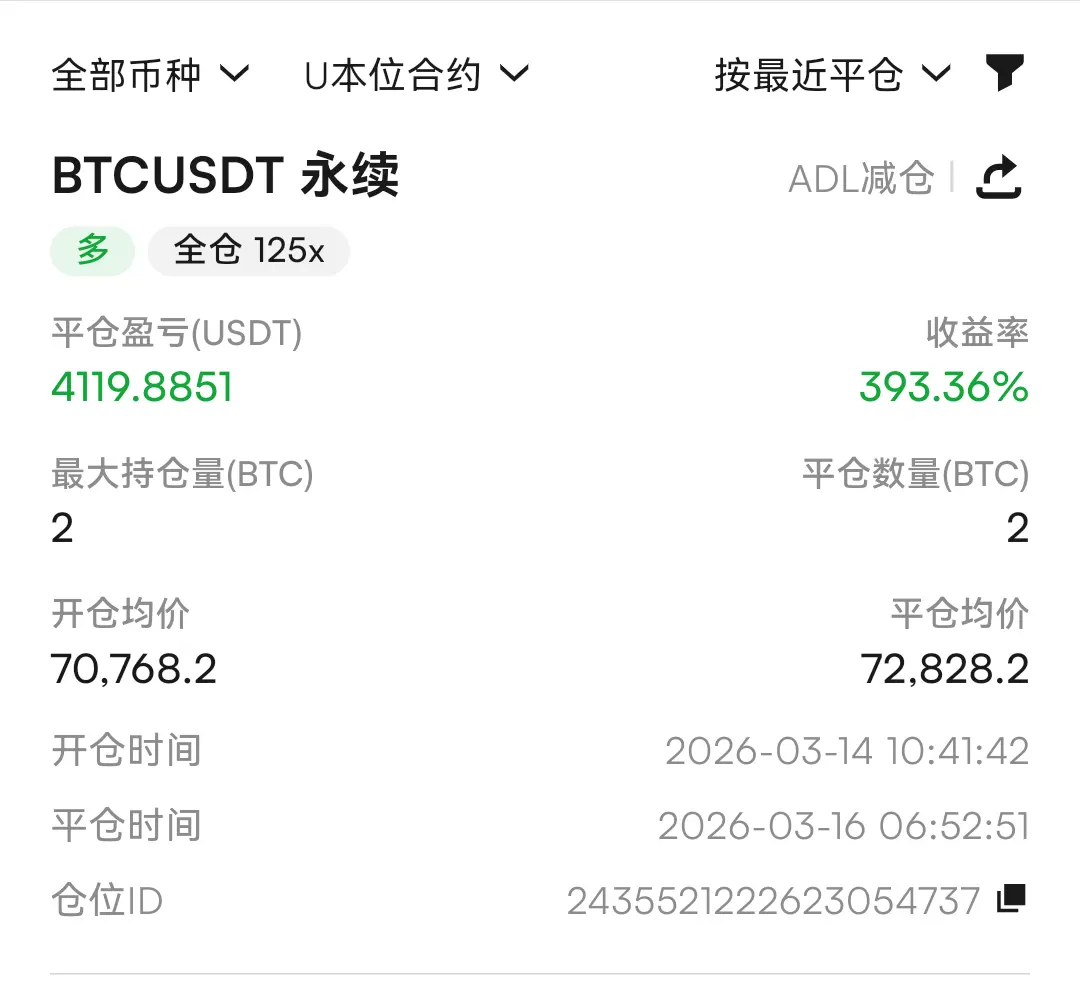
昨日の思考通り、月曜日はビットコインが高値から始まり、大きなピザはロングで2000ポイントを一気に獲得、思考に沿って71000で乗った人も同じようにこの大きな利益を得た。イーサも同時に100ポイントの余裕を確保し、目を開けたらすぐに利益確定できる感覚、気持ちいいだろう?3月は春の暖かさと花咲く季節であり、私たちが後の市場に備えてポジションを積み上げ、底値を狙い始める時期でもある。
相場がどう震動しようとも、市場がどう洗い流そうとも、常に運行の軌道に戻る。トレードはポイントの多寡ではなく、多くの場合は思考のロジックと認知の予判によるものである。なぜロングをするのか?なぜショートをするのか?成立する要因と条件が必要であり、残るのは知行合一、すなわち知識と行動の一致である。
日中の短期戦略については後ほど更新する。ポジションの調子が良くなく、方向性が見えない場合はいつでも相談に来てほしい。お前さんはただしっかり座ってしっかり掴まっていれば、安全に目的地に到達させてやる。
原文表示昨日の思考通り、月曜日はビットコインが高値から始まり、大きなピザはロングで2000ポイントを一気に獲得、思考に沿って71000で乗った人も同じようにこの大きな利益を得た。イーサも同時に100ポイントの余裕を確保し、目を開けたらすぐに利益確定できる感覚、気持ちいいだろう?3月は春の暖かさと花咲く季節であり、私たちが後の市場に備えてポジションを積み上げ、底値を狙い始める時期でもある。
相場がどう震動しようとも、市場がどう洗い流そうとも、常に運行の軌道に戻る。トレードはポイントの多寡ではなく、多くの場合は思考のロジックと認知の予判によるものである。なぜロングをするのか?なぜショートをするのか?成立する要因と条件が必要であり、残るのは知行合一、すなわち知識と行動の一致である。
日中の短期戦略については後ほど更新する。ポジションの調子が良くなく、方向性が見えない場合はいつでも相談に来てほしい。お前さんはただしっかり座ってしっかり掴まっていれば、安全に目的地に到達させてやる。

- 報酬
- 3
- 1
- リポスト
- 共有
AHeadOfBlackHair:
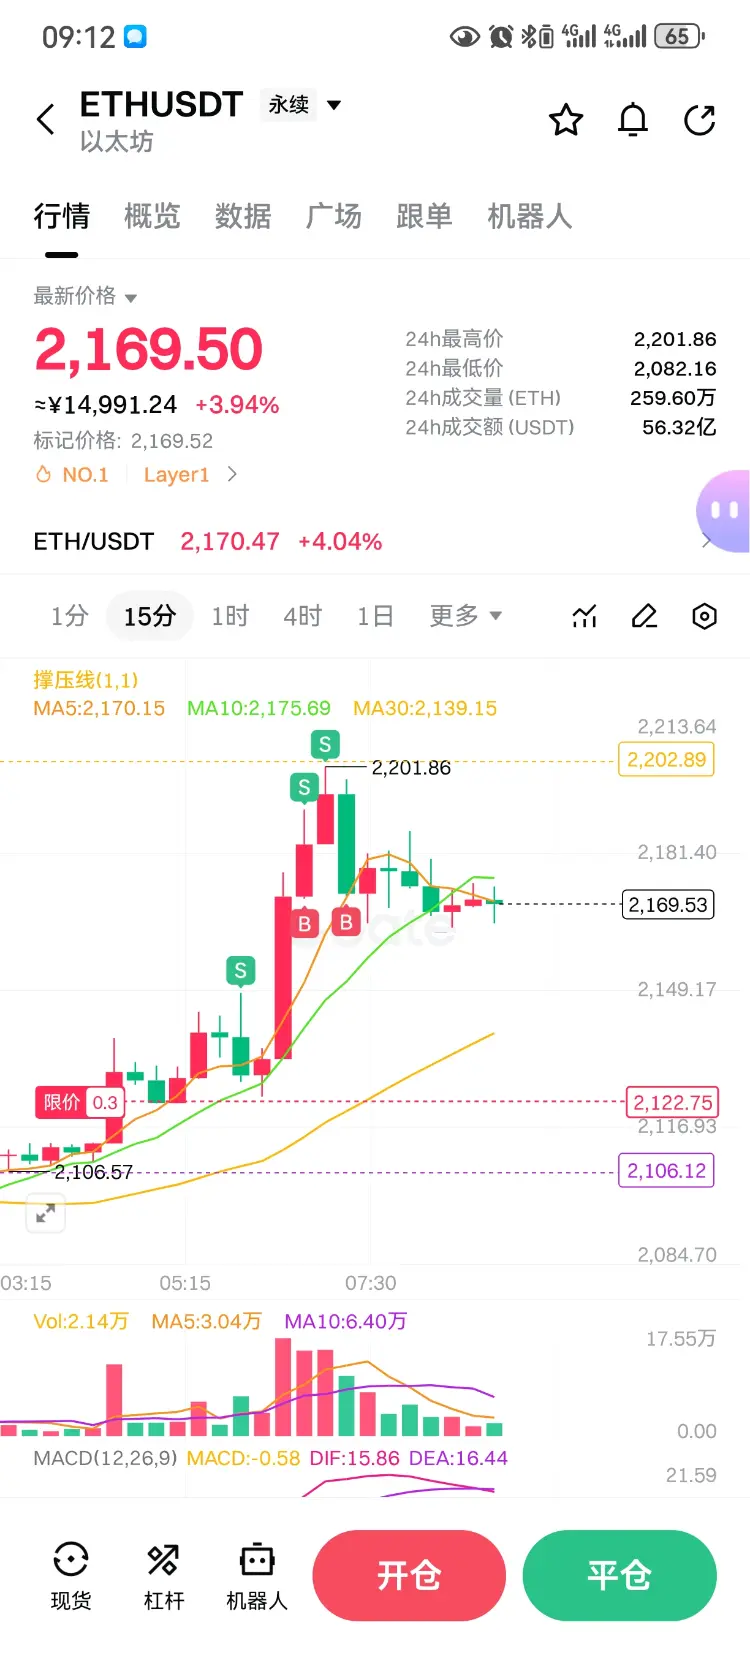
ロング・ショートの論理を最優先し、次に考え方の実現を見てみましょう月曜日は勢いが強く、早朝に二饼はまっすぐに2200まで駆け上がった。今は調整が入っているが、私は依然として大きな時間軸でのブレイクアウトを見ている。ここでの空売りは純粋にリスクリワードの良さから行うもので、2189付近で空、2200付近にストップロスを置き、小さなポジションで参加できる。
原文表示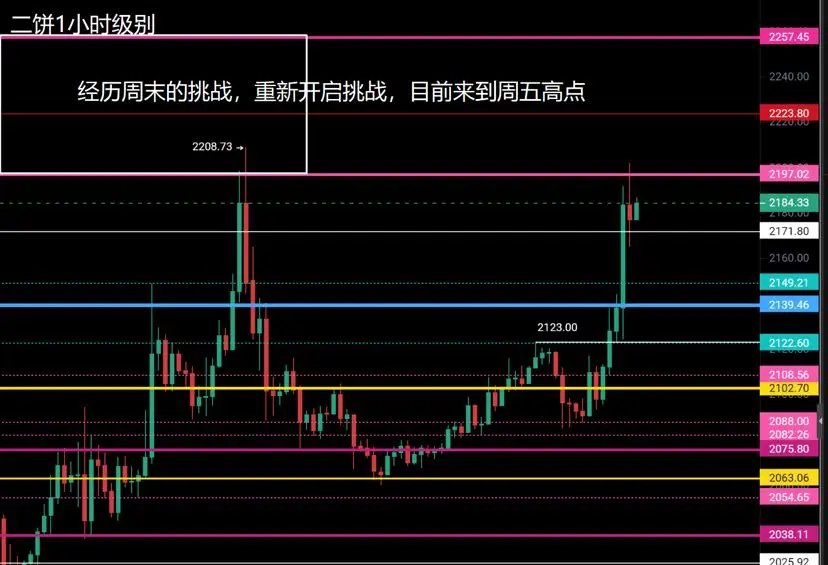
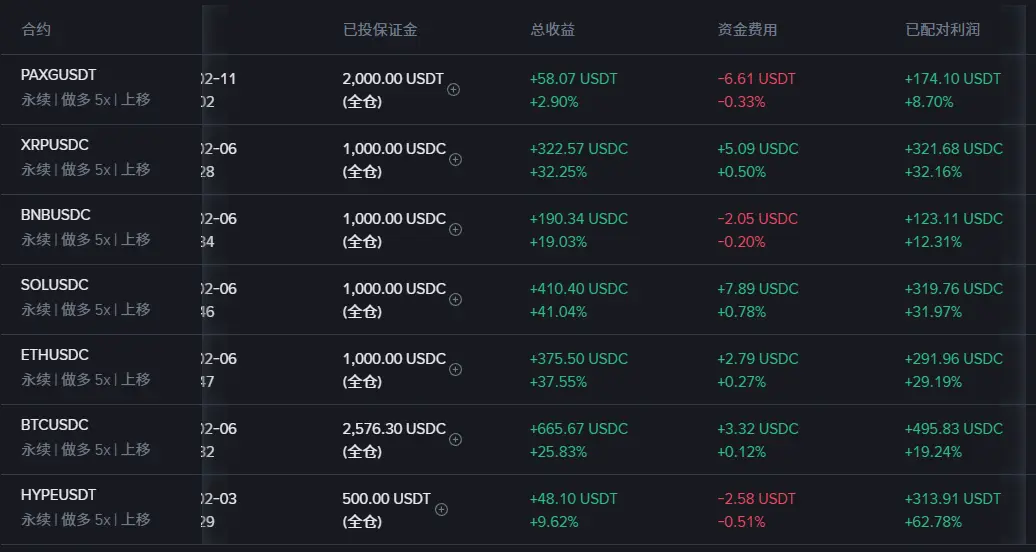
[ユーザーは自分の取引データを共有しました。アプリに移動して詳細を表示します]
- 報酬
- いいね
- 1
- リポスト
- 共有
金马2026 :
:
米神は短期的に反転したのか?以前は多くの人が1700以下まで下がると予想していたが、今はそのような声がなくなったようだ。ship
ship
作成者@rabbitkk
申込状況
0.00%
時価総額:
$0
より多くのトークン
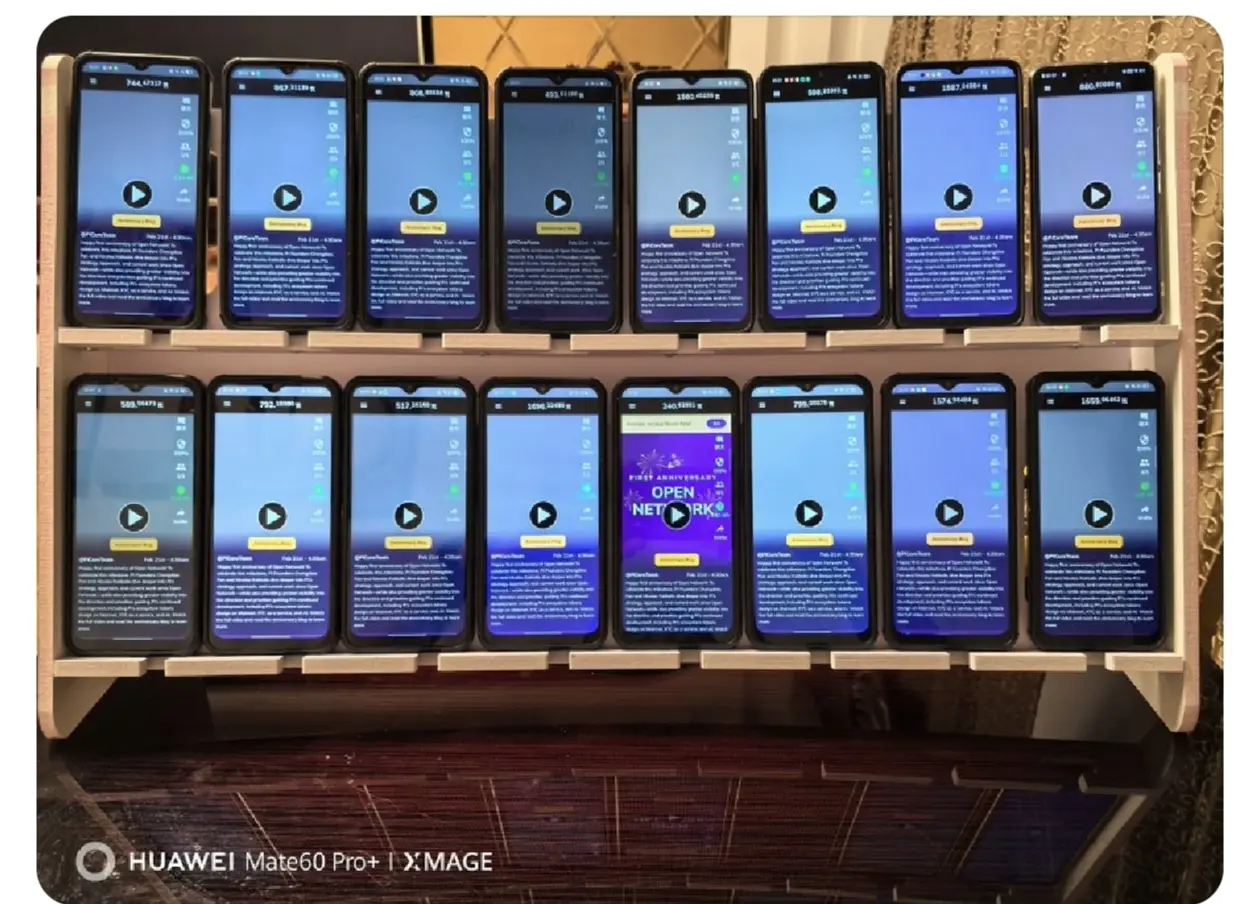
チャンペン・ジャオと妻の何怡をブロックすれば、Xプラットフォームはより清潔になります。中国語圏からの詐欺ツイートも受け取らなくなります。資産を保護するための対策を講じてください。
原文表示- 報酬
- 1
- コメント
- リポスト
- 共有


- 報酬
- 3
- 9
- リポスト
- 共有
Ink-DyedQingyang :
:
違反しているわけではないが、やはり不正の疑いはある!そんなに目立たないようにしろ。他人があなたの画像を使ってTwitterに通報したら、少なくともマッピングの時間が遅れるぞ。もっと見る


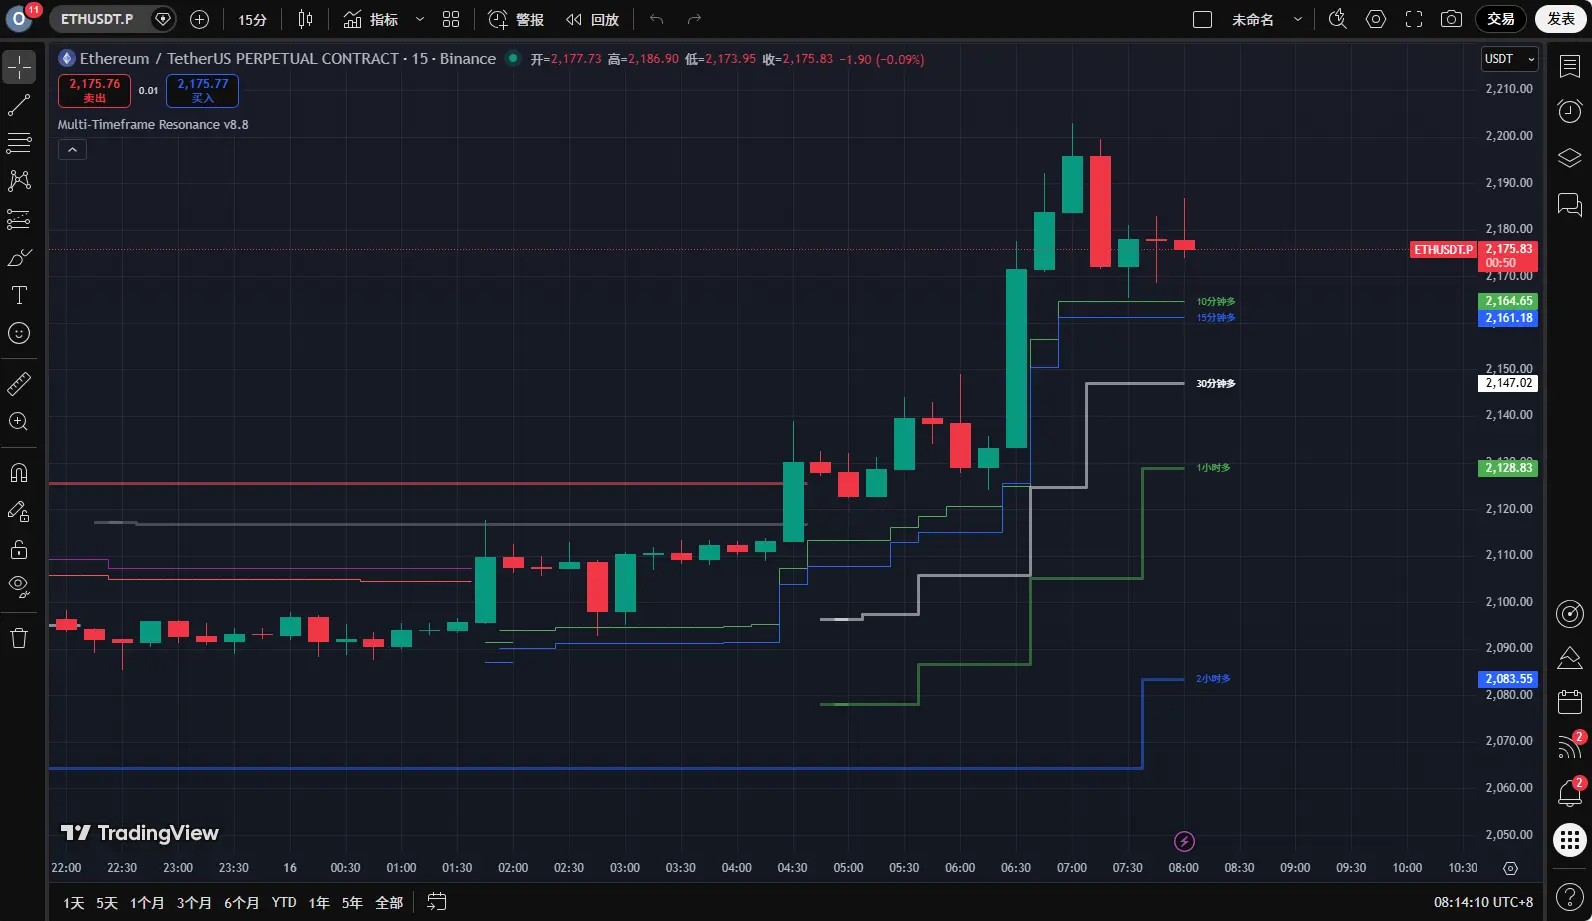
📊 Ethereum 15-Minute Candlestick Chart Analysis
1. Price and Moving Average Position
- Current Price: 2,169.50 USDT
- Short-term Moving Averages: MA5 (2,170.15), MA10 (2,175.69)
- Mid-term Moving Average: MA30 (2,139.15)
- The price is currently slightly below MA5/MA10 but well above MA30, indicating short-term pullback pressure, but the mid-term trend remains bullish.
2. Pattern and Key Price Levels
- Previous High: 2,201.86 USDT (Long upper wick, failed breakout attempt with clear selling pressure above)
- Key Support Levels:
- First Support: 2,160 USDT (Near current price, recent consolida
ETH4.47%
- 報酬
- 3
- 1
- リポスト
- 共有
镇场:
吉祥如意 🧧もっと詳しく