Trade
Basic
Futures
Futures
Hundreds of contracts settled in USDT or BTC
TradFi
Gold
Trade global traditional assets with USDT in one place
Options
Hot
Trade European-style vanilla options
Unified Account
Maximize your capital efficiency
Demo Trading
Futures Kickoff
Get prepared for your futures trading
Futures Events
Participate in events to win generous rewards
Demo Trading
Use virtual funds to experience risk-free trading
Earn
Launch
CandyDrop
Collect candies to earn airdrops
Launchpool
Quick staking, earn potential new tokens
HODLer Airdrop
Hold GT and get massive airdrops for free
Launchpad
Be early to the next big token project
Alpha Points
Trade on-chain assets and enjoy airdrop rewards!
Futures Points
Earn futures points and claim airdrop rewards
Investment
Simple Earn
Earn interests with idle tokens
Auto-Invest
Auto-invest on a regular basis
Dual Investment
Buy low and sell high to take profits from price fluctuations
Soft Staking
Earn rewards with flexible staking
Crypto Loan
0 Fees
Pledge one crypto to borrow another
Lending Center
One-stop lending hub
VIP Wealth Hub
Customized wealth management empowers your assets growth
Private Wealth Management
Customized asset management to grow your digital assets
Quant Fund
Top asset management team helps you profit without hassle
Staking
Stake cryptos to earn in PoS products
Smart Leverage
New
No forced liquidation before maturity, worry-free leveraged gains
GUSD Minting
Use USDT/USDC to mint GUSD for treasury-level yields
More
GateToken
A phone number has been in use for 16 years. How much contribution have I made to them over these years? Even at 30,000 a year, that's almost 500,000.
View Original- Reward
- like
- Comment
- Repost
- Share
- Reward
- like
- Comment
- Repost
- Share
Finally phase 1 passed ❤️
- Reward
- like
- Comment
- Repost
- Share
星星之火
星星之火
Created By@gatefunuser_936d
Listing Progress
100.00%
MC:
$2.9K
Create My Token
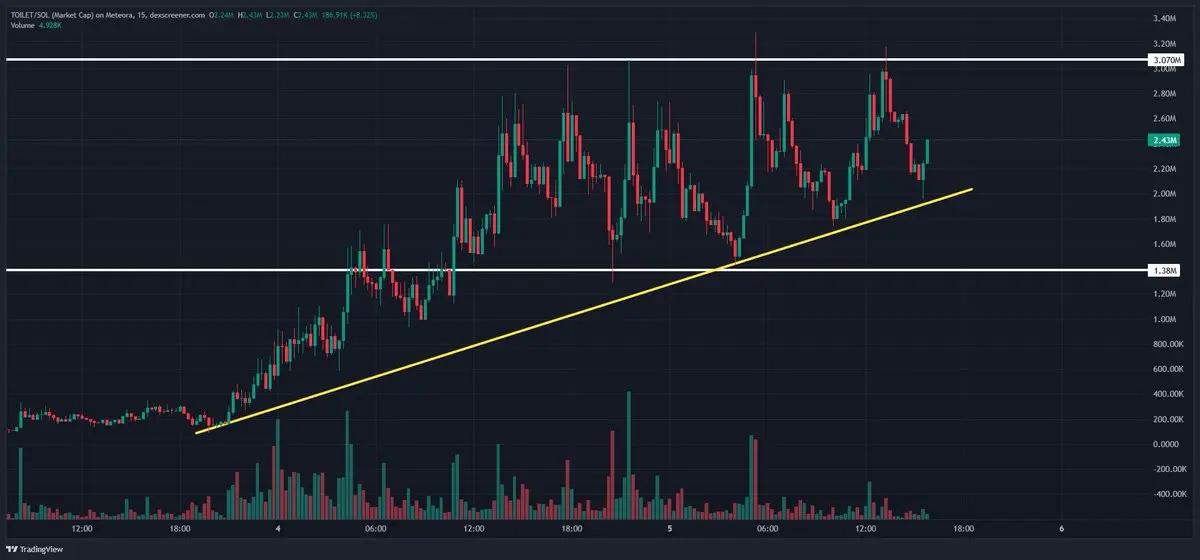
The longer $TOILET ranges in these levels and traps more entries the higher it will go
- Reward
- like
- Comment
- Repost
- Share
- Reward
- like
- Comment
- Repost
- Share
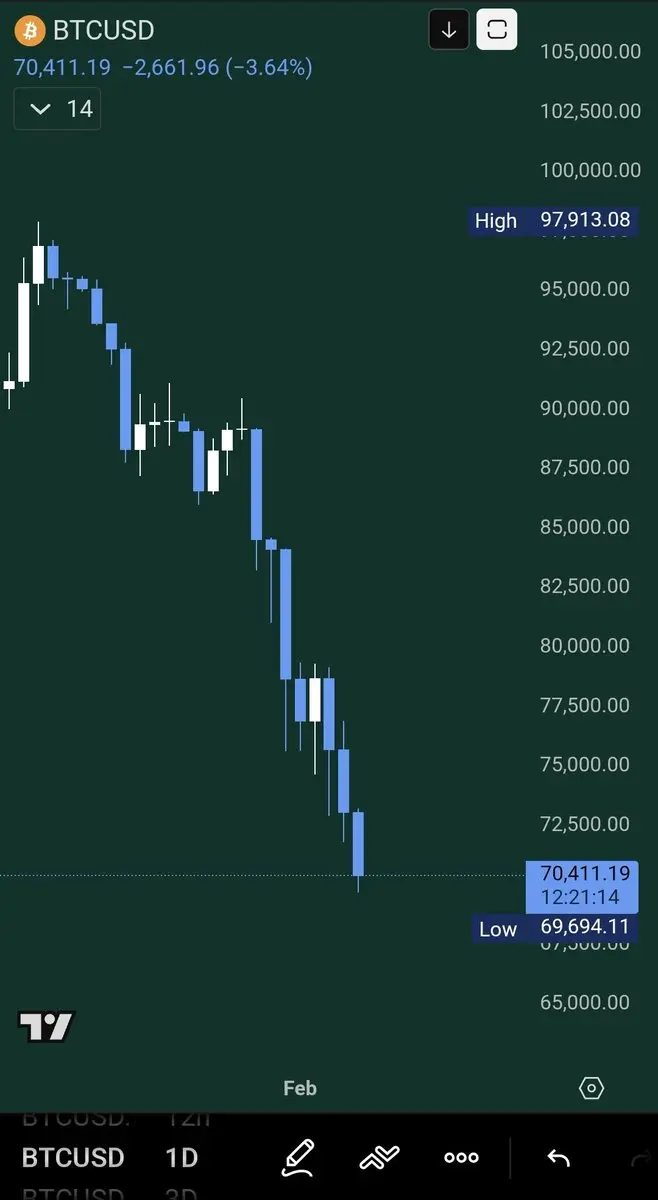
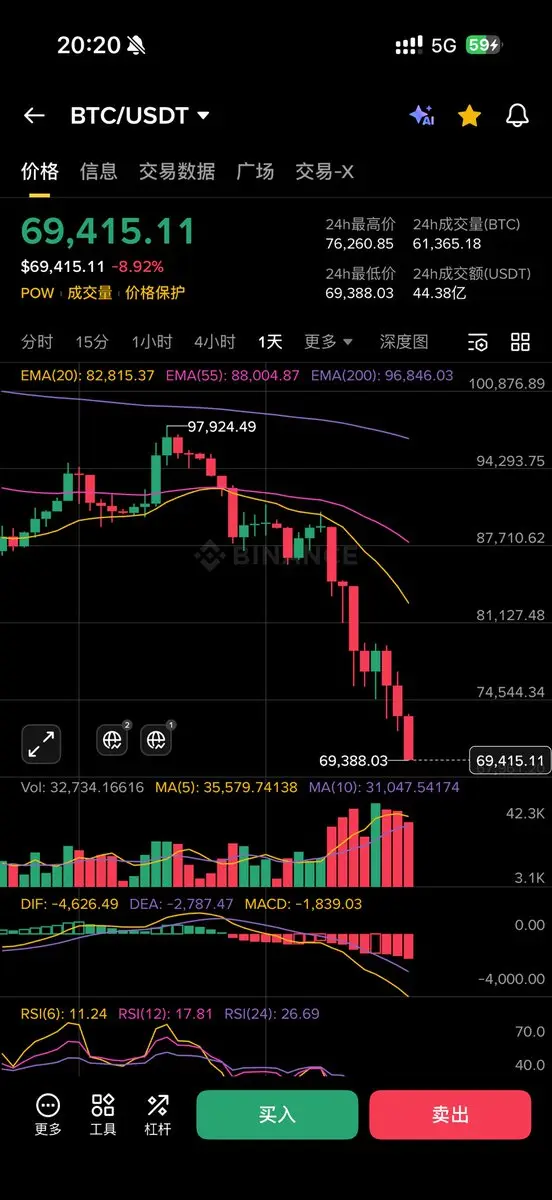
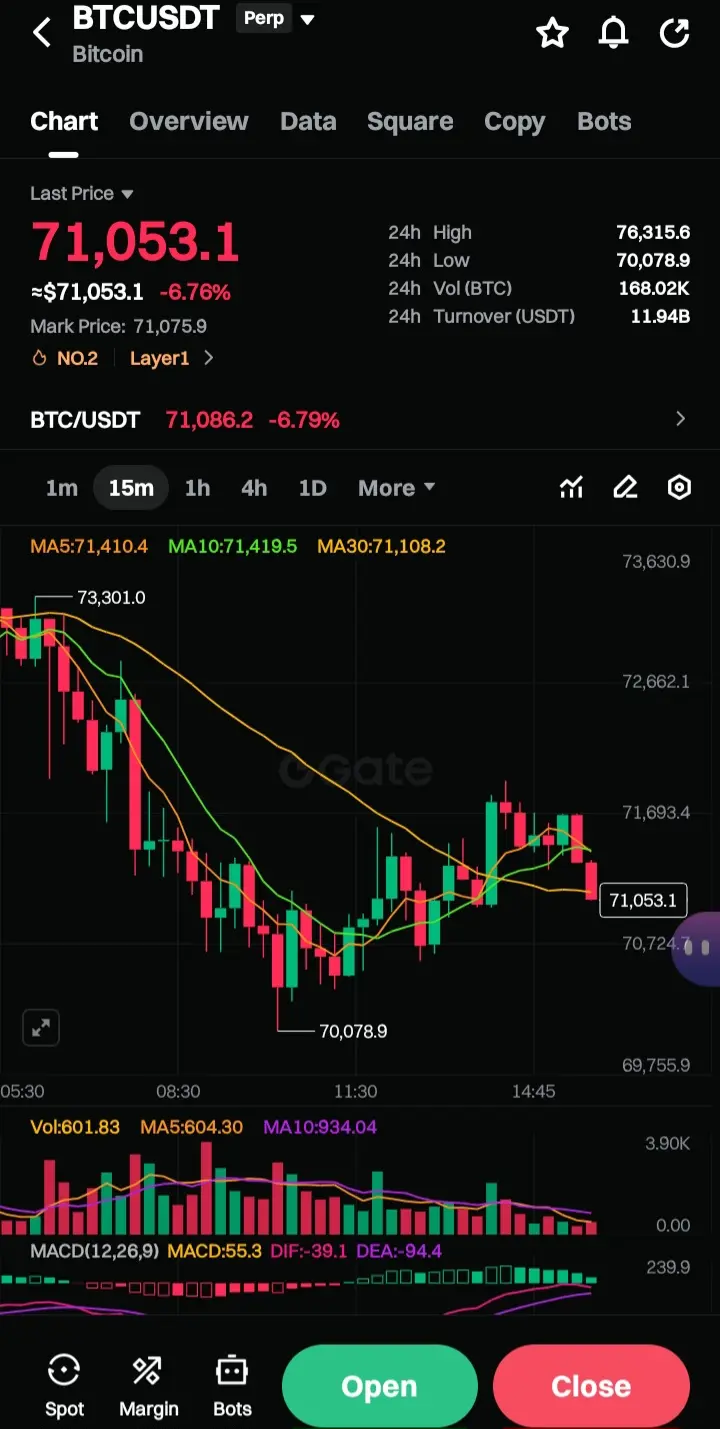
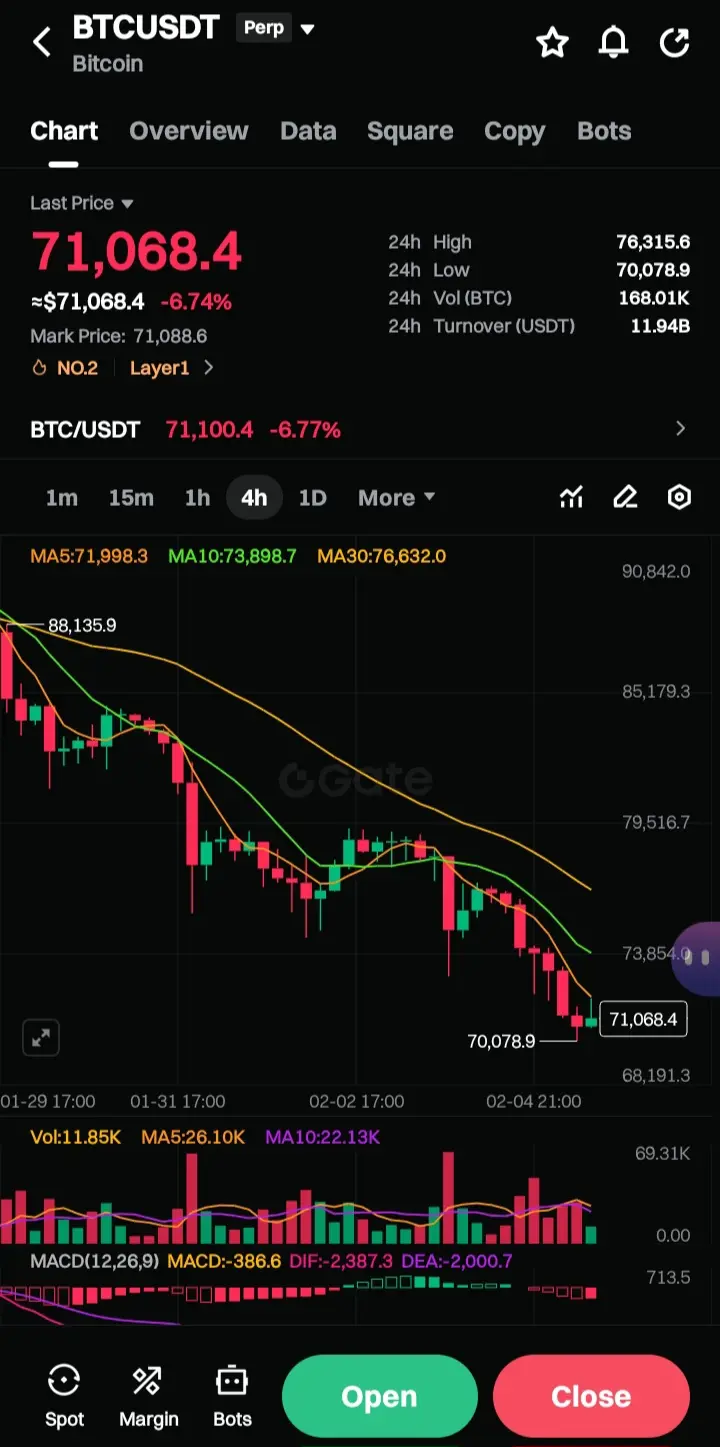
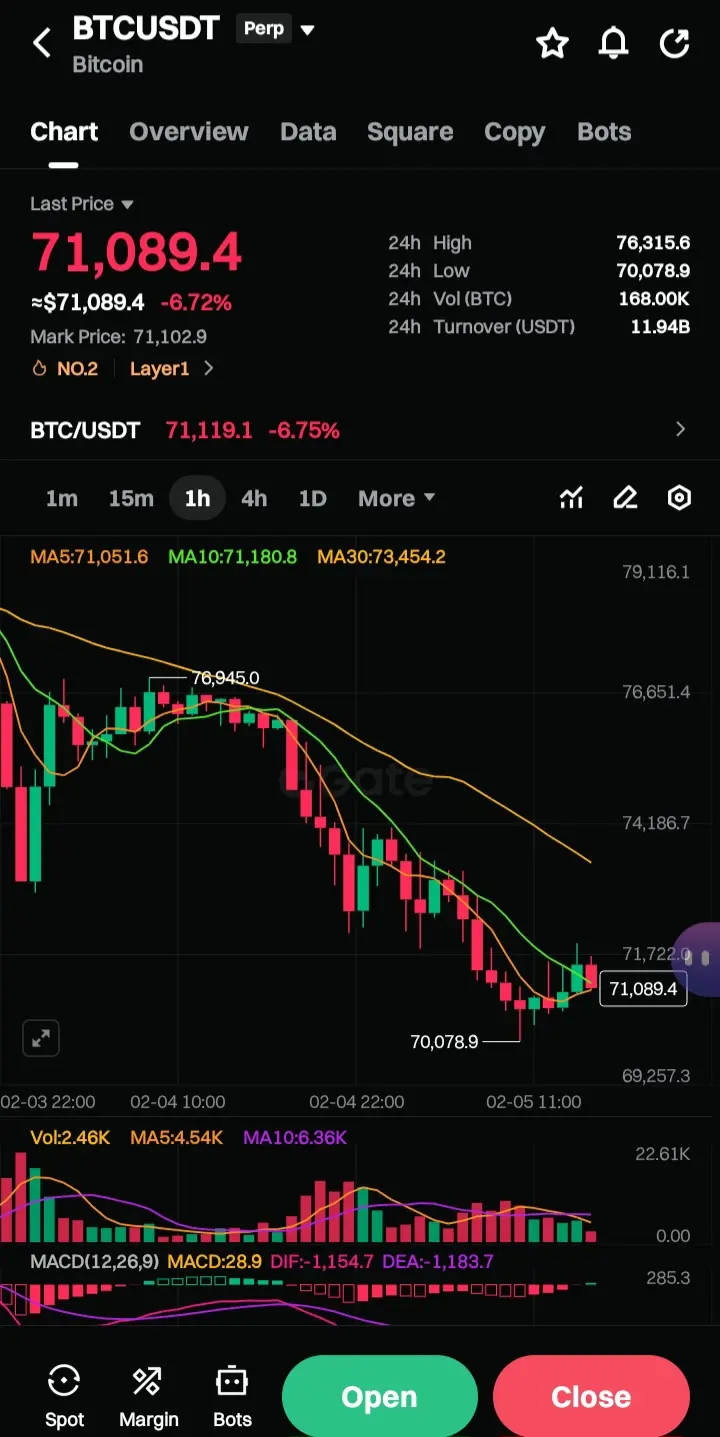
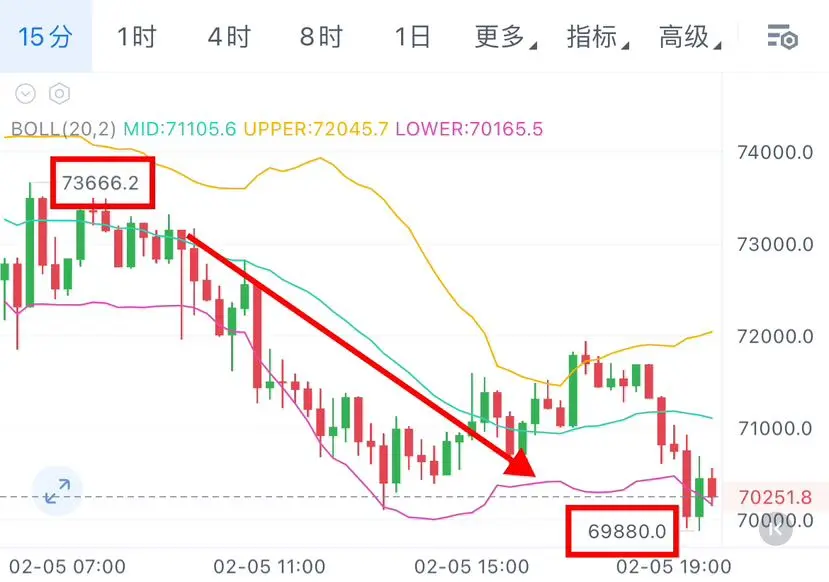
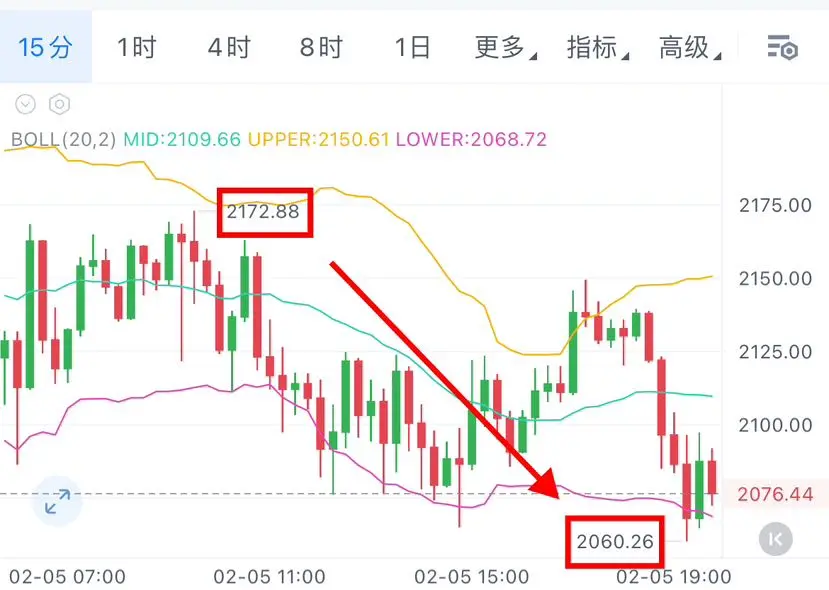
$BTC
The 15.48% drop over the last week has left the Bitcoin charts looking like a "digital graveyard" of long positions. While your screenshot shows a local bounce off $70,144, liquidation heatmaps suggest the market might not be finished with its "cleansing" process just yet.
The Liquidation Landscape: Where the "Clusters" Sit
Liquidation heatmaps act like a map of gravity. When huge clusters of leveraged positions exist at certain price points, the market tends to "hunt" that liquidity to fuel the next big move.
**The Immediate Ceiling ($78,500 – $80,000): After the recent crash,
BTC-8,98%
- Reward
- like
- 2
- Repost
- Share
EqunixHub:
👊View More
- Reward
- 1
- Comment
- Repost
- Share
Check out Gate and join me in the hottest event! https://www.gate.com/id/campaigns/3988?ref=VLNHUVXEAQ&ref_type=132

- Reward
- like
- Comment
- Repost
- Share
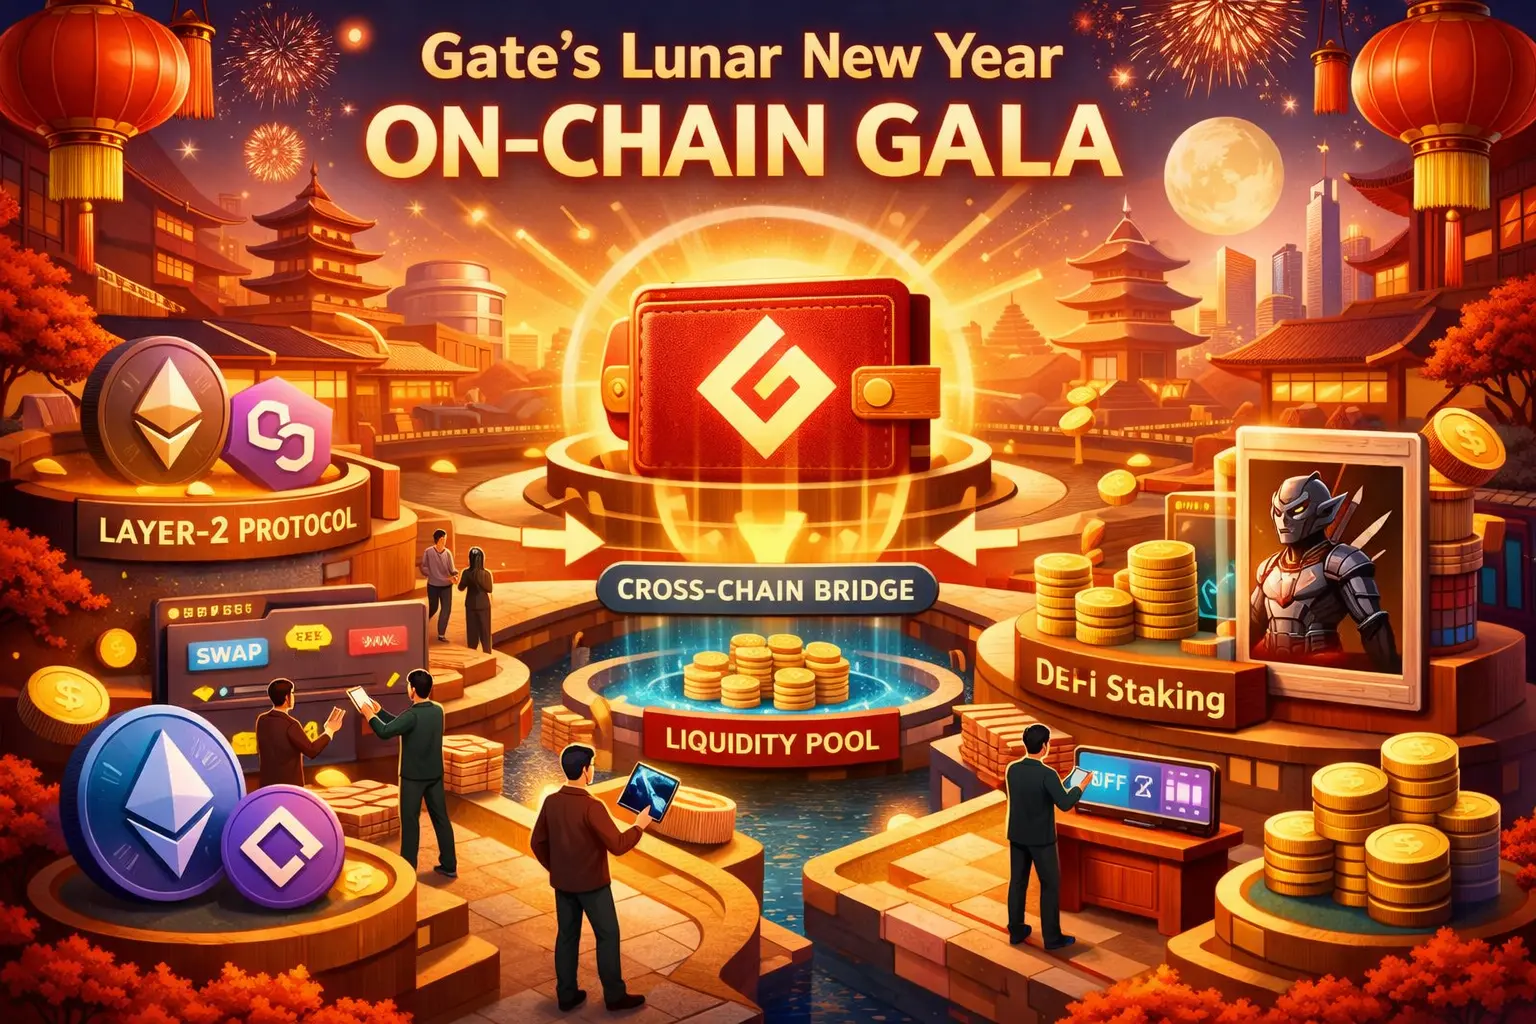
#GateLunarNewYearOn-ChainGala
Gate’s Lunar New Year On-Chain Gala should be viewed not as a festive marketing initiative, but as a carefully engineered ecosystem activation strategy designed to influence user behavior, liquidity allocation, and on-chain growth metrics during one of the most active retail periods of the year. What stands out most to me is the deliberate focus on real blockchain interaction rather than surface-level engagement, as many exchange campaigns in the past have driven temporary volume spikes without leaving a meaningful on-chain footprint. This Gala takes a fundamenta
Gate’s Lunar New Year On-Chain Gala should be viewed not as a festive marketing initiative, but as a carefully engineered ecosystem activation strategy designed to influence user behavior, liquidity allocation, and on-chain growth metrics during one of the most active retail periods of the year. What stands out most to me is the deliberate focus on real blockchain interaction rather than surface-level engagement, as many exchange campaigns in the past have driven temporary volume spikes without leaving a meaningful on-chain footprint. This Gala takes a fundamenta
- Reward
- 4
- 5
- Repost
- Share
Discovery :
:
2026 GOGOGO 👊View More
US–Iran Nuclear Talks Turmoil
Renewed uncertainty around the US–Iran nuclear talks is adding another layer of complexity to an already fragile global landscape. Diplomatic tensions, shifting demands, and regional security concerns continue to challenge progress, keeping markets and policymakers on edge.
For global investors and institutions, such geopolitical developments matter because they can influence energy prices, risk sentiment, and broader economic stability. In times like these, close monitoring of diplomatic signals and maintaining a balanced, risk-aware approach becomes essential as


- Reward
- 1
- 1
- Repost
- Share
HighAmbition:
2026 GOGOGO 👊BTC Prediction and Market Analysis
861
- Reward
- 2
- 1
- Repost
- Share
LittleQueen:
Happy New Year! 🤑白菜
白菜
Created By@GateUser-df1d4a45
Listing Progress
0.00%
MC:
$2.52K
Create My Token
Always emphasizing a high-altitude mindset, preferring to short at high levels rather than go long at low levels. These signals were very clear from the morning; Bitcoin once again broke through the 3800 mark, and Ethereum broke through the 110 mark! Follow the signal, and it's hard not to make profits!
View Original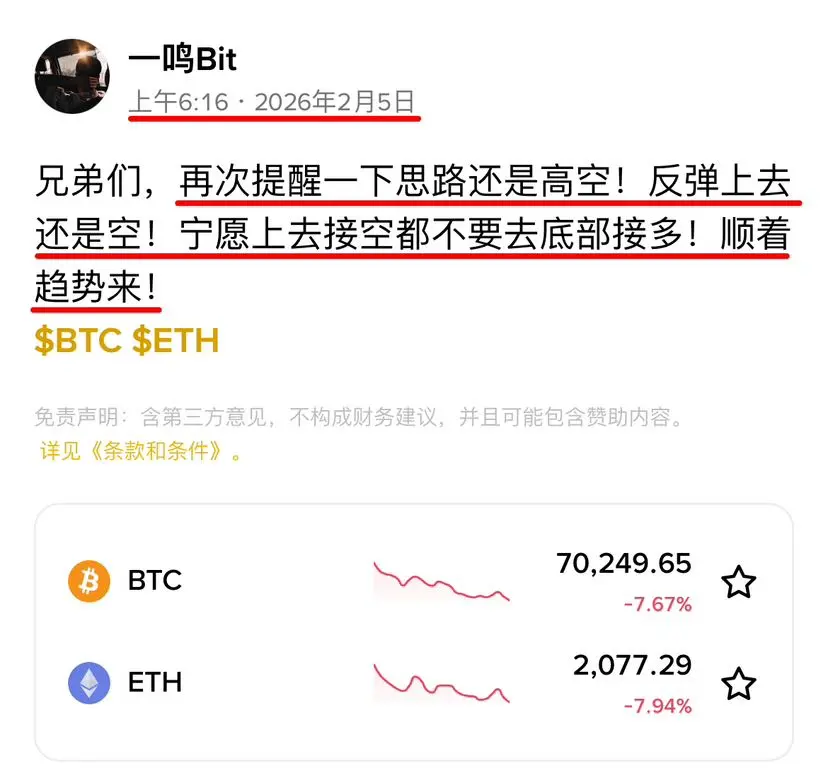
- Reward
- like
- Comment
- Repost
- Share
🚨 HUGE: House Democrat launches probe into $500M UAE deal linked to Trump\'s World Liberty Financial.


- Reward
- like
- Comment
- Repost
- Share
#GateLunarNewYearOn-ChainGala
Gate’s Lunar New Year On-Chain Gala is more than a festive campaign—it’s a strategic push to drive real on-chain participation, liquidity flow, and ecosystem engagement across multiple blockchains during a period of traditionally high retail activity.
🔗 Core Objective
The event is designed to bridge centralized exchange users with on-chain ecosystems, encouraging wallet creation, contract interaction, and multi-chain usage rather than passive trading alone.
📊 Key On-Chain Activities
Wallet-based participation: Users interact directly with supported blockchains

- Reward
- 10
- 12
- Repost
- Share
dragon_fly2:
Buy To Earn 💎View More
BTC, ETH SOL, Alt coin LIVE Analysis – Smart Trade Setup
745
- Reward
- 1
- Comment
- Repost
- Share
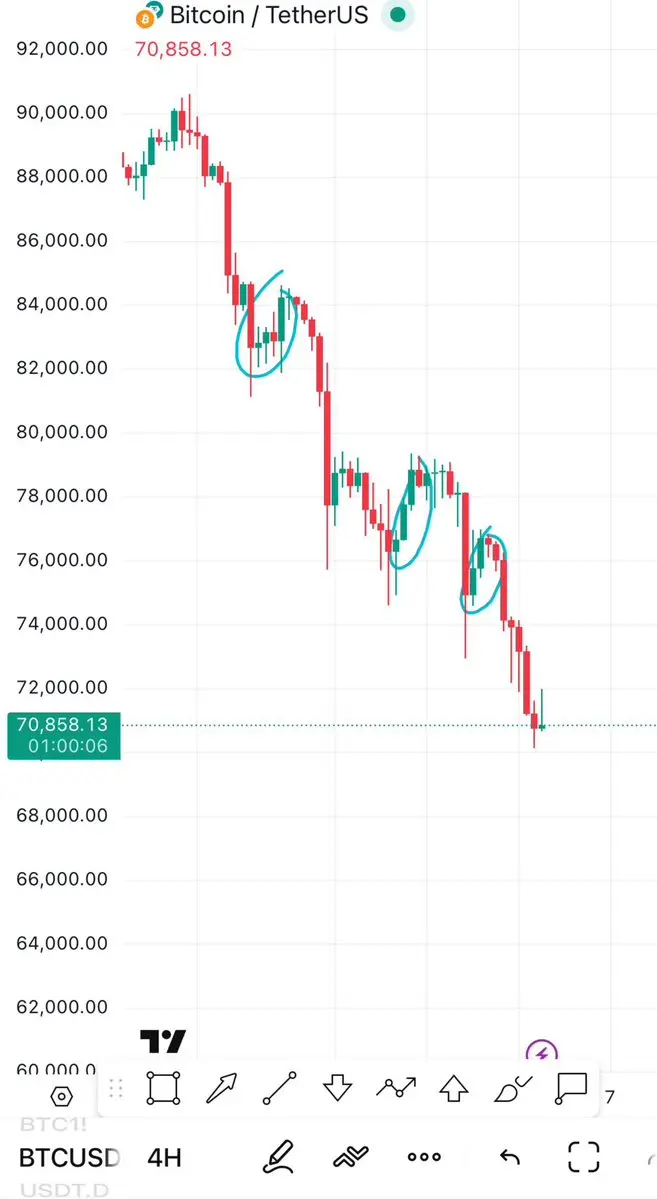
Is this kind of decline forcing the spot market to also collectively exit positions?
View Original
- Reward
- like
- Comment
- Repost
- Share
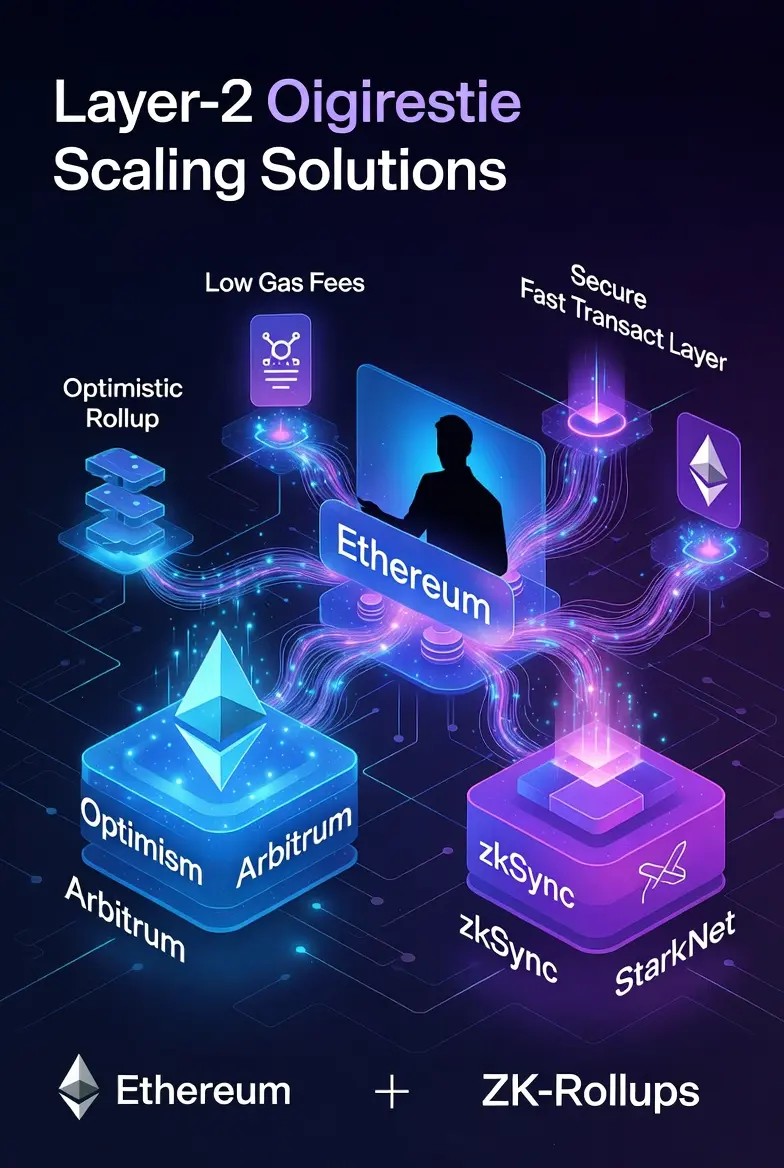
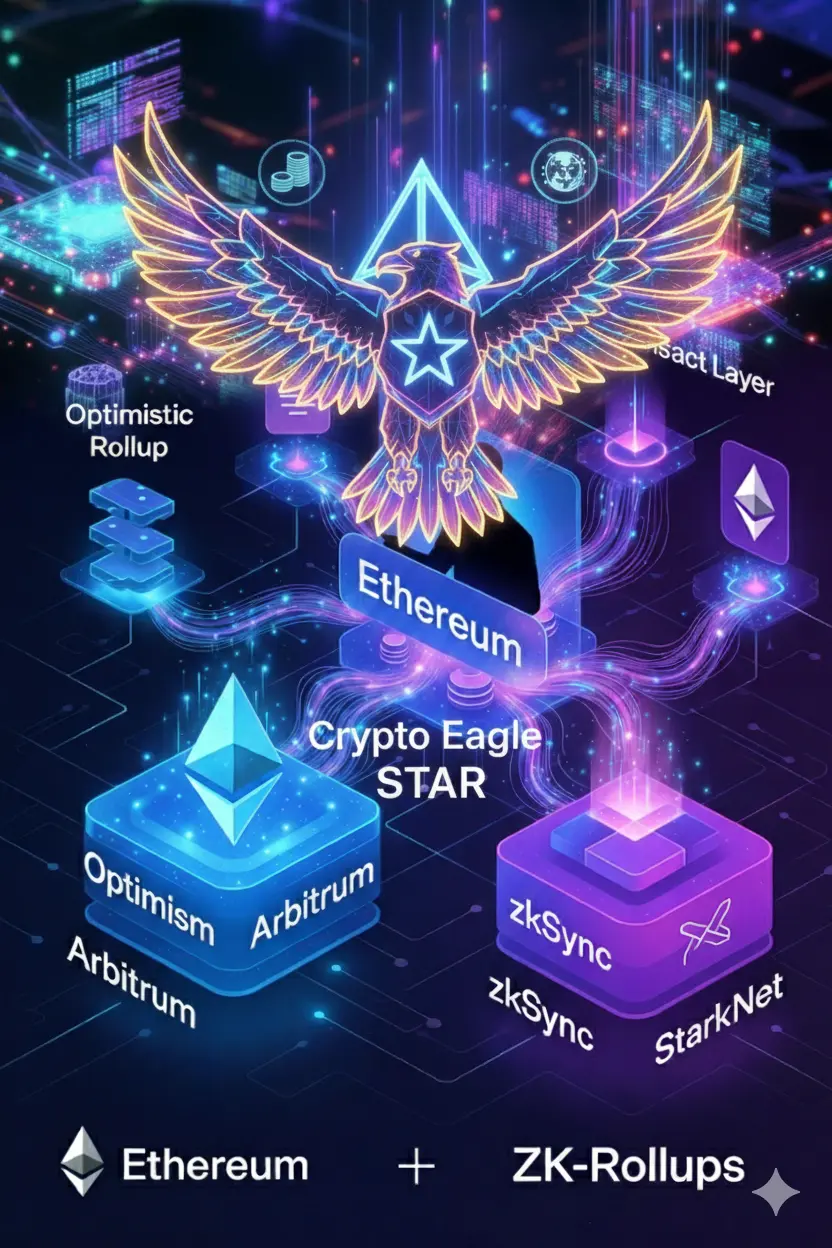
#BuyTheDipOrWaitNow? 💎 The L2 Revolution: Ethereum’s Final Form
The era of "high gas fees" is becoming a relic of the past. Ethereum has evolved, and the secret sauce isn't just the mainnet—it’s the Layer-2 (L2) Powerhouse.
🚀 Why the Hype is Real
Ethereum is no longer just a blockchain; it’s a Settlement Layer. While the mainnet provides the security, L2s provide the speed.
Arbitrum & Optimism: Leading the charge with massive TVL and thriving DeFi ecosystems.
ZK-Rollups (zkSync, StarkNet): The "Endgame" tech using zero-knowledge proofs for ultimate privacy and scale.
🛡️ The Vital

- Reward
- 1
- Comment
- Repost
- Share

- Reward
- like
- Comment
- Repost
- Share
Load More
Join 40M users in our growing community
⚡️ Join 40M users in the crypto craze discussion
💬 Engage with your favorite top creators
👍 See what interests you
Trending Topics
View More76.08K Popularity
4.32K Popularity
1.62K Popularity
1.96K Popularity
6.02K Popularity
Hot Gate Fun
View More
News
View MoreJPMorgan Report: Gold prices may rise to $6,300 per ounce by the end of 2026
2 m
Bullish: In Q4, Bitcoin options trading volume exceeded $9 billion, marking a significant increase in market activity and investor interest during the quarter.
3 m
Gate DEX Launches the Warm Spring Exchange Cashback Contest, Participate to Win 20,000 USDT
3 m
Gate Research Institute: BTC implied volatility rises to an 81% one-year percentile, with options put spread strategies dominating the market
6 m
BitMart launches Rainbow (RNBW)
11 m
Pin