Scan to Download Gate App
qrCode
More Download Options
Don't remind me again today
BankOfChinaReview
vip
Market Analyst
Futures Trading Strategist
Peak Tier 5
☞ Live stream every night at 11:00! No highs or lows in the heart, no prices in the heart, trade as you wish. short-term offense trend Be the strongest suckers, be the fastest sickle.
Pin
Everyone wants an analysis of the price trend of a certain 币.
You can type the coin names in the comment area!
Give it to everyone after liking and commenting! 👌
View Original
  • Reward
  • 7
  • Repost
  • Share
Fengyavip:
Where can I learn this subscription? I can't find anyone at all, when are you online?
View More
XAN November 19 Market Analysis
1. Trend Analysis
· Mid-term adjustment pattern: The price has entered an adjustment after reaching a high of 0.08821, currently falling back to 0.04330.
· Divergence in the moving average system: the price is below the EMA50 but still above the EMA100.
· Short-term pressure: The EMA50 at 0.04501 forms resistance.
· Mid-term support: The EMA100 at 0.04139 provides support.
· The long-term trend remains upward: all prices are above the long-term EMA, and the long-term trend remains intact.
2. Price Position Analysis
· Key price level competition: Currently oscill
XAN-20.51%
View Original
post-image
  • Reward
  • Comment
  • Repost
  • Share
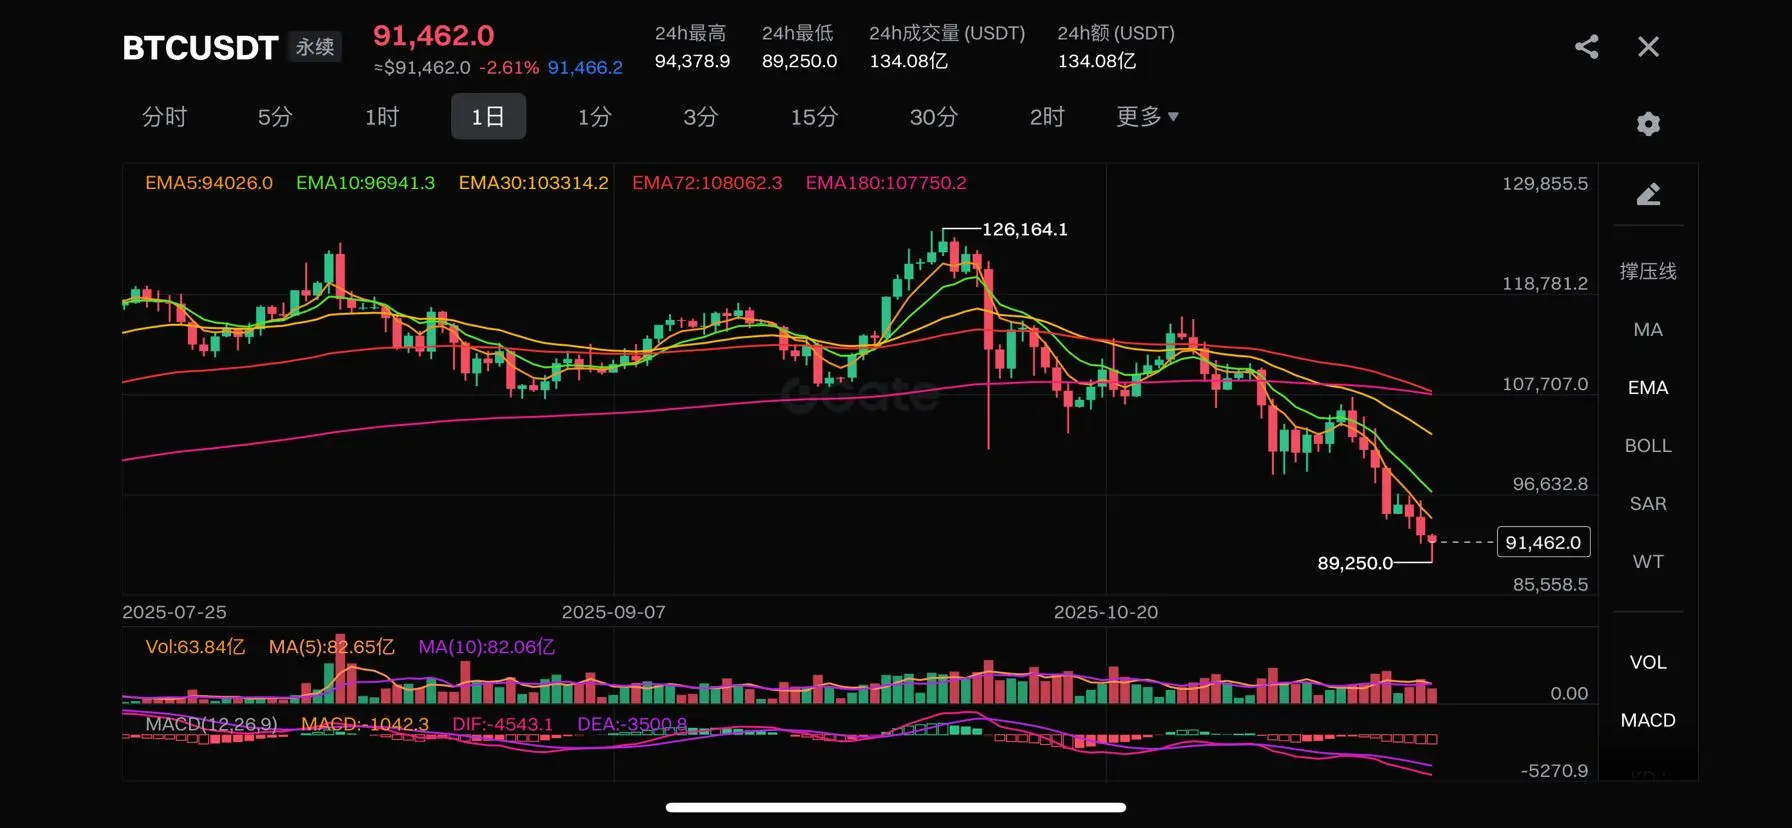
BTC August 18 Market Analysis
1. Trend Analysis
· Clear bearish alignment: Price is below all major EMAs, and the EMAs are in perfect bearish alignment.
· Key psychological barrier breached: the price has fallen below the important support level of 92,000
· The decline is widening: The drop from the previous high point has further increased, with enhanced bearish momentum.
· MACD confirms weakness: DEA's deep negative value indicates strong bearish momentum.
2. Price Position Analysis
· Testing key support: The price is testing the key support at 89,250.0 (24-hour low).
· Intensified overs
BTC-3.51%
View Original
post-image
  • Reward
  • Comment
  • Repost
  • Share
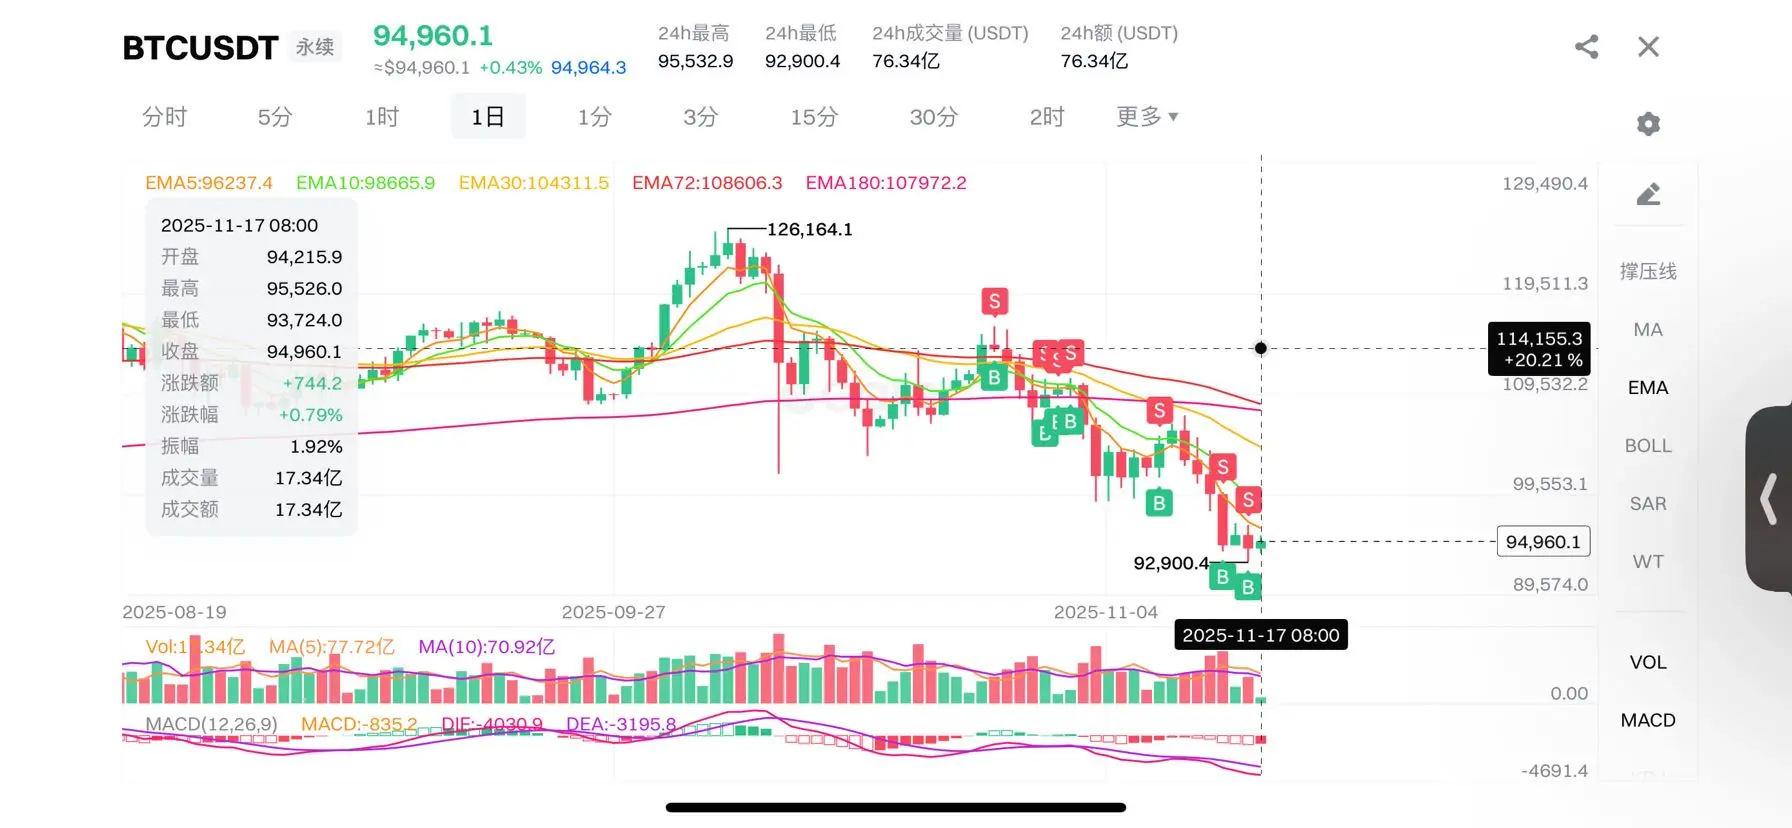
BTC November 17 Market Analysis
1. Trend Analysis
· Strong bearish pattern: Price is below all EMAs, and the EMAs are perfectly aligned in a bearish formation.
· Key support breakdown: The price has fallen below the important psychological level of 100,000.
· Bollinger Bands Analysis: The price touched the lower Bollinger Band at 98,716.1, indicating an oversold condition.
· Depth pullback confirmation: from the high of 118,799.8 down to the current, a drop of more than 16%
2. Price Position Analysis
· At a critical decision point: Price is supported at 97,931.5 (24-hour low)
· Potential overs
BTC-3.51%
View Original
post-image
  • Reward
  • Comment
  • Repost
  • Share
short-term cut positions long term hold
short-term chasing highs long term buying the dip
View Original
  • Reward
  • Comment
  • Repost
  • Share
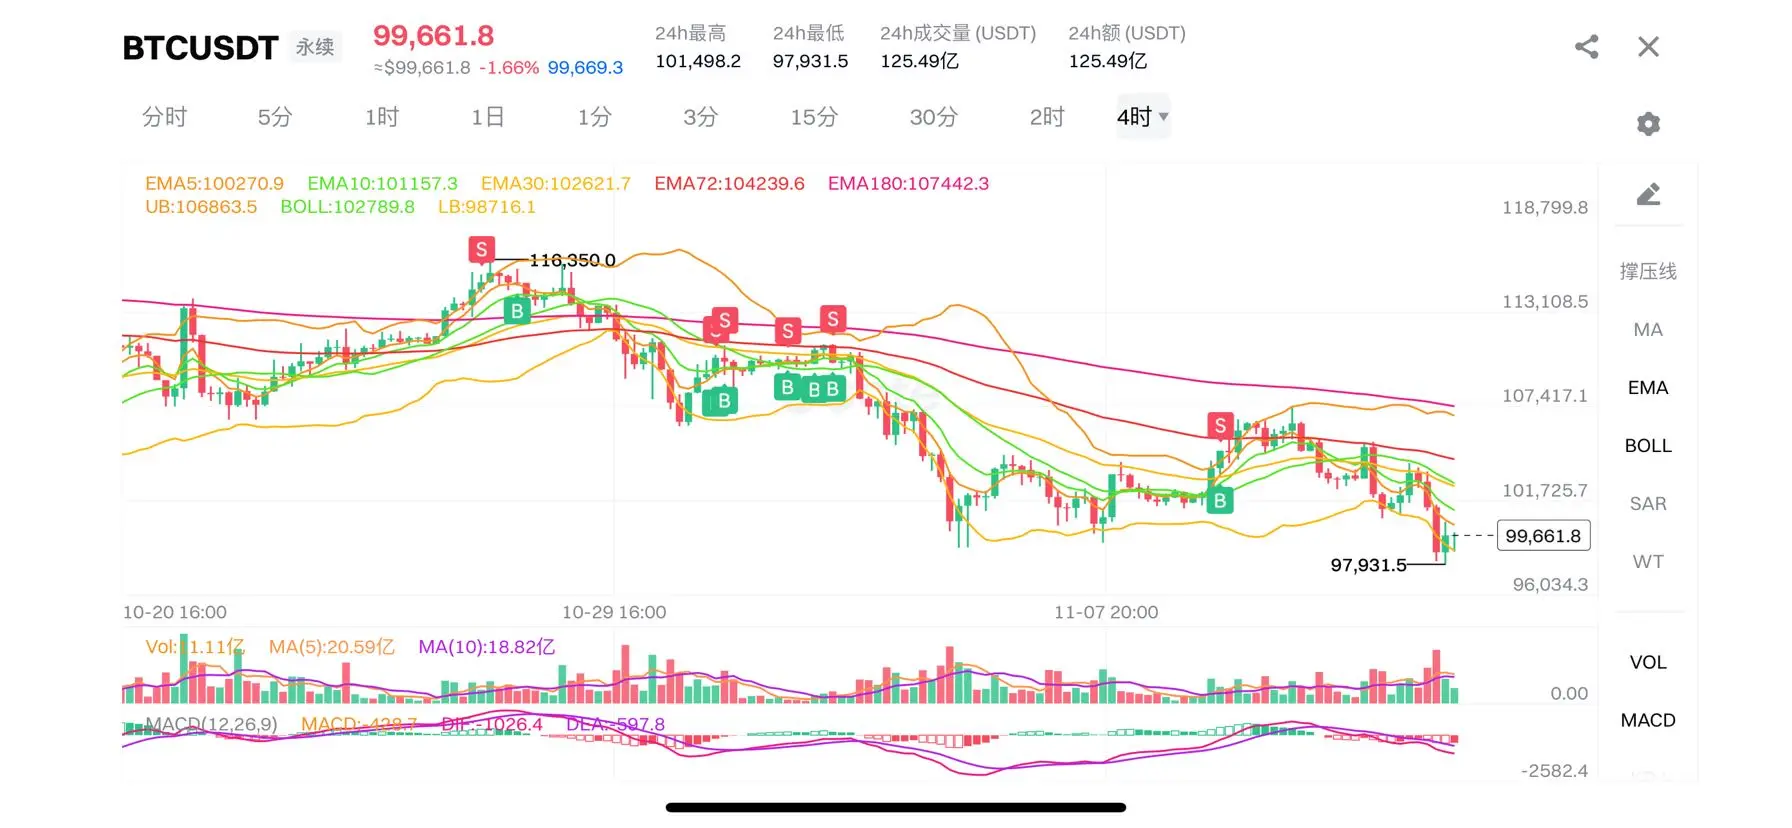
BTC Market Analysis on October 14
1. Trend Analysis
· Strong bearish pattern: Price is below all EMAs, and the EMAs are in perfect bearish alignment.
· Key support breakdown: The price has fallen below the important psychological level of 100,000.
· Bollinger Bands Analysis: The price has touched the lower Bollinger Band at 98,716.1, indicating an oversold condition.
· Deep pullback confirmation: From the peak of 118,799.8, it has dropped to the current level, with a decline of over 16%.
2. Price Position Analysis
· At a critical decision point: the price is supported at 97,931.5 (24-hour low)
BTC-3.51%
View Original
post-image
  • Reward
  • 3
  • Repost
  • Share
SCORPIONKINGvip:
very very 👍😊😊❤️❤️ beautiful
View More
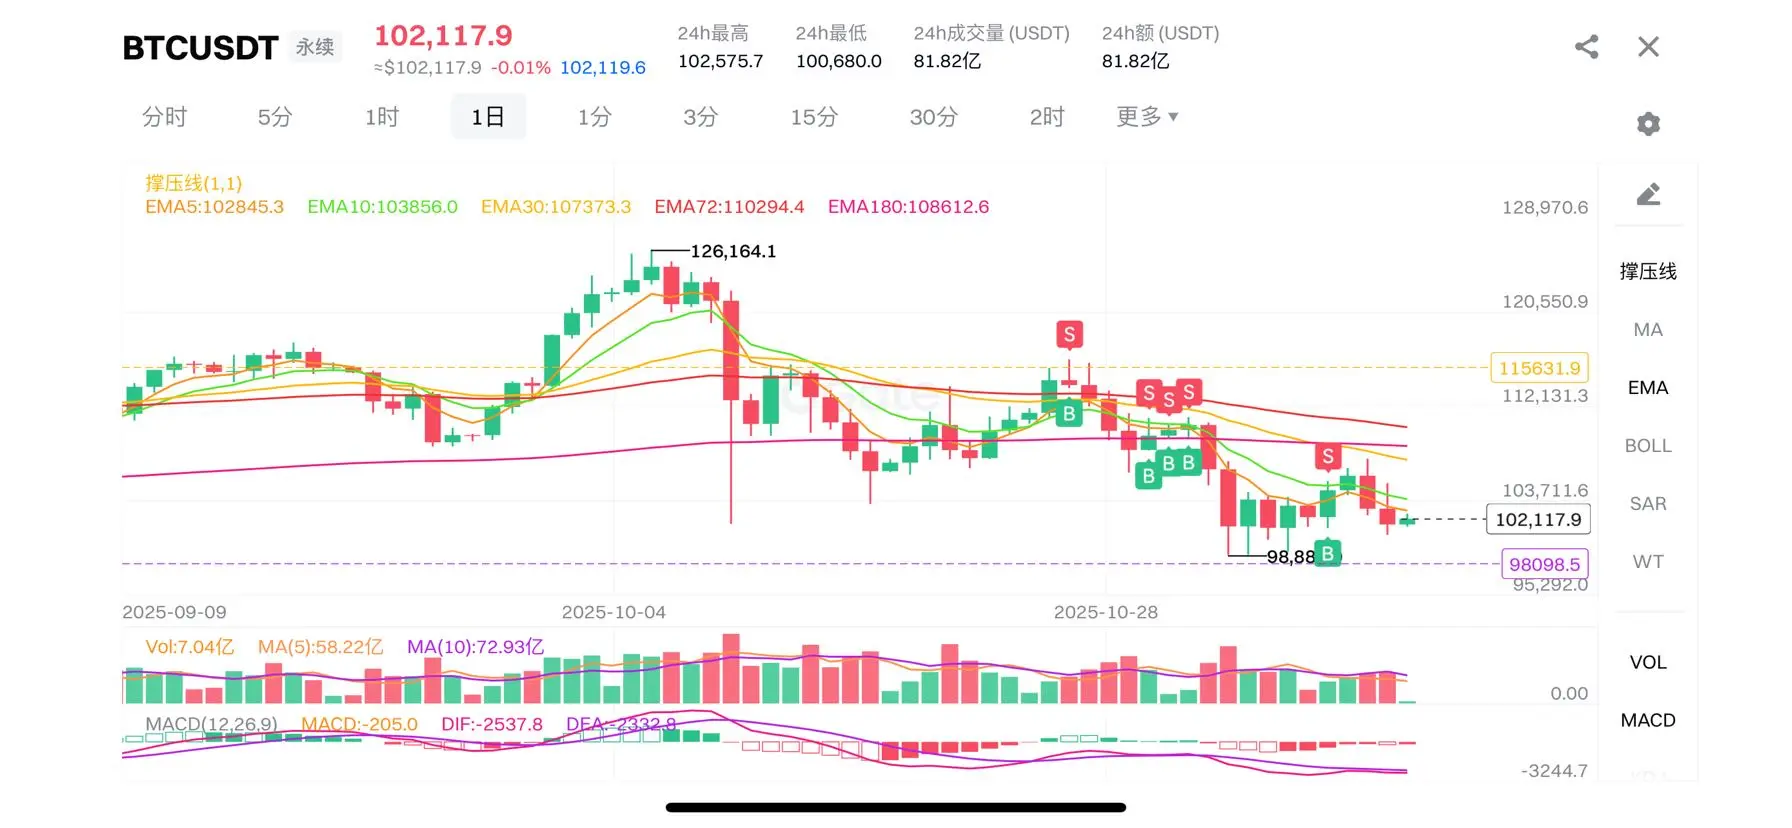
BTC Market Analysis on October 13
1. Trend Analysis
· The bearish pattern remains: the price is below all EMAs, showing a complete bearish arrangement.
· Interval fluctuation characteristics: Fluctuating and consolidating in the range of 100,680-102,575
· Key support test: Price found support at 100,680.0 (24-hour low)
· The moving average pressure is evident: EMAs across all timeframes are showing a downward trend, indicating strong resistance.
2. MACD Indicator Analysis
· Short selling momentum continues:
· The MACD value is -205.0, the DIF is -2,537.8, both are deep negative values.
· T
BTC-3.51%
View Original
post-image
  • Reward
  • 1
  • Repost
  • Share
GateUser-87678ae4vip:
Just go for it💪
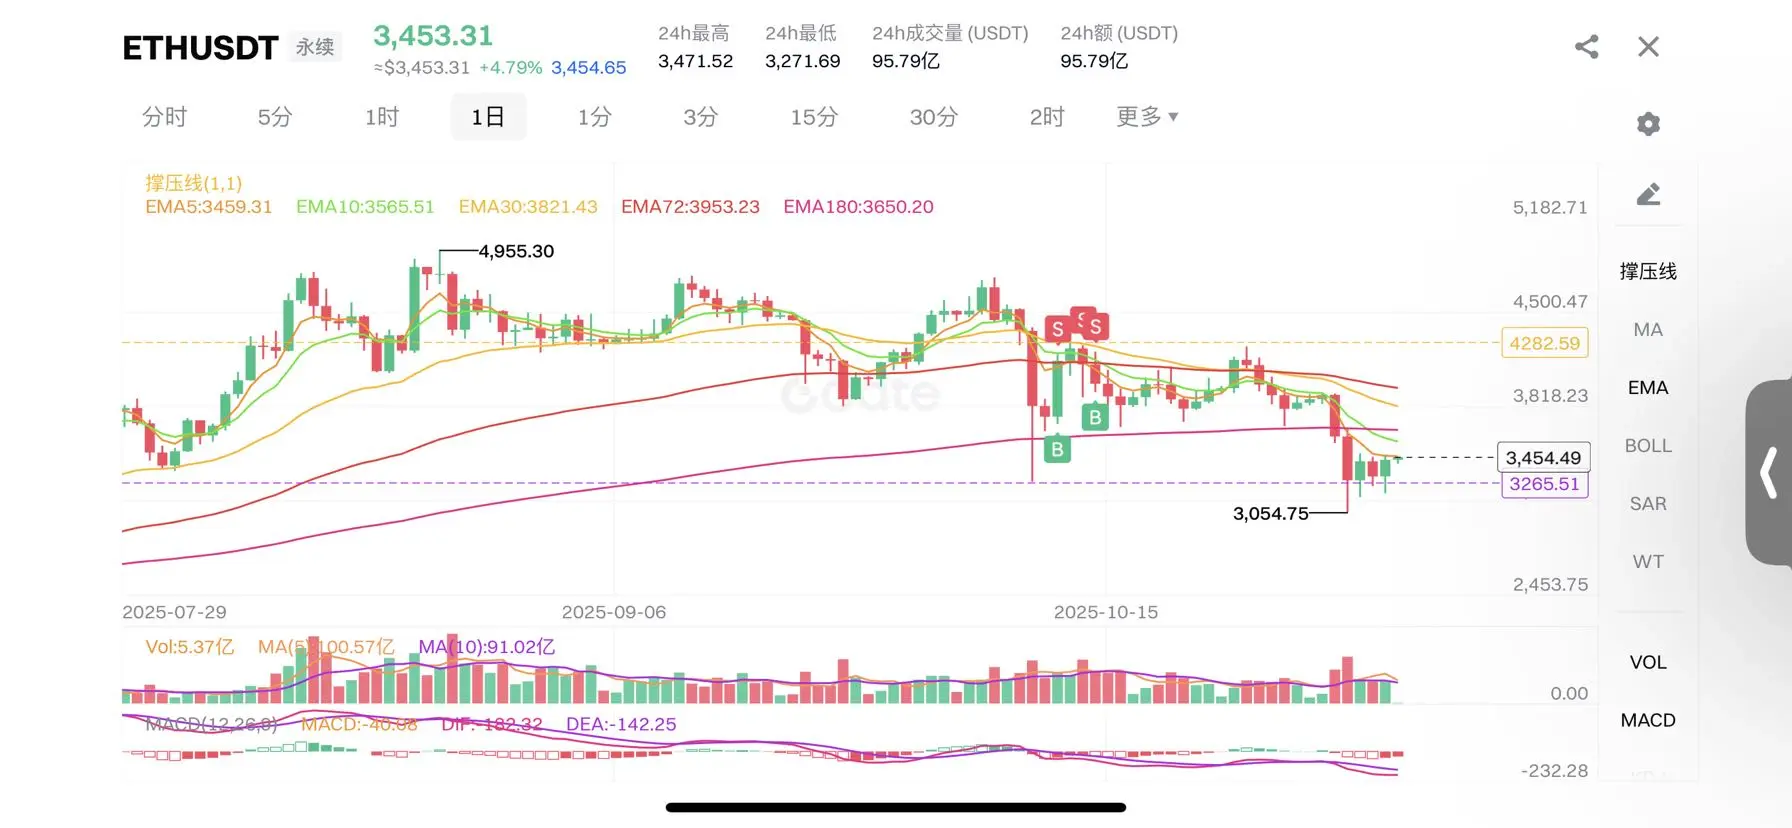
ETH Market Analysis on October 8
1. Trend Analysis
· Oversold rebound confirmation: A single-day surge of 4.79%, strongly rebounding from the low of 3,271.69
· Key level breakout: Price has broken above EMA5(3,459.31), and is currently testing this key resistance.
· The bearish pattern remains: still below key moving averages such as EMA10, EMA30, and EMA72.
· Positive signal: Price has risen above EMA180(3,650.20)
2. MACD Indicator Analysis - Important Trend Reversal Signals
· Bullish divergence golden cross formation:
· DIF(+86.32) has clearly crossed above DEA(-142.25)
· Although the MA
ETH-4.68%
View Original
post-image
  • Reward
  • Comment
  • Repost
  • Share
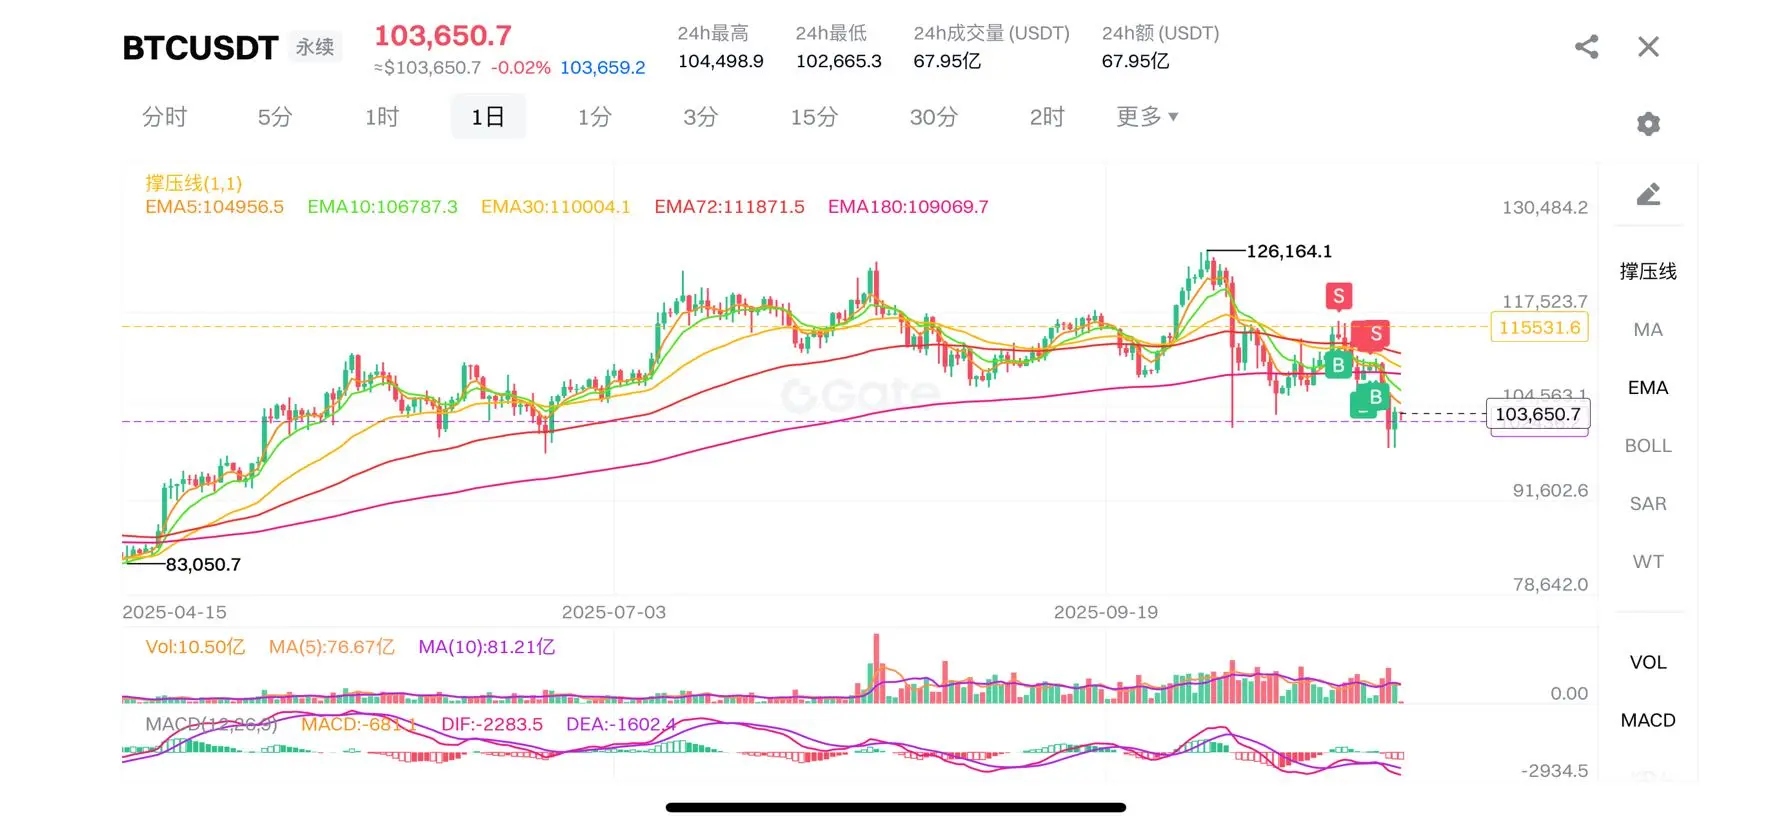
BTC Market Analysis on October 6
1. Trend Analysis
· Clear bearish pattern: Price is below all EMAs, showing a complete bearish arrangement.
· Range fluctuation characteristics: narrow fluctuations within the range of 102,665-104,499
· Key level: Price found support above the previous low of 101,553.1
· Moving Average Resistance: All periods of EMA are showing a downward trend, indicating strong resistance.
2. MACD Indicator Analysis
· Short selling momentum continues but is slowing down:
· The MACD value is -68.1, relatively small, indicating a slowdown in downward momentum.
· DIF and DEA
BTC-3.51%
View Original
post-image
  • Reward
  • Comment
  • Repost
  • Share
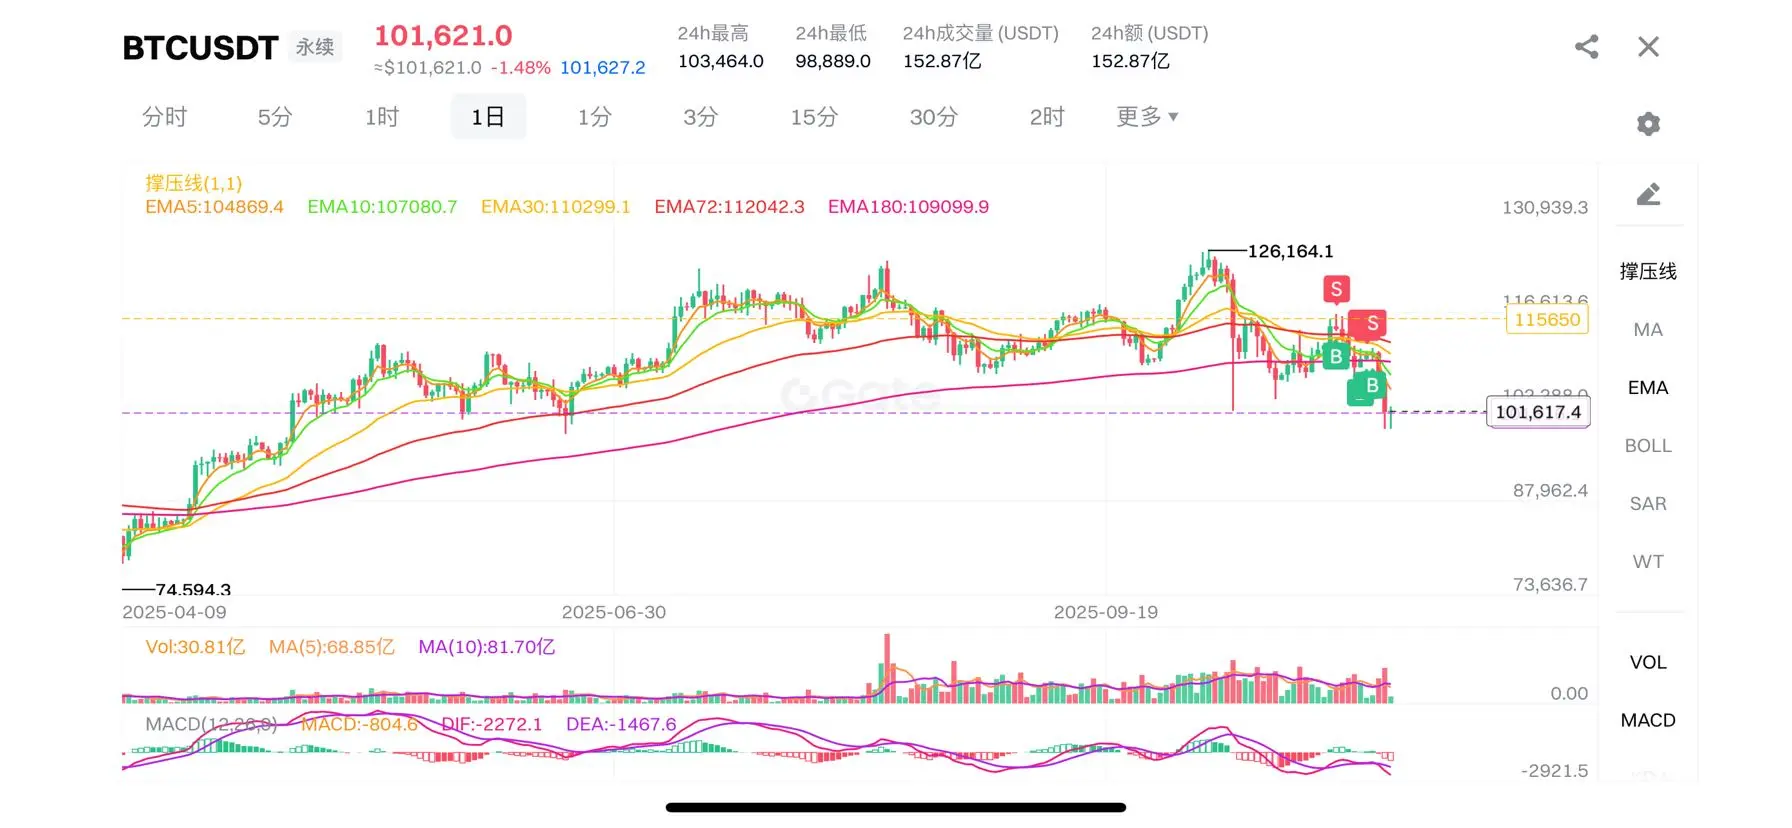
BTC November 5 Market Analysis
1. Trend Analysis
· Strong bearish pattern: The price is below all EMAs, showing a perfect bearish alignment.
· Deep correction status: dropped from a high of 130,934.3 to the current 101,621.0, a decline of over 22%.
· Key support test: The price rebounded after finding support at 98,889.0 (24-hour low)
· Serious moving average suppression: All period EMAs are showing a downward trend, with multiple resistances.
2. MACD Indicator Analysis
· Strong bearish momentum:
· The MACD value is -304.6, the DEA is -1467.6, both are deep negative values.
· The downward
BTC-3.51%
View Original
post-image
  • Reward
  • 4
  • Repost
  • Share
Syriavip:
I seek forgiveness from Allah the Almighty and I repent to Him.
View More
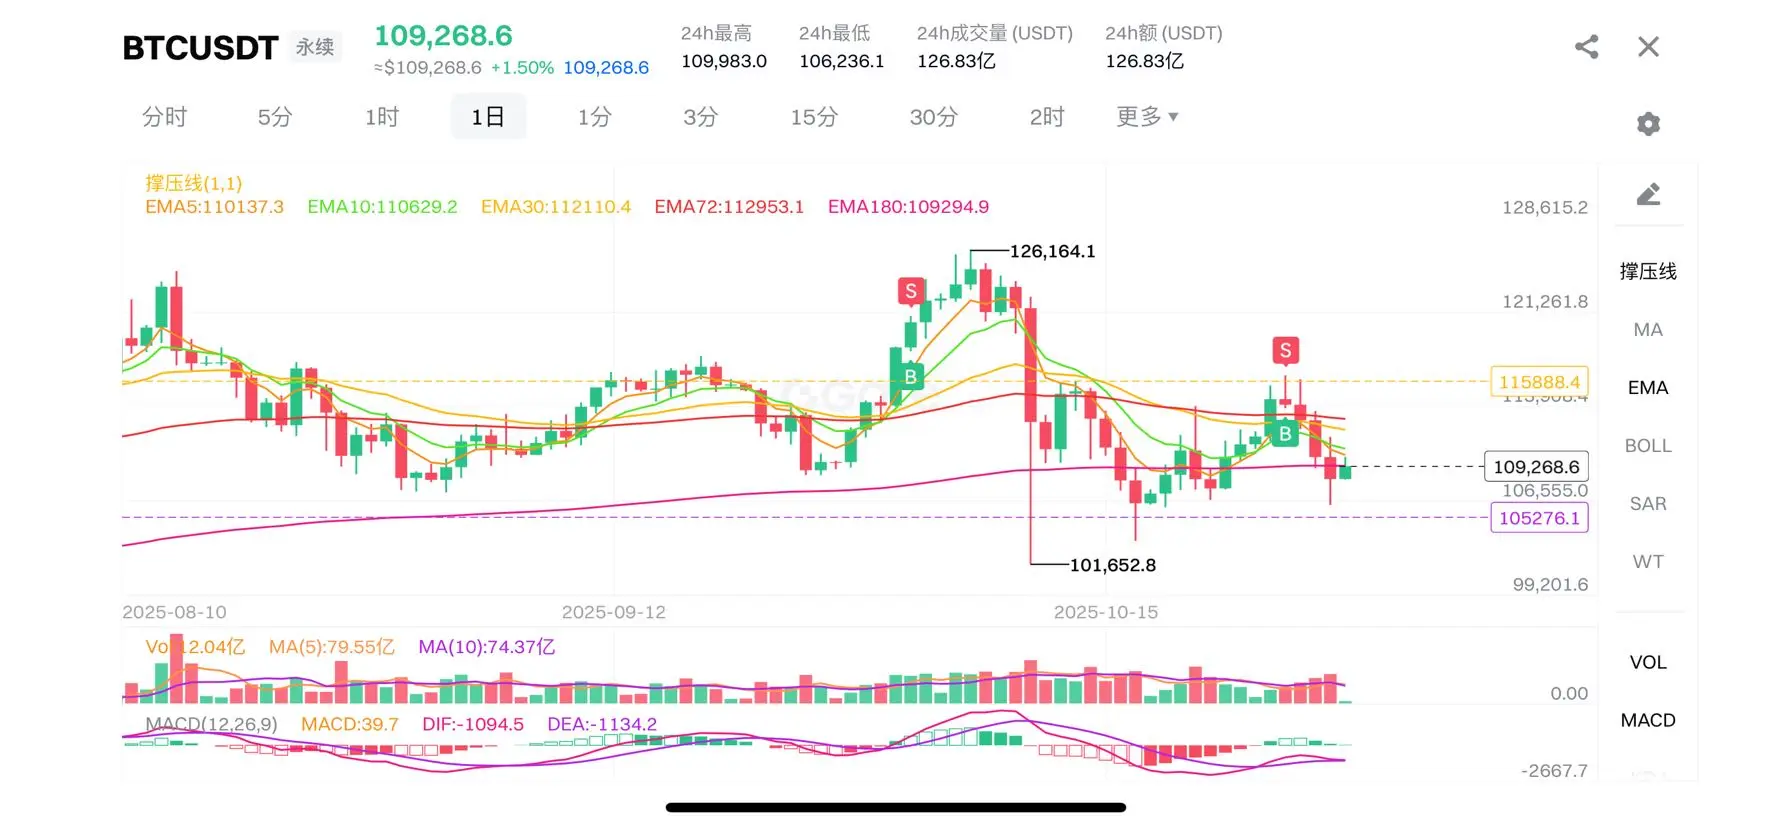
BTC Market Analysis on October 31
1. Trend Analysis
· Key position contest: The current price of 109,268.6 is almost overlapping with the EMA180 at 109,294.9, testing this important long-term support.
· Short selling pressure still exists: the price is below EMA5, EMA10, EMA30, and EMA72, indicating a weak short-term trend.
· Signs of rebound: The price has rebounded from the low of 106,236.1 to the current level, indicating that buying pressure has started to come in.
· Deep pullback status: down from the high point of 128,615.2 to the current level, a decline of about 15%
2. MACD Indicator A
BTC-3.51%
View Original
post-image
  • Reward
  • 1
  • Repost
  • Share
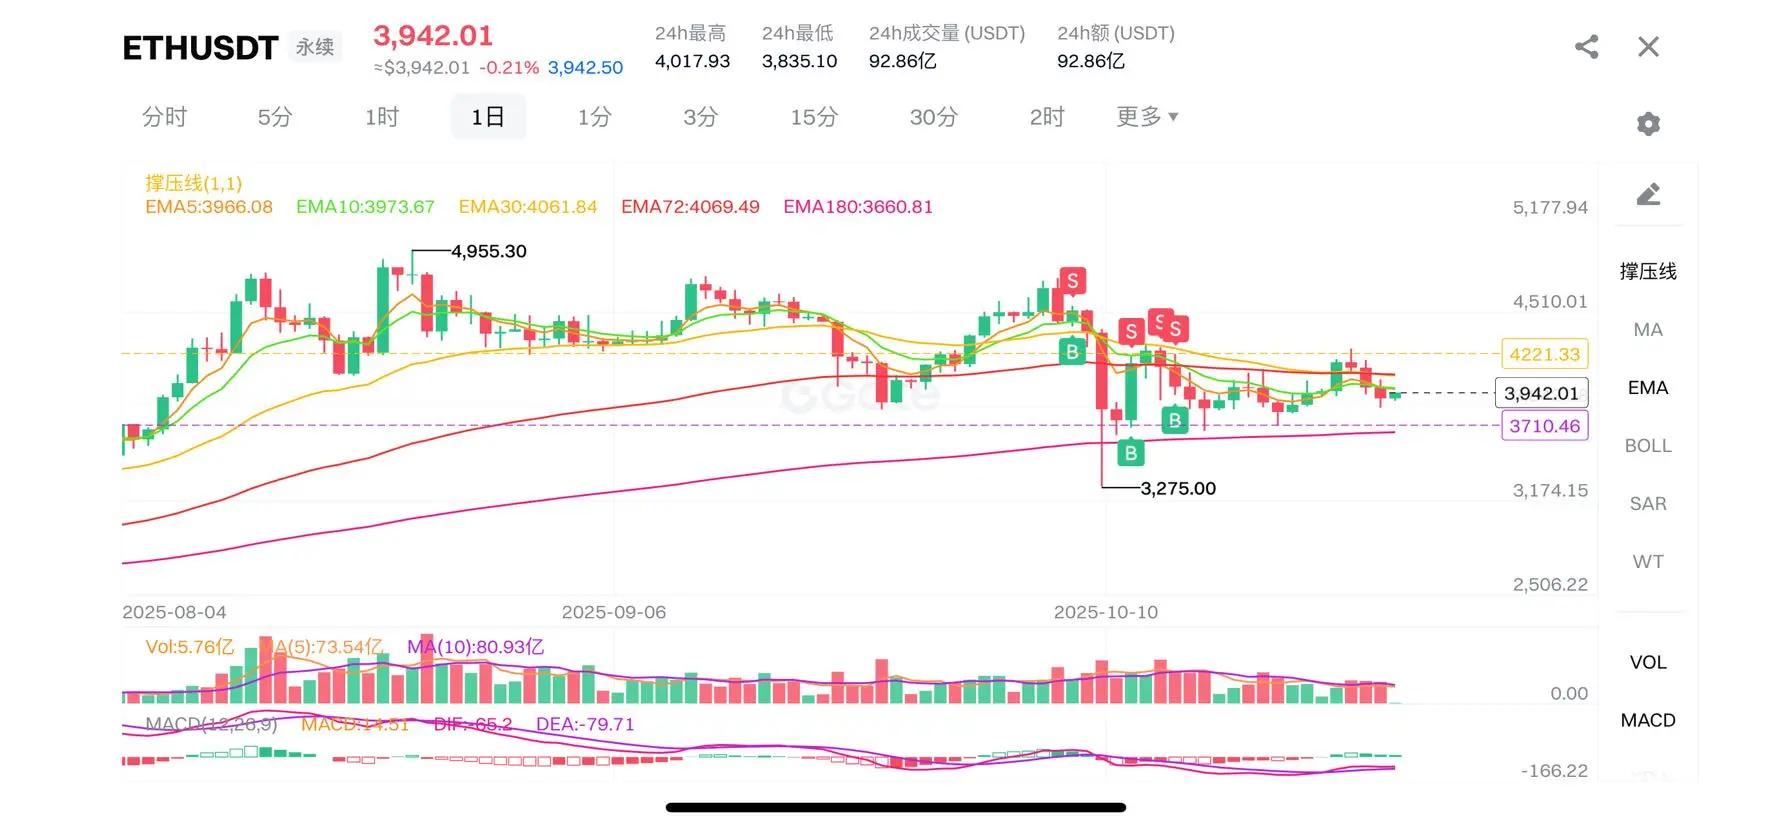
ETH Market Analysis on October 30
1. Trend Analysis
· The bearish pattern remains unchanged: the price is still below all short to medium-term EMAs.
· Key level breakout: The price rebounded from the low of 3,835.10 to the current 3,942.01, recovering part of the decline.
· Moving Average Resistance: EMA5, EMA10, EMA20 form a dense resistance zone
· Long-term support is effective: EMA180(3,660.81) provides strong support.
2. MACD Indicator Analysis - Important Trend Reversal Signal
· Golden cross preliminary formation:
· DIF(-6.62) has crossed above DEA(-7.07)
· Although the MACD histogram
ETH-4.68%
View Original
post-image
  • Reward
  • Comment
  • Repost
  • Share
  • Reward
  • Comment
  • Repost
  • Share
The reason you are reluctant to set a stop loss is that you are using "hope" instead of "strategy."
View Original
post-image
  • Reward
  • Comment
  • Repost
  • Share
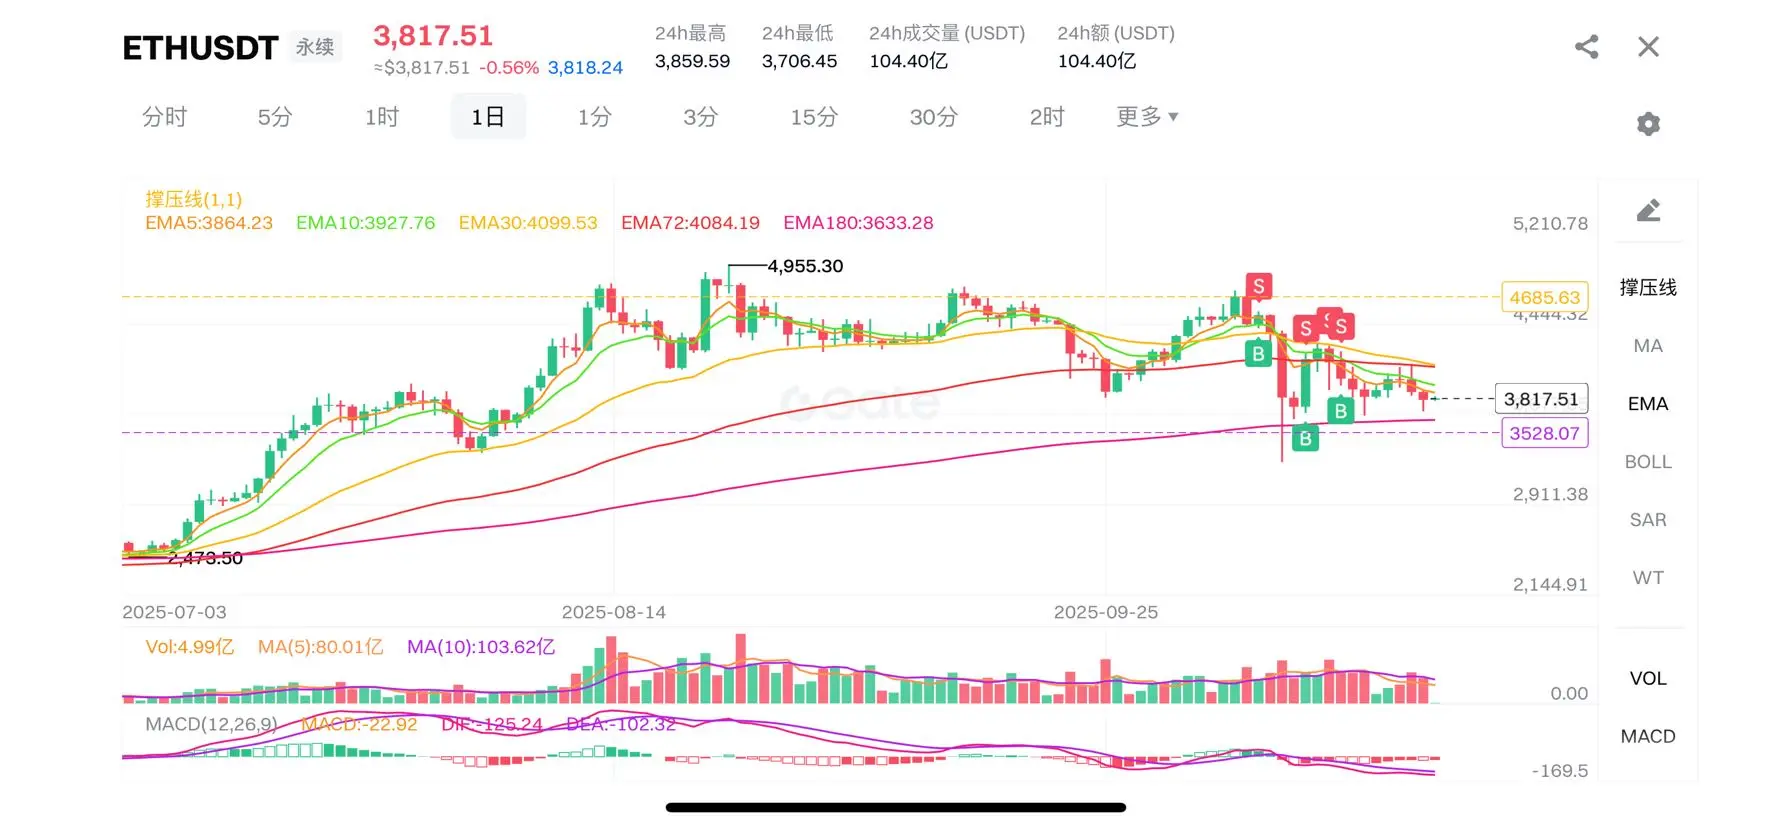
ETH Market Analysis on October 23
#ETH反弹在即?
1. Trend Analysis
· Bearish pattern is solid: The price is below all short- to medium-term EMAs, showing a standard bearish arrangement.
· Deep pullback confirmation: dropped from the high of 4,666.63 to the current 3,817.51, a decline of over 18%
· Key position: The price is fluctuating in the range of 3,706-3,859, testing the support below.
· Unique support: EMA180(3,633.28) remains an important long-term support.
2. MACD Indicator Analysis
· Short selling momentum continues:
· DIF(-125.24) < DEA(-102.34), the MACD histogram is negative (-22.92)
ETH-4.68%
View Original
post-image
  • Reward
  • Comment
  • Repost
  • Share
Self-esteem is the most expensive luxury in trading. The market specializes in treating all forms of disobedience. #ETH反弹在即?
ETH-4.68%
View Original
post-image
  • Reward
  • Comment
  • Repost
  • Share
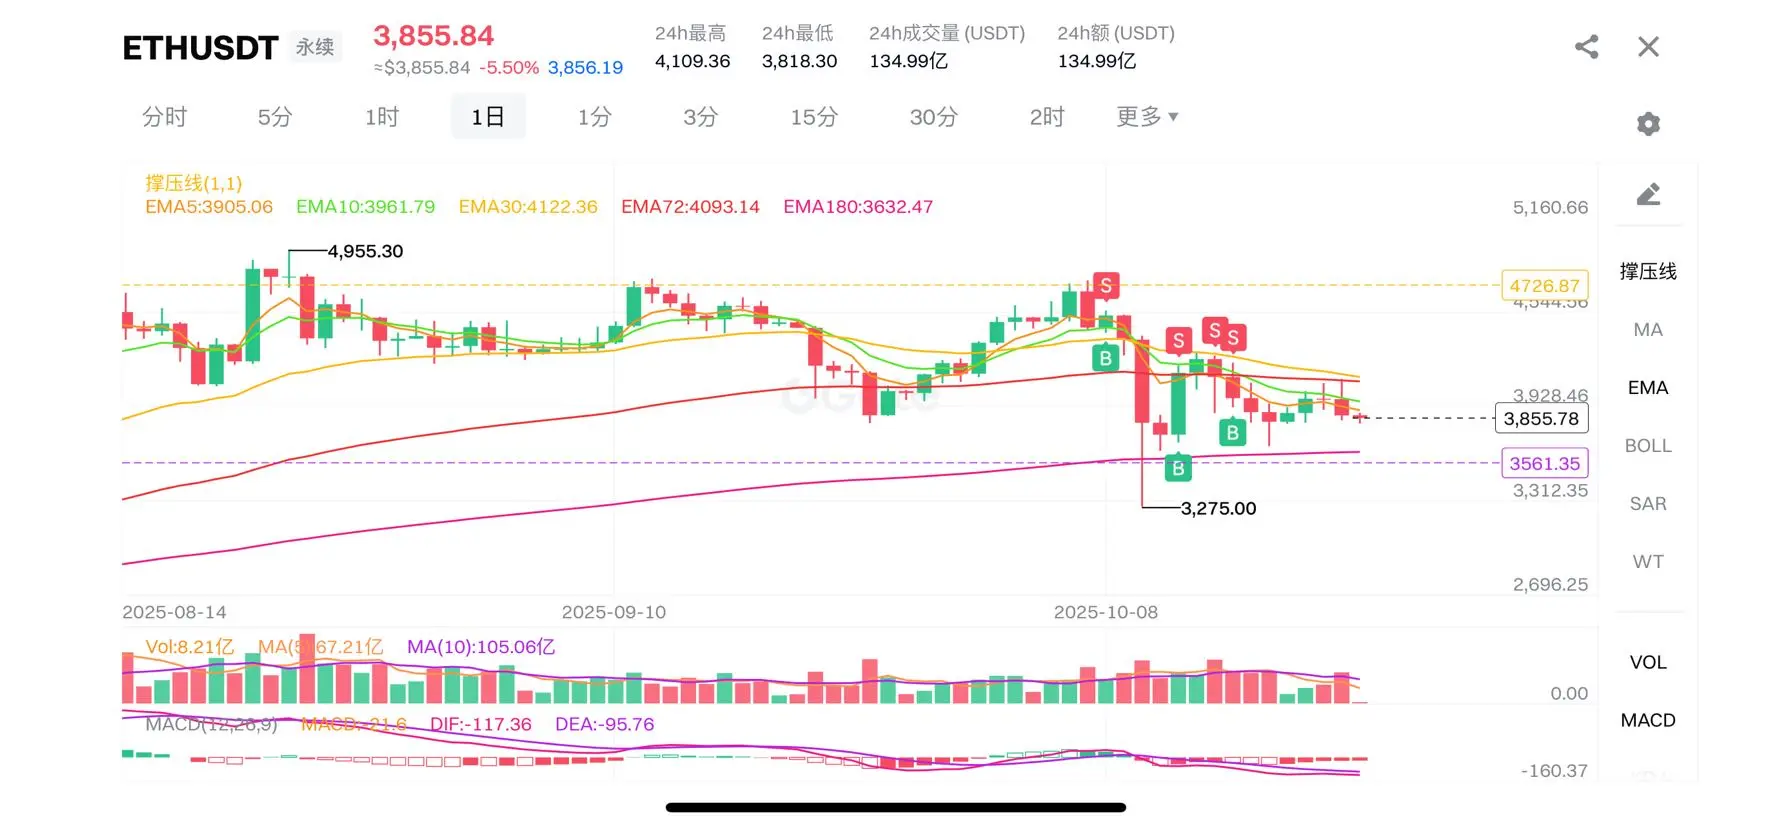
ETH October 22 Market Analysis
1. Trend Analysis
· Strengthening of the bearish pattern: The price has fallen below all medium and short-term EMAs, showing a complete bearish arrangement.
· Crash confirmed: A single-day drop of 5.5%, quickly falling from a high of 4,109 to 3,855.
· Key support test: Testing the key support at 3,818.30 (24-hour low)
· Only defense line: only EMA180(3,632.47) still provides long-term support.
2. MACD Indicator Analysis
· Strong bearish momentum:
· DIF(-17.36) < DEA(-95.76), MACD histogram is negative (-11.6)
· Although the gap between DIF and DEA has narrowe
ETH-4.68%
View Original
post-image
  • Reward
  • Comment
  • Repost
  • Share
Taking chances is the fastest shortcut to Get Liquidated. #ETH反弹在即?
ETH-4.68%
View Original
post-image
  • Reward
  • Comment
  • Repost
  • Share
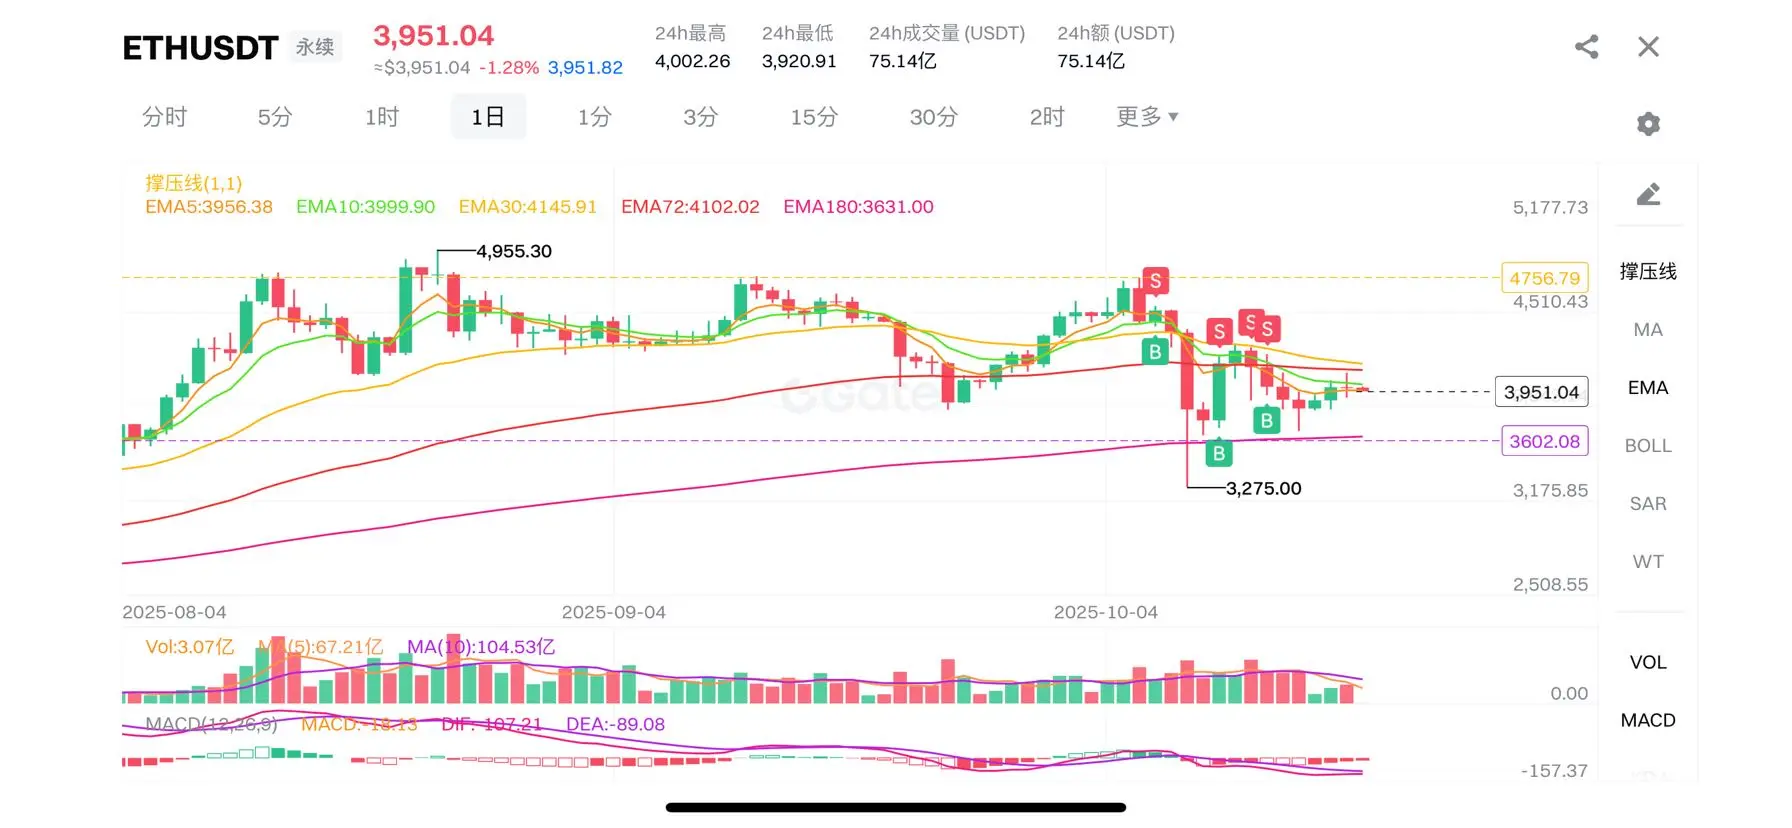
ETH October 21 Market Analysis
1. Trend Analysis
· The bearish pattern remains: the price is below key moving averages such as EMA10, EMA20, and EMA72.
· Short-term support test: The current price is slightly above EMA5(3,936.38), testing this short-term support.
· Key Position: The price is oscillating in the range of 3,920-3,950, at a critical point for choosing a direction.
· Long-term support: EMA180(3,831.00) is still an important long-term support.
2. MACD Indicator Analysis - Important Trend Reversal Signals
· Golden cross initially formed: MACD turned positive (+0.43), DIF(+0.42) has c
ETH-4.68%
View Original
post-image
  • Reward
  • 1
  • Repost
  • Share
BankOfChinaReviewvip:
Just go for it💪
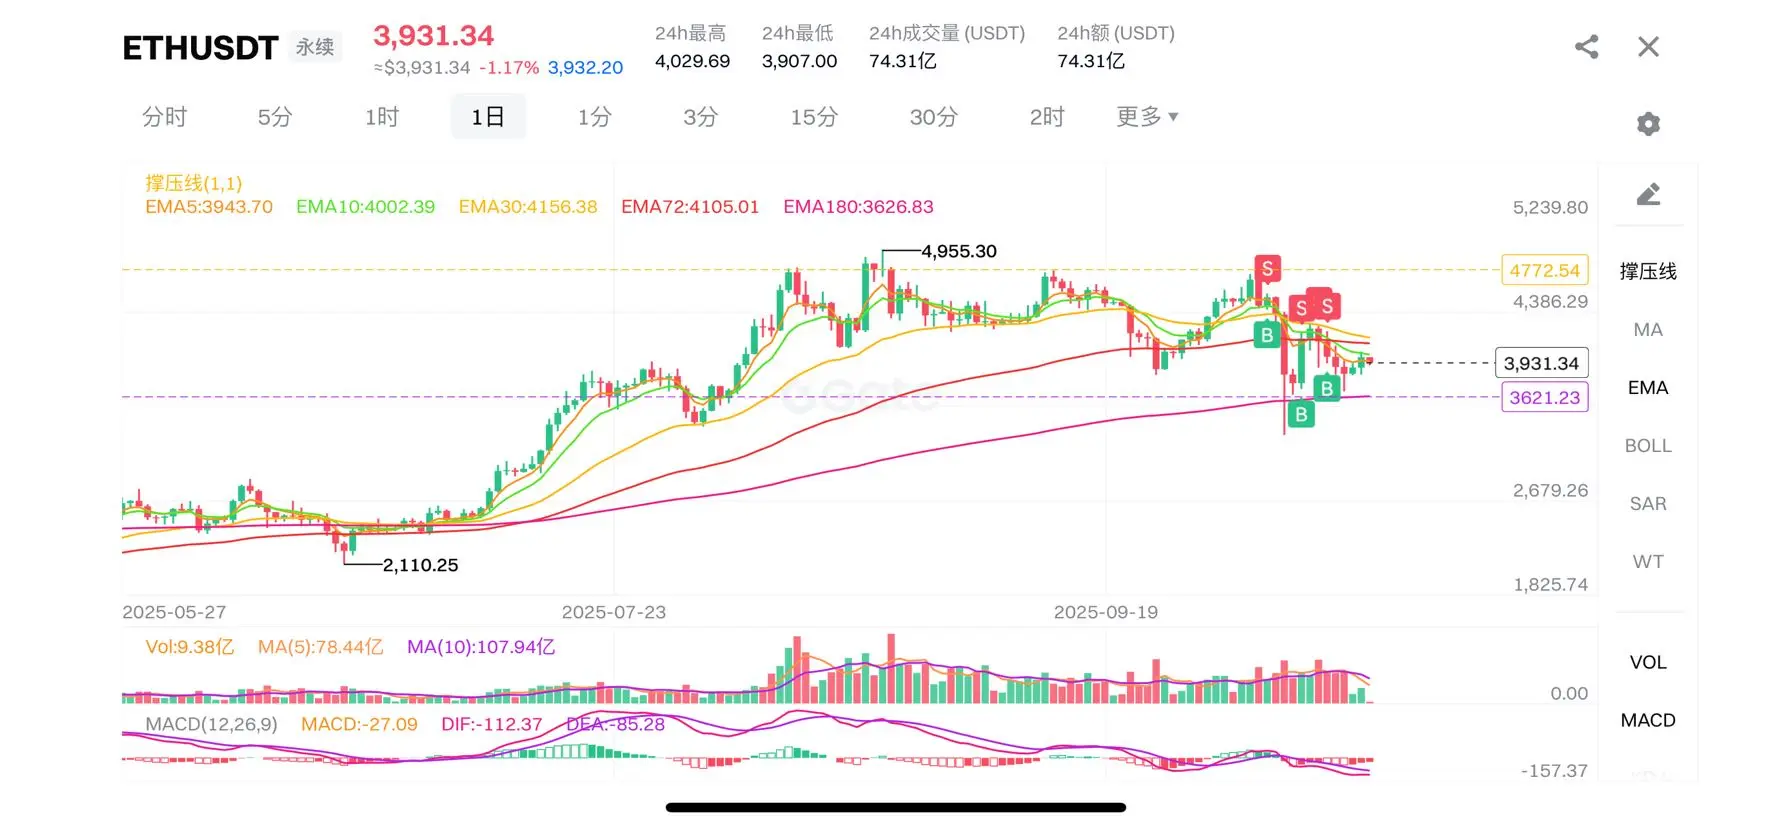
ETH Market Analysis on October 20
1. Trend Analysis
· Bearish pattern confirmed: Price is below all short- to medium-term EMAs (EMA5, EMA10, EMA20, EMA72)
· Key position contest: The current price of 3,931.34 is almost overlapping with the EMA5 of 3,934.70, testing this short-term resistance.
· Deep correction status: Down from the peak of 4,772.54 to the current price level, a decline of over 17%.
· Unique Support: Only EMA180(3,626.83) still provides long-term support
2. MACD Indicator Analysis
· Strong bearish signal:
· DIF(-112.37) < DEA(-85.28), MACD histogram is negative (-27.09)
· T
ETH-4.68%
View Original
post-image
  • Reward
  • Comment
  • Repost
  • Share
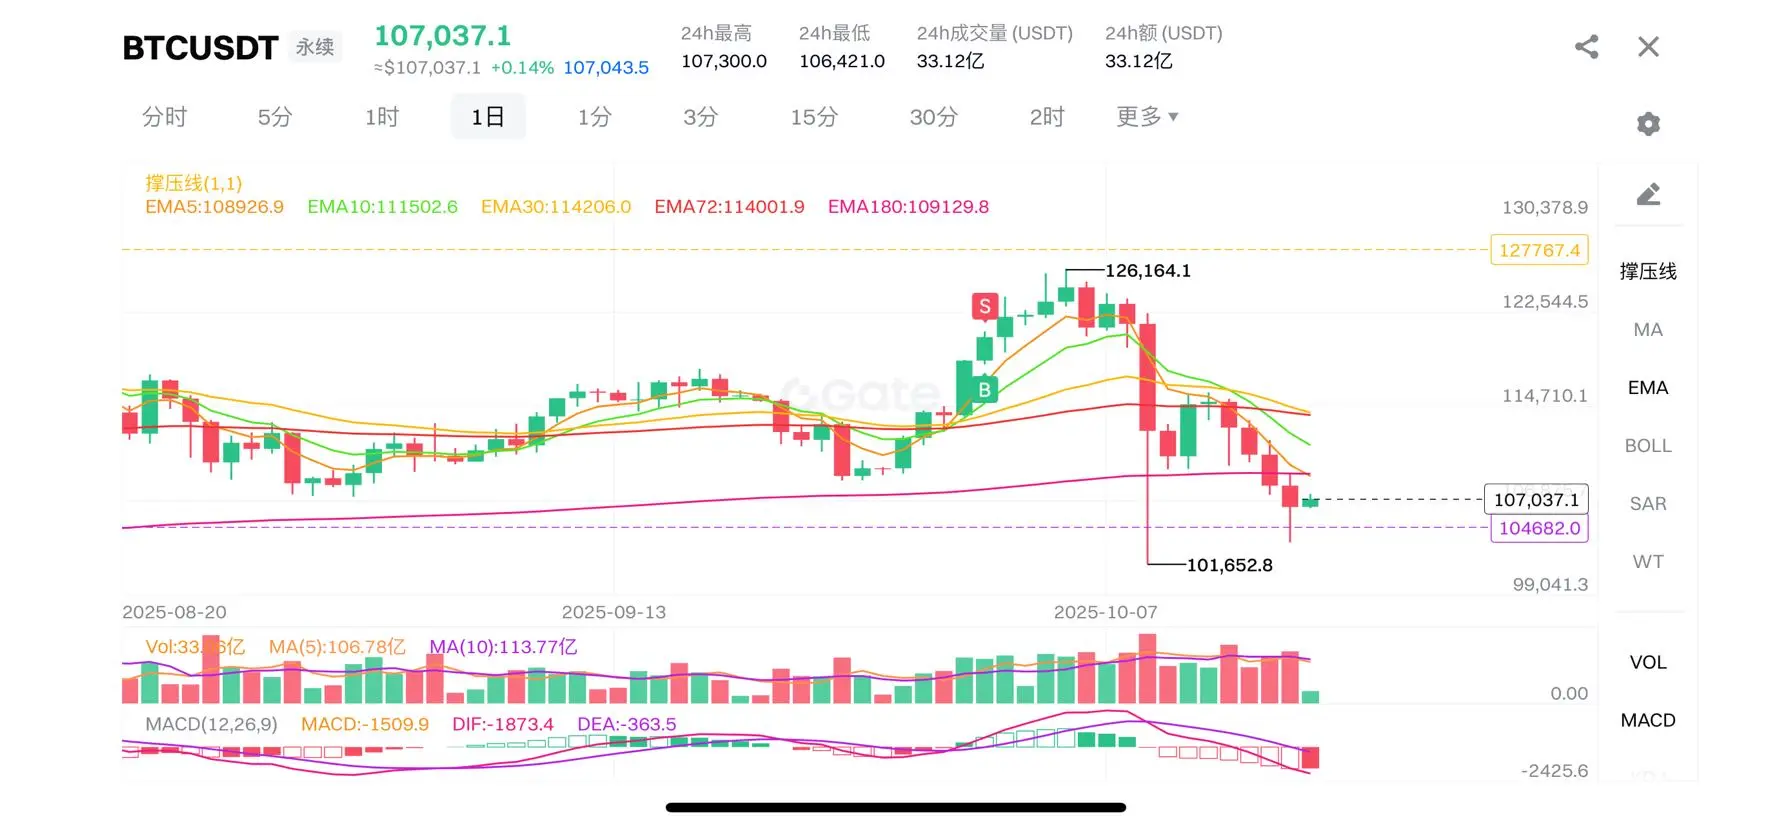
BTC Market Analysis on October 19
1. Trend Analysis
· Clear bearish pattern: Price is below all EMAs, showing a complete bearish alignment.
· Deep correction status: dropped from the high of 132,574.5 to the current 107,037.1, a decline of about 19%
· Key Position: The price is testing the support near 107,000, but the overall trend remains bearish.
2. MACD Indicator Analysis
· Strong bearish signal:
· MACD value -1508.9 shows strong bearish momentum
· DIF(-1873.4) is significantly lower than DEA(-363.5), with a huge difference.
· This is a typical signal of accelerated downtrend.
3. Vo
BTC-3.51%
View Original
post-image
  • Reward
  • Comment
  • Repost
  • Share
  • Trending TopicsView More
  • Pin
Trade Crypto Anywhere Anytime
qrCode
Scan to download Gate App
Community
English
  • 简体中文
  • English
  • Tiếng Việt
  • 繁體中文
  • Español
  • Русский
  • Français (Afrique)
  • Português (Portugal)
  • Bahasa Indonesia
  • 日本語
  • بالعربية
  • Українська
  • Português (Brasil)