Trade
Basic
Futures
Futures
Hundreds of contracts settled in USDT or BTC
TradFi
Gold
Trade global traditional assets with USDT in one place
Options
Hot
Trade European-style vanilla options
Unified Account
Maximize your capital efficiency
Demo Trading
Futures Kickoff
Get prepared for your futures trading
Futures Events
Participate in events to win generous rewards
Demo Trading
Use virtual funds to experience risk-free trading
Earn
Launch
CandyDrop
Collect candies to earn airdrops
Launchpool
Quick staking, earn potential new tokens
HODLer Airdrop
Hold GT and get massive airdrops for free
Launchpad
Be early to the next big token project
Alpha Points
New
Trade on-chain assets and enjoy airdrop rewards!
Futures Points
New
Earn futures points and claim airdrop rewards
Investment
Simple Earn
Earn interests with idle tokens
Auto-Invest
Auto-invest on a regular basis
Dual Investment
Buy low and sell high to take profits from price fluctuations
Soft Staking
Earn rewards with flexible staking
Crypto Loan
0 Fees
Pledge one crypto to borrow another
Lending Center
One-stop lending hub
VIP Wealth Hub
Customized wealth management empowers your assets growth
Private Wealth Management
Customized asset management to grow your digital assets
Quant Fund
Top asset management team helps you profit without hassle
Staking
Stake cryptos to earn in PoS products
Smart Leverage
New
No forced liquidation before maturity, worry-free leveraged gains
GUSD Minting
Use USDT/USDC to mint GUSD for treasury-level yields
More
Yusfirah
#MiddleEastTensionsEscalate
Geopolitical tensions between the U.S. and Iran are intensifying, sending shockwaves across global markets. Gold has now surged above the $5,000 milestone, reflecting a classic risk-off environment where investors flock to safe-haven assets. This is not just a temporary spike; the underlying factors potential energy supply disruptions, sanctions, and uncertainty in international trade are likely to sustain elevated gold prices in the near term. Traders should note that gold’s behavior in such periods often extends beyond immediate geopolitical news, driven by both
Geopolitical tensions between the U.S. and Iran are intensifying, sending shockwaves across global markets. Gold has now surged above the $5,000 milestone, reflecting a classic risk-off environment where investors flock to safe-haven assets. This is not just a temporary spike; the underlying factors potential energy supply disruptions, sanctions, and uncertainty in international trade are likely to sustain elevated gold prices in the near term. Traders should note that gold’s behavior in such periods often extends beyond immediate geopolitical news, driven by both
BTC-6,16%

- Reward
- 3
- 2
- Repost
- Share
repanzal :
:
Buy To Earn 💎View More
$HBAR is holding strong at the support zone and consolidating well. Buyers are stepping in and the chart is forming higher lows — a clear sign of momentum building • RSI showing recovery • Volume slowly increasing • A strong break and close above nearby resistance could trigger a sharp upside move
HBAR-5,57%
- Reward
- like
- Comment
- Repost
- Share
#CryptoRegulationNewProgress
The global cryptocurrency landscape continues to evolve, with regulators and industry stakeholders working closely to establish clearer frameworks for digital assets. #CryptoRegulationNewProgress reflects the latest updates, highlighting developments that aim to foster transparency, investor protection, and sustainable growth in the crypto ecosystem.
Key Updates and Insights:
Stronger Regulatory Frameworks: Governments and financial authorities are introducing updated regulations to ensure digital asset markets operate securely and transparently. These measures ai
DEFI-5,86%

- Reward
- 3
- 1
- Repost
- Share
HighAmbition:
1000x VIbes 🤑石油币
石油币
Created By@交易员668
Subscription Progress
0.00%
MC:
$0
Create My Token
Core Takeaway
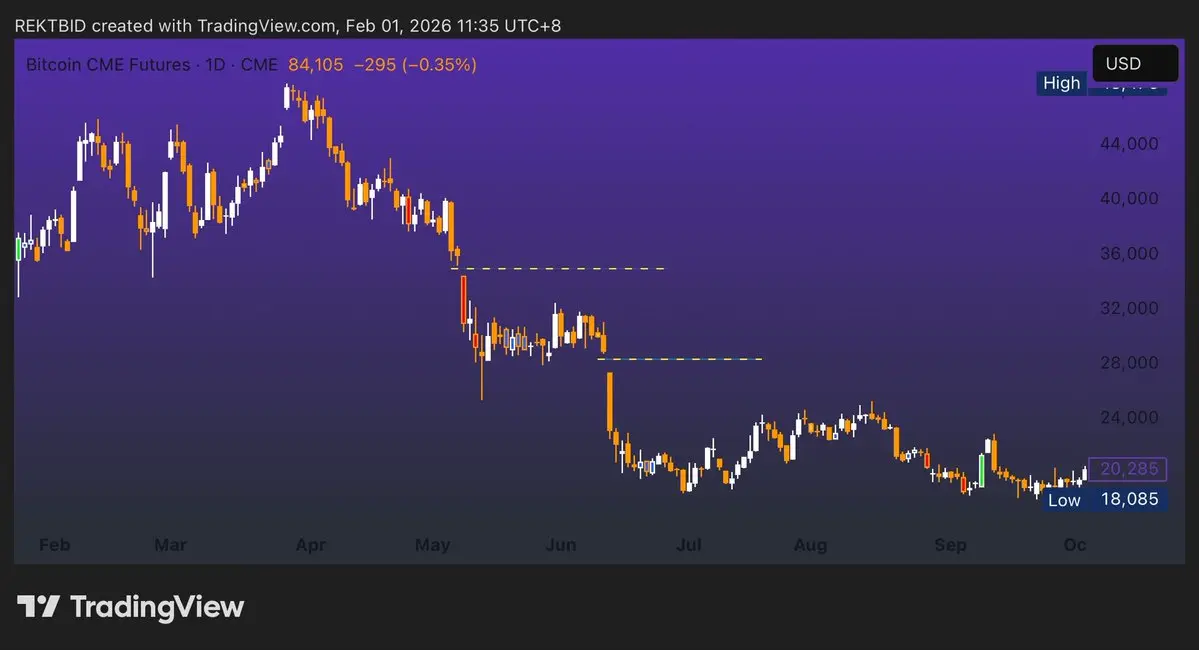
BTC has been under significant pressure lately, showing a clear downward trend with signs of heavy selling and extremely bearish sentiment. Technical signals are flashing "oversold," hinting a rebound may be near—but caution is key as trend strength is still negative.
Key Data
- Latest price: $82,652.80 (quoted in USDT for the BTC_USDT pair)
- 24h change: -0.32%
- 24h high/low: $84,631.50 / $81,881.20
- Fear & Greed Index: Extreme Fear (score: 20)
- Technicals: RSI deeply oversold on multiple timeframes (as low as 12.3), MA lines in bearish alignment, price pressing on short-term
BTC-6,16%

- Reward
- 2
- 1
- Repost
- Share
HeavenSlayerSupporter :
:
2026 Go Go Go 👊
- Reward
- like
- 2
- Repost
- Share
TakeOffIn2026 :
:
Predict again. Do you think the price will rise or fall in the next few days?View More
A live stream where people are grabbing Tencent Yuanbao red envelopes 🧧, and surprisingly, tens of thousands of viewers are watching
View Original
- Reward
- like
- Comment
- Repost
- Share
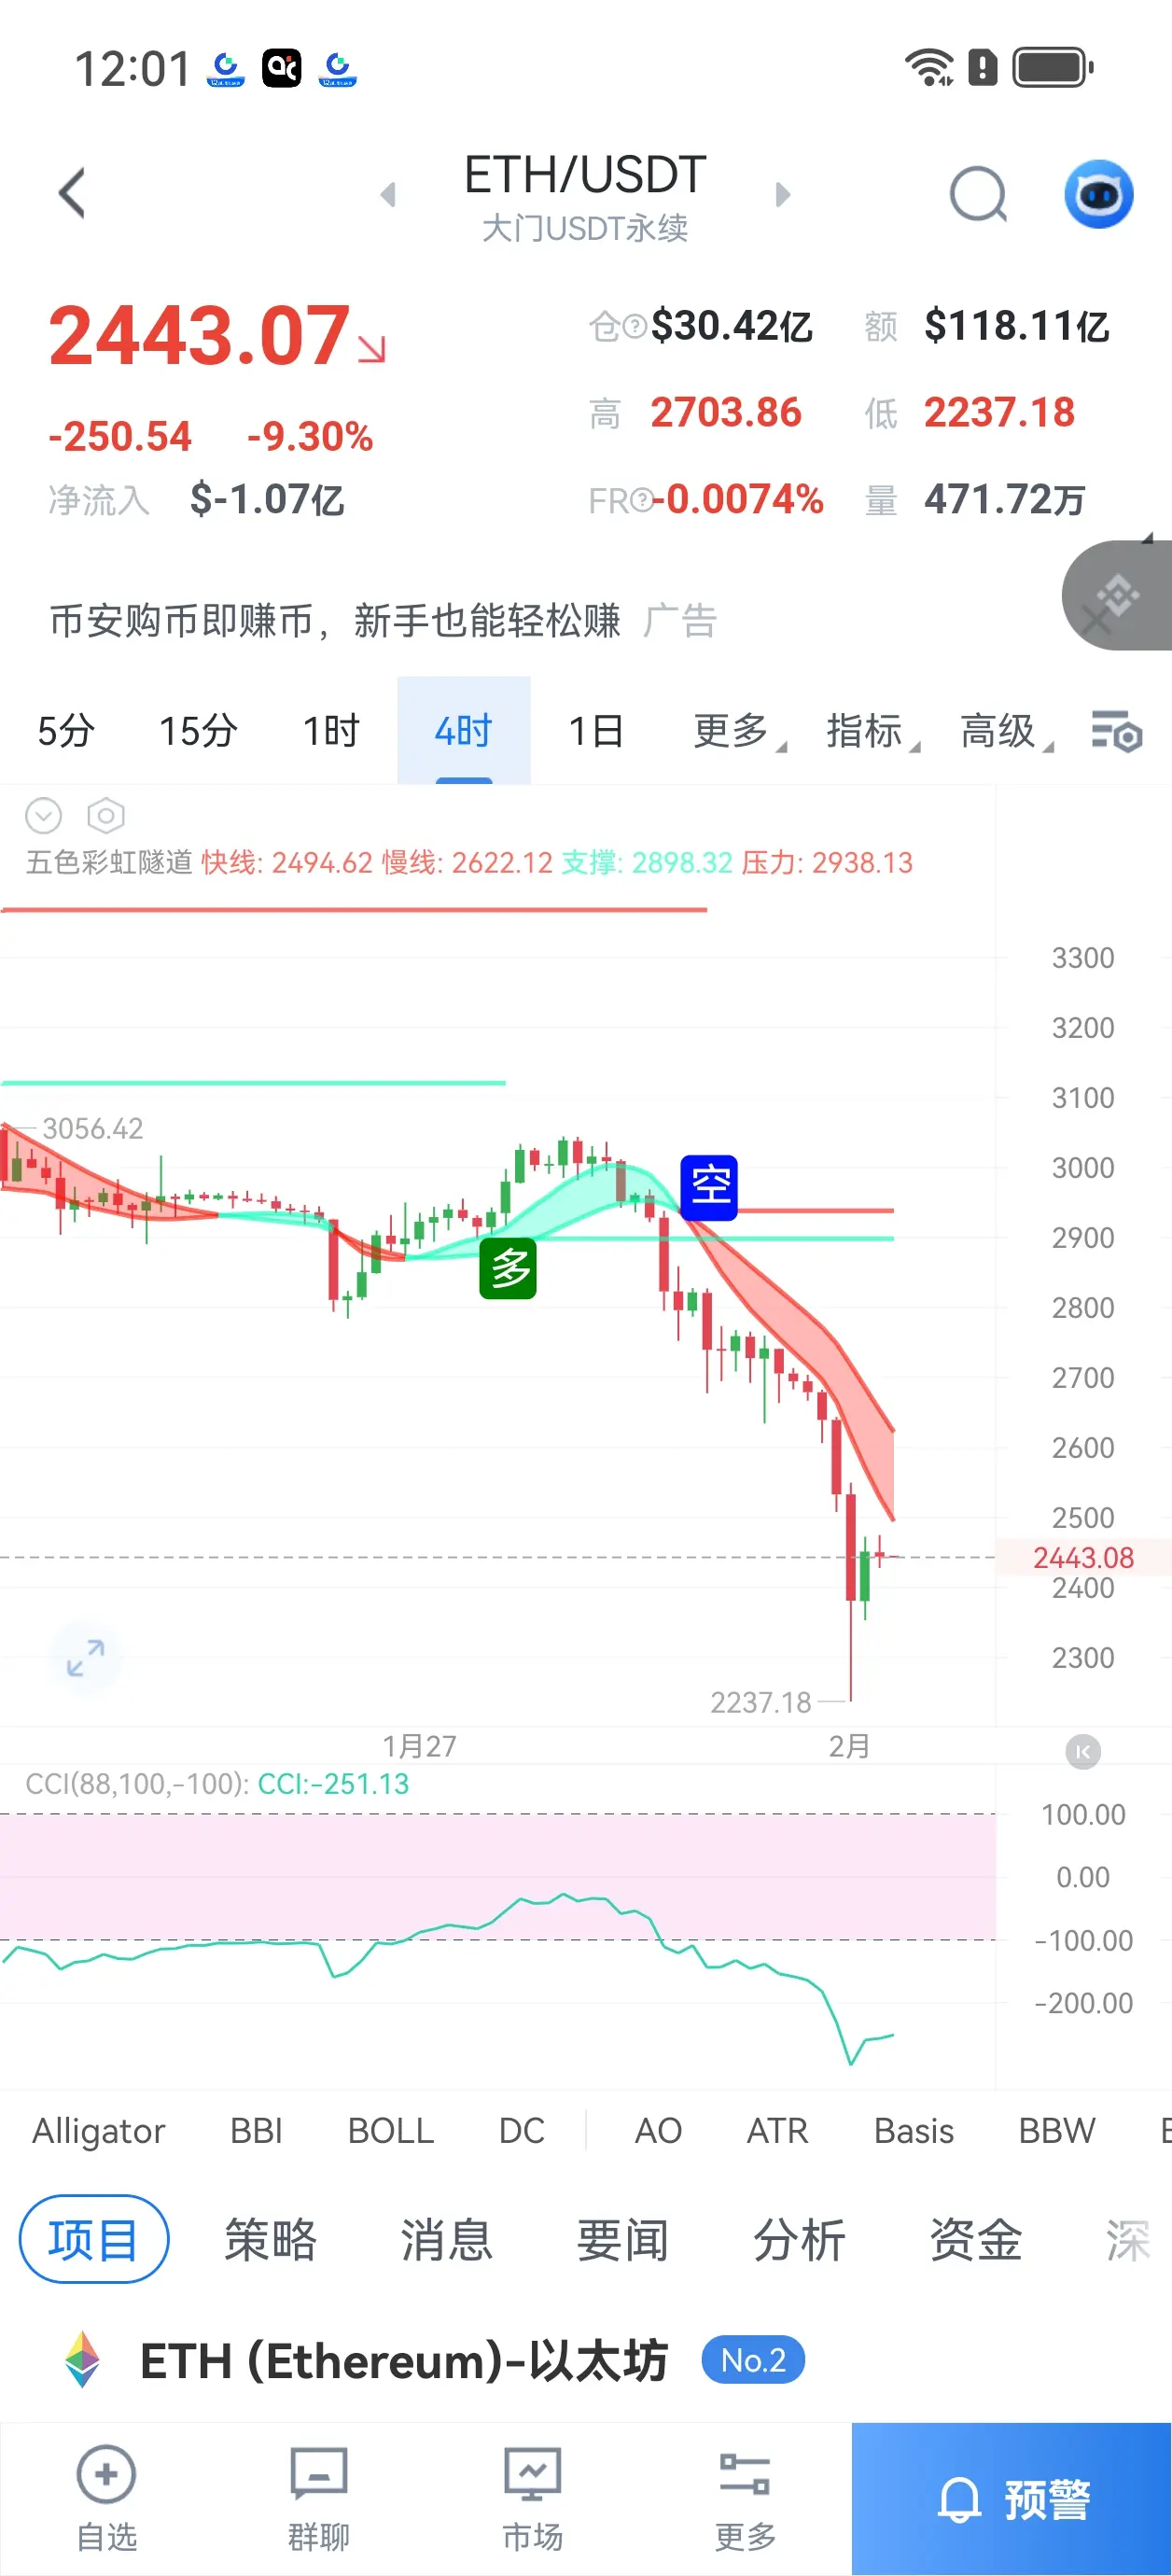
$BTC $ETH Price Trend Analysis
1. Candlestick Patterns:
- In the last 4-hour period, the price has been continuously falling from a high level, forming consecutive bearish candles, indicating a short-term weak downward trend.
- On the daily chart, after a recent sharp decline, there has been slight consolidation, and the current candlestick is a small bearish candle.
2. Technical Indicators:
- MACD: In the 4-hour cycle, both DIF and DEA are below the zero line, and the MACD histogram's negative value is expanding, indicating strong bearish momentum.
- RSI: The 4-hour RSI is around 23
View Original1. Candlestick Patterns:
- In the last 4-hour period, the price has been continuously falling from a high level, forming consecutive bearish candles, indicating a short-term weak downward trend.
- On the daily chart, after a recent sharp decline, there has been slight consolidation, and the current candlestick is a small bearish candle.
2. Technical Indicators:
- MACD: In the 4-hour cycle, both DIF and DEA are below the zero line, and the MACD histogram's negative value is expanding, indicating strong bearish momentum.
- RSI: The 4-hour RSI is around 23
- Reward
- like
- Comment
- Repost
- Share
- Reward
- like
- Comment
- Repost
- Share
This market wants your soul.Don\'t give it to them
- Reward
- like
- Comment
- Repost
- Share
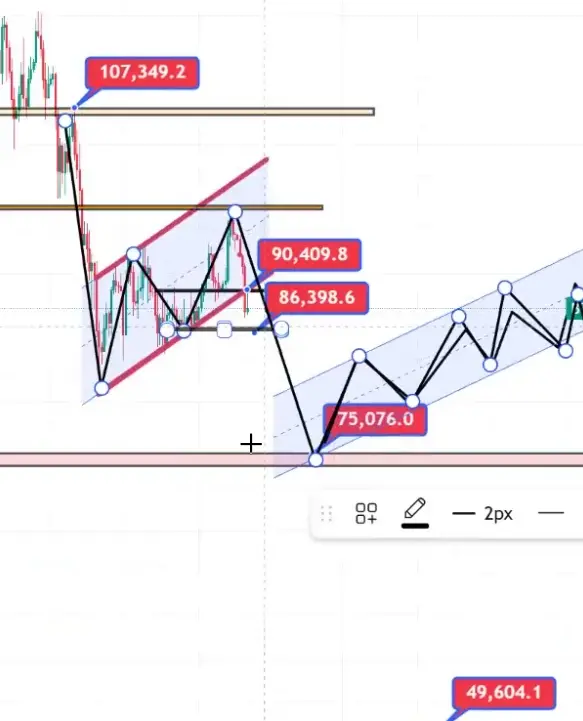
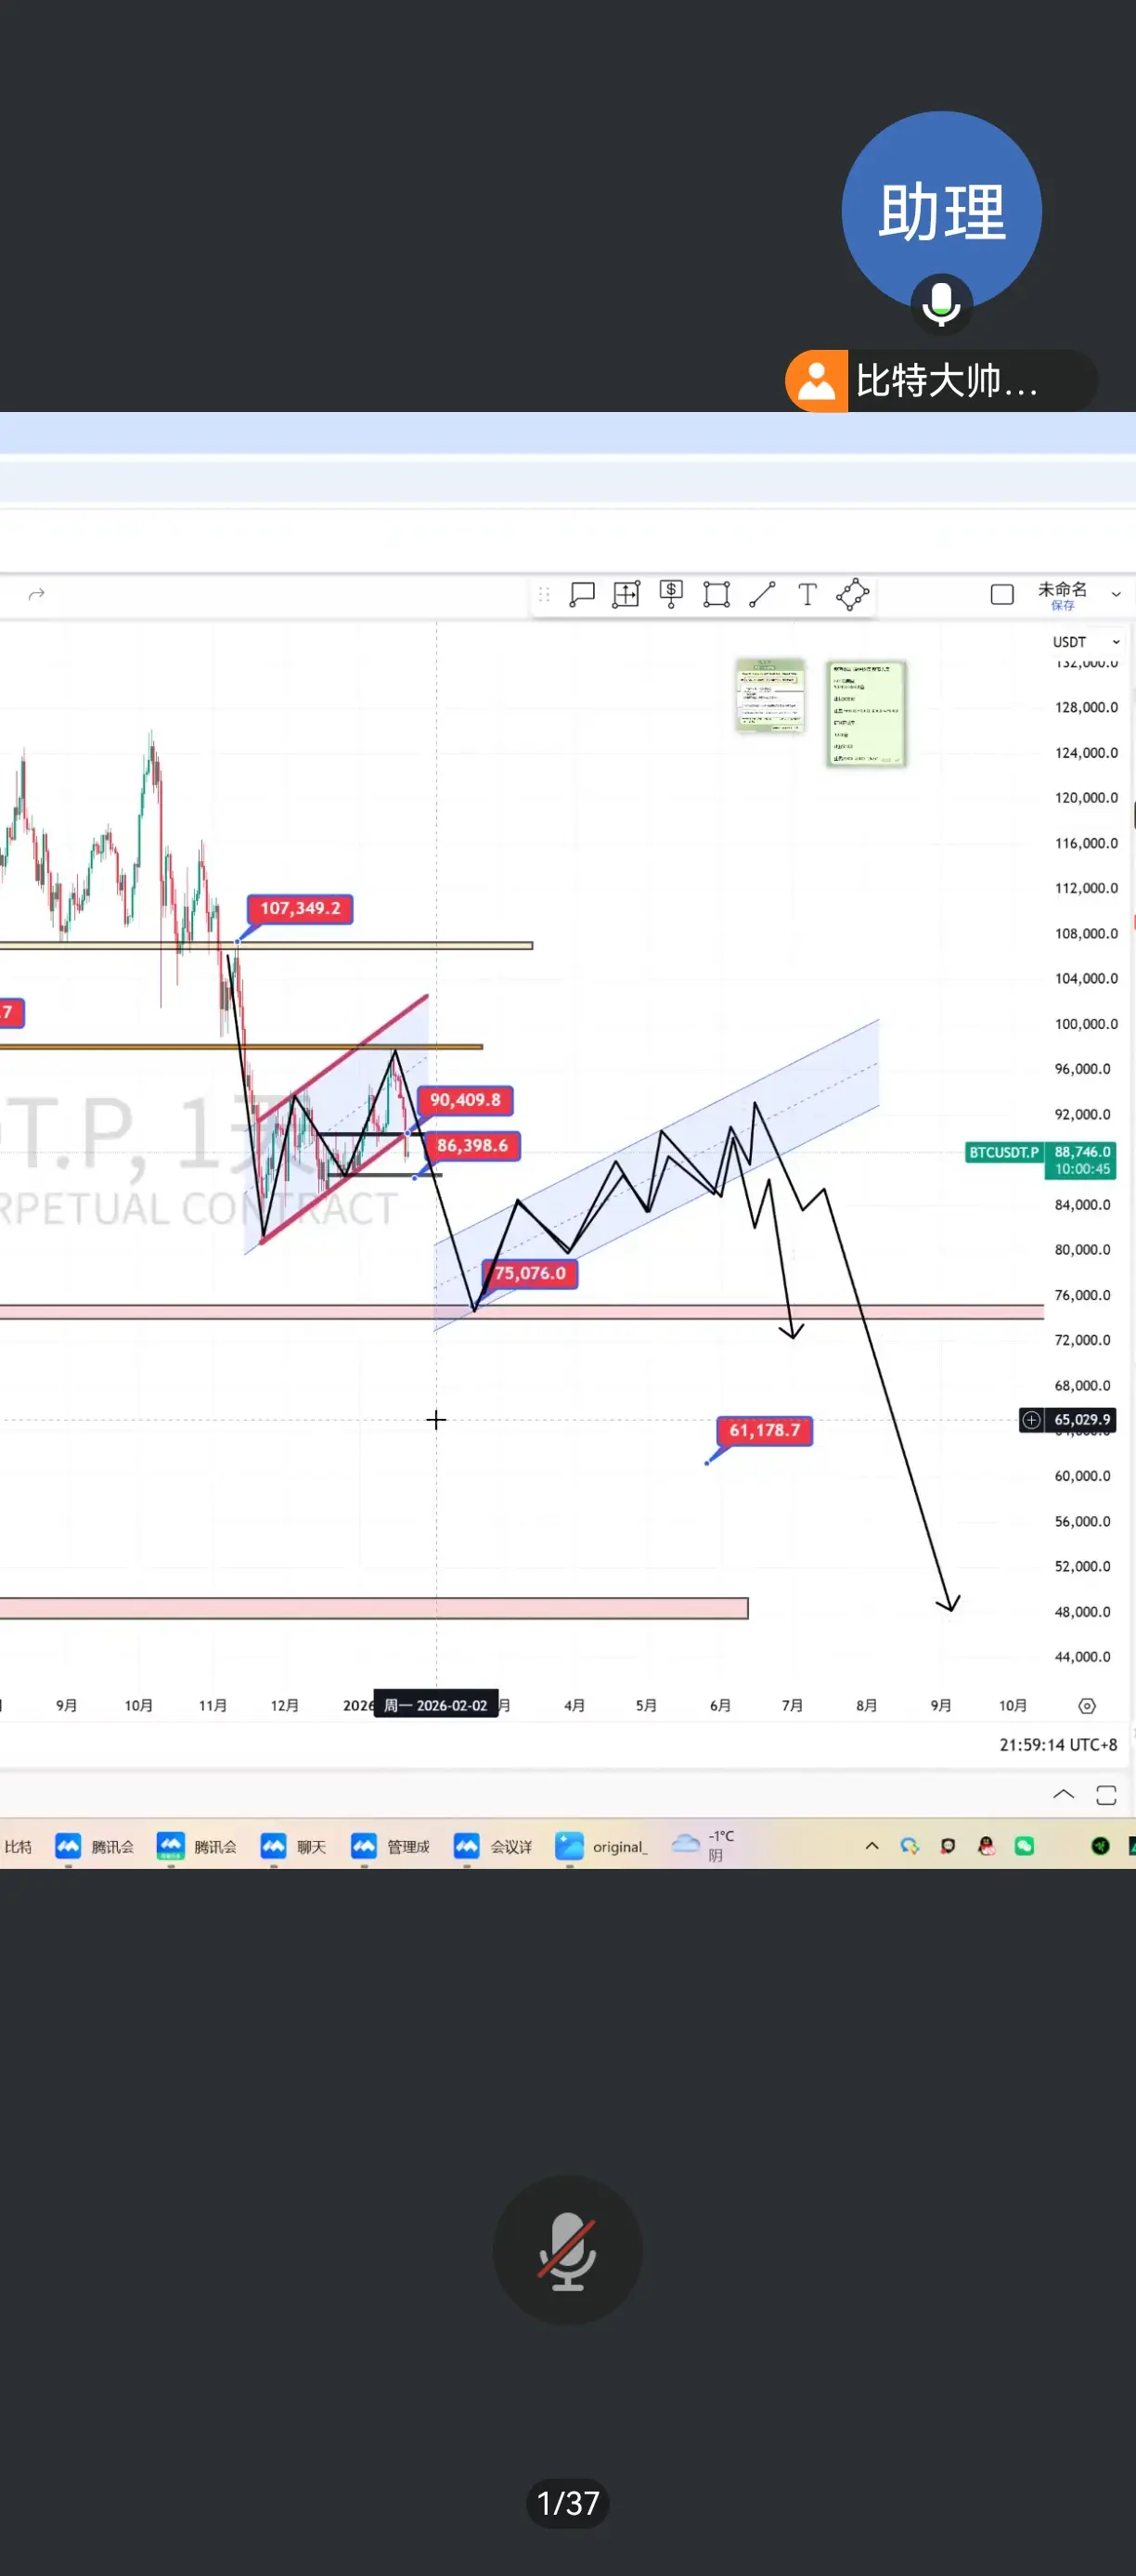
‼️ Guan Peace Wheel Brothers, give U‼️ Contract No. 1 / Spot Order has been updated 👇 In the crypto world, only follow the right people. Thank you all for your support. The New Year 3.8 GT half-price promotion has exceeded 260 people, and tonight it will resume at 8 GT‼️ Apple click 👇
https://www.gate.com/zh/profile/ Chanlun Master
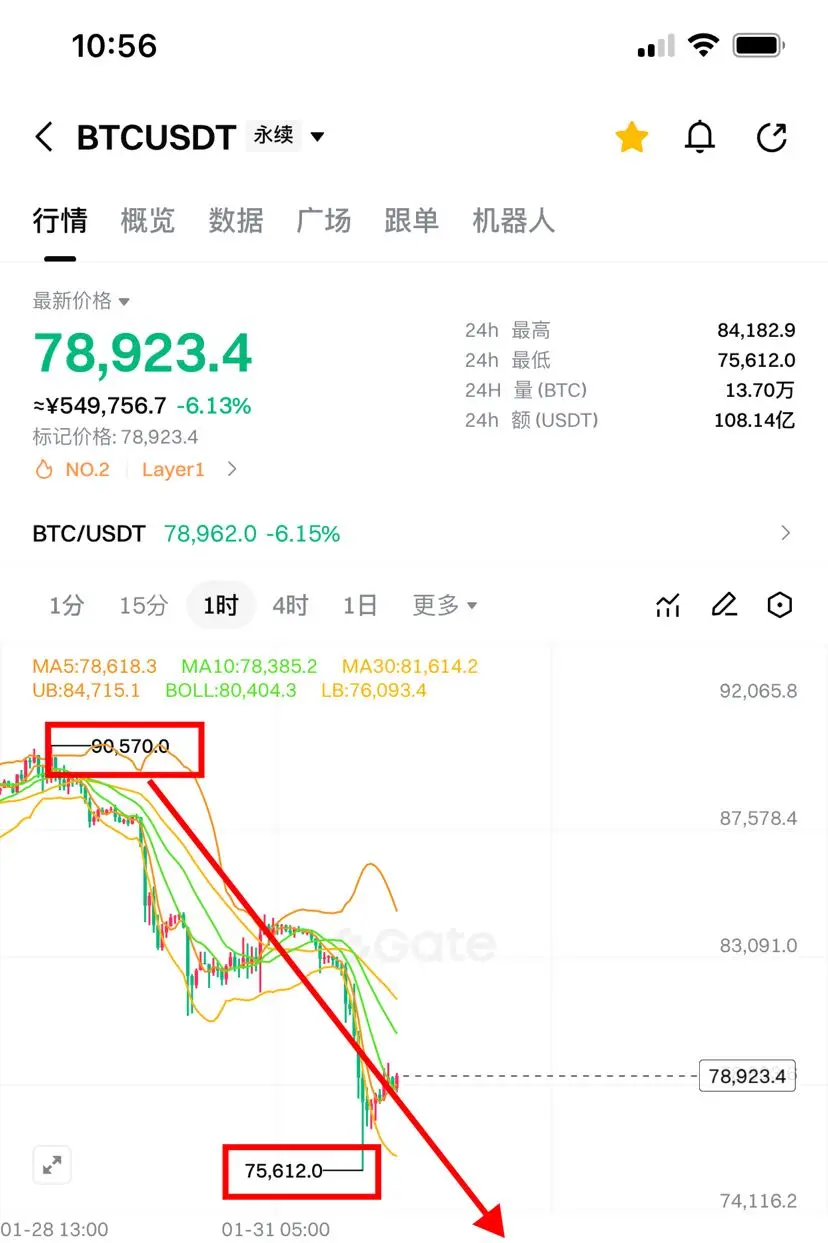
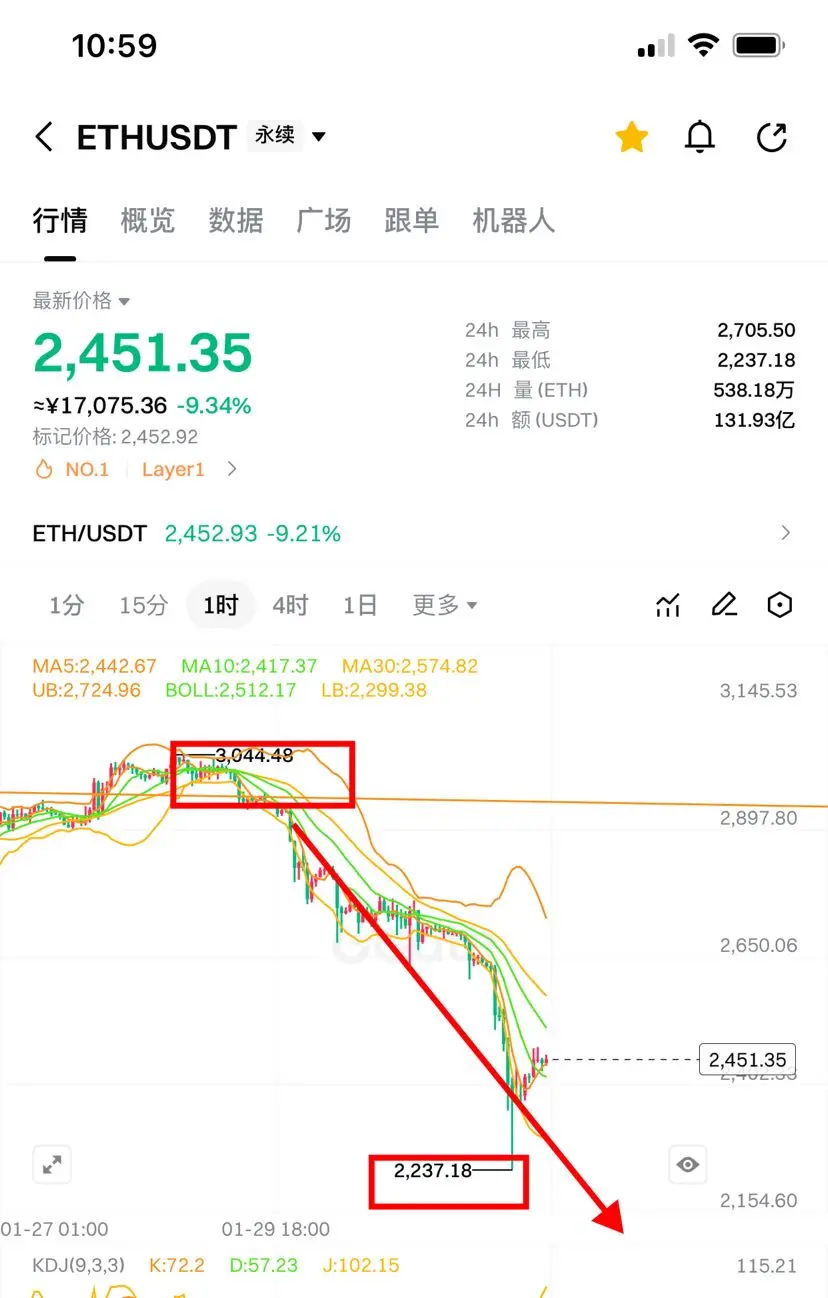
🔥 Recently, over 2 million U have been eaten in a row‼️ Last week, 3400/97800 short + 90800/3005 short, this Monday 86000/2785, earning another 300,000 📉 Wednesday reversed at 3045/90400 short + yesterday 84400 short, now 2235/75650, eating another 600,000 📉 Ea
View Originalhttps://www.gate.com/zh/profile/ Chanlun Master
🔥 Recently, over 2 million U have been eaten in a row‼️ Last week, 3400/97800 short + 90800/3005 short, this Monday 86000/2785, earning another 300,000 📉 Wednesday reversed at 3045/90400 short + yesterday 84400 short, now 2235/75650, eating another 600,000 📉 Ea

- Reward
- like
- Comment
- Repost
- Share
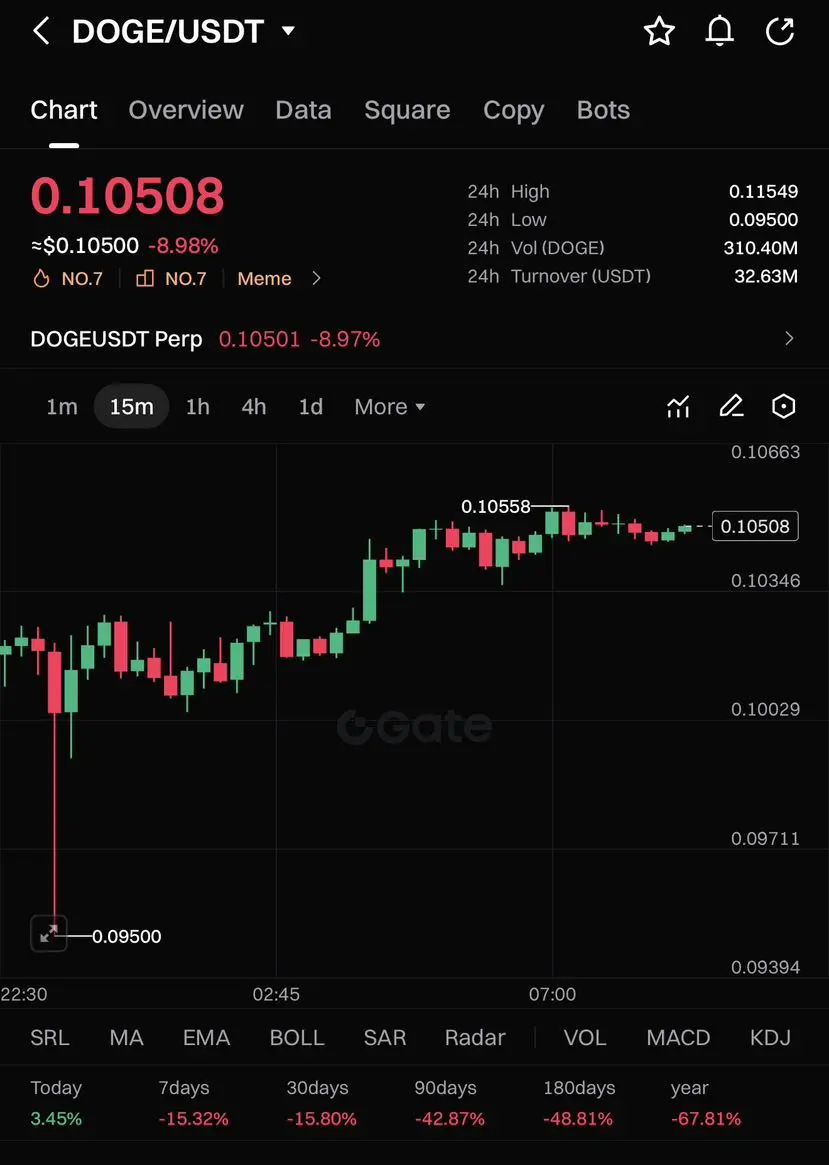
$DOGE showing stability after the sharp dip.
Structure holding local demand with buyers stepping in.
EP
0.1020 – 0.1055
TP
TP1 0.1080
TP2 0.1120
TP3 0.1180
SL
0.0950
Liquidity was swept below the recent low and price reacted quickly back into range. Consolidation above reclaimed support suggests absorption is complete and structure favors a push toward higher liquidity.
Let’s go $DOGE
DOGE-8,44%
- Reward
- 1
- 1
- Repost
- Share
Mr.LV:
😀😏😀😏😀😏😀😏😀😏😀😏😀😏😀😏😀😏😀😏😀😏😀😏😏😀ZAZA
ZAZA
Created By@椤琐厴嘘
Listing Progress
0.00%
MC:
$2.94K
Create My Token
Since March 2024, I started trading contracts in the crypto world and kept losing until the end of 2025. I used all the money from selling my house in 2023 to fund it. After two years, I lost a total of 1.5 million. I just couldn't accept it, so I borrowed from all online loans, credit loans, Huabei, and Jiebei. I managed to gather 300,000 and went all in. Finally, I turned things around!
View Original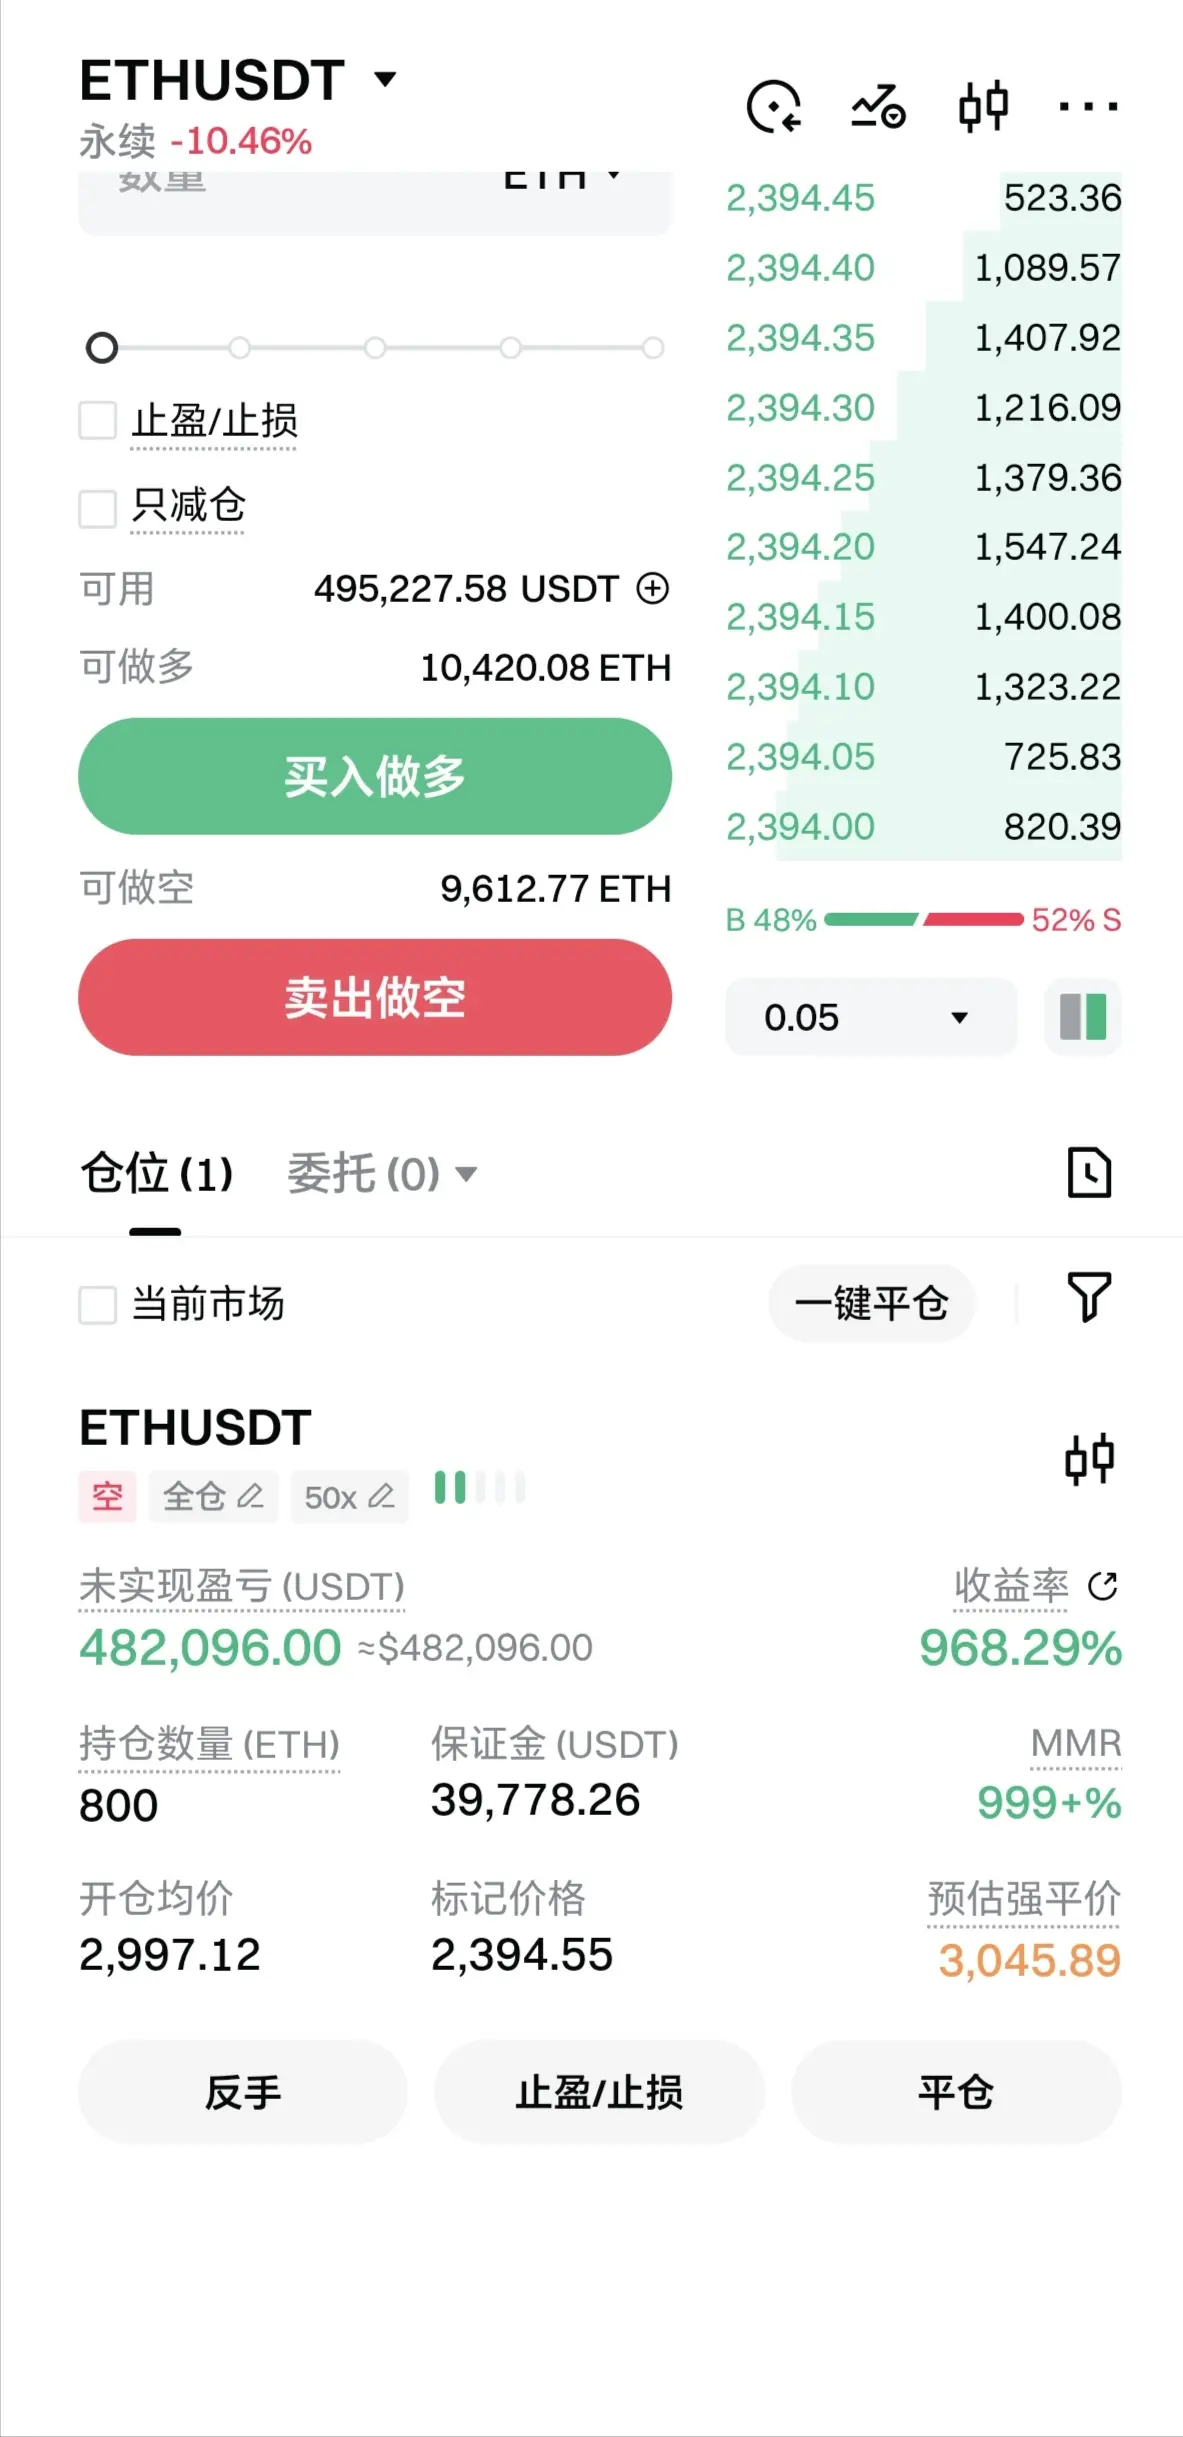

- Reward
- like
- 1
- Repost
- Share
IJustWantToBreakEven.:
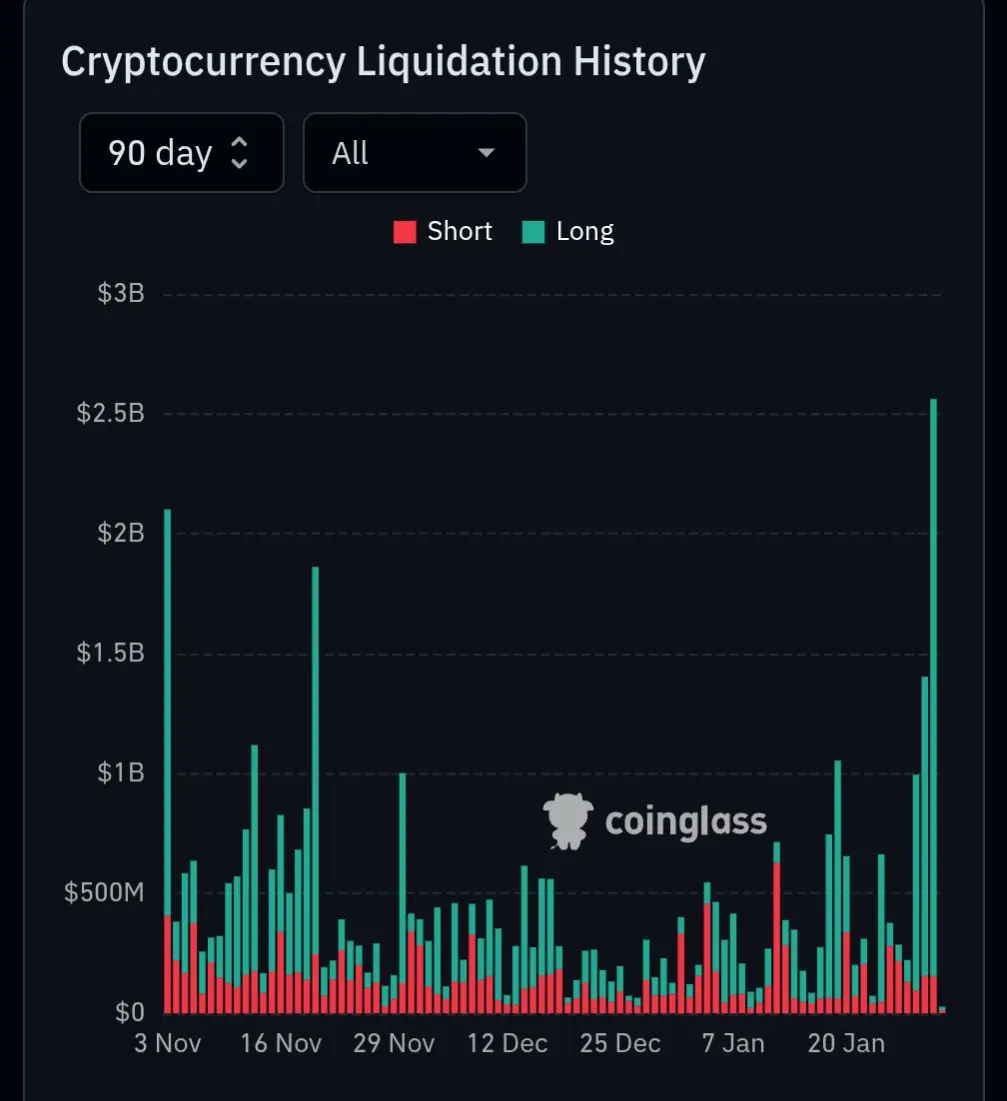
Congratulations on successfully reaching the shore!The shadow of the US government shutdown looms over the globe, and risk aversion sentiment is crashing into the markets like a flood!
Bitcoin failed to serve as digital gold and instead experienced an epic sell-off, instantly breaking through MicroStrategy's $78,000 cost basis!
In this massive震 (shock), 347,000 people saw their accounts wiped to zero, and the liquidation of $2.22 billion shattered investor confidence. Most惊人的是 (astonishingly), the AHR999 coin accumulation indicator, which symbolizes long-term opportunity,首次跌破 (broke below) 0.45抄底线 (the bottom-fishing line) after 839 days, as i
BTC-6,16%

- Reward
- like
- Comment
- Repost
- Share
Market crash and let see the important zone together
242
- Reward
- like
- Comment
- Repost
- Share
#CryptoMarketPullback
The crypto market is currently experiencing a pullback, and as usual, it feels dramatic on the charts. Red candles appear, timelines get louder, and suddenly everyone becomes either extremely cautious or extremely confident. This is a normal phase of the market cycle, not a surprise and not a failure of the trend by default.
From a serious perspective, pullbacks serve an important purpose. They help cool down overextended price action, reset funding rates, and remove weak hands from the market. Healthy markets do not move straight up. Corrections are part of price discov
- Reward
- 1
- 1
- Repost
- Share
HighAmbition:
Buy To Earn 💎#WLFI The big players have already run away. After Trump took this hit, this coin will go to zero. Bitcoin will reach 45,000, and all altcoins will go to zero. The Trump family has already made enough money. Still buying, damn it. I've been telling you since January 21 last month. You all didn't believe it. WiFi.0.02 If you don't believe it, just watch.
View Original
- Reward
- like
- Comment
- Repost
- Share
$75,000 Surprise Night: Bitcoin Faith Crisis or Deep Squat Jump?
What is the market experiencing as "digital gold" falls below institutional cost lines?
In the early hours of February 1st, the cryptocurrency market experienced a textbook-level liquidity crisis. Bitcoin's price suddenly "spiked" down to $75,719.9, a figure like a sharp surgical knife precisely cutting through the market's most vulnerable nerves—this is the first time since November 2024 that it has fallen below the $80,000 mark, and nearly a year since Bitcoin's "7" prefix reappeared.
What’s even more chilling for the market is
BTC-6,16%

- Reward
- 3
- 1
- Repost
- Share
邢大运:
I placed a large long position at the current price of 7.6. It dropped so sharply and changed to 7.3. Did I miss a good opportunity to buy the dip?Are you under 5M impressions? Be a reply guyThank me later

- Reward
- like
- Comment
- Repost
- Share
Load More
Join 40M users in our growing community
⚡️ Join 40M users in the crypto craze discussion
💬 Engage with your favorite top creators
👍 See what interests you
Trending Topics
View More21.56K Popularity
60.81K Popularity
366.12K Popularity
44.55K Popularity
60.7K Popularity
Hot Gate Fun
View More- MC:$2.93KHolders:10.00%
- MC:$2.92KHolders:10.00%
- MC:$2.93KHolders:10.00%
- MC:$2.93KHolders:10.00%
- MC:$2.94KHolders:10.00%
News
View MoreThe market still expects the Federal Reserve to cut interest rates twice in 2026, and Wash's nomination has limited impact.
15 m
Sanae Takashi clarifies weak yen remarks, stating the focus is on strengthening economic resilience
21 m
Billionaire Grant Cardone increases BTC holdings at the $76,000 price point
52 m
A certain whale closed its long position in $LIT completely after 34 days, incurring a loss of $3.7 million.
1 h
CZ: The global situation is tense, making it the best time to promote cryptocurrencies.
1 h
Pin