#CryptoMarketBouncesBack
🚨 Gate Square 1. Overall Market Trend & Macro Context
The crypto market is experiencing a powerful, broad-based rally, erasing most of the recent fear-induced drawdowns. The total market cap now hovers around $2.46T–$2.53T, up 5–7% in the past 24 hours, while 24h trading volume has exploded to $150–$160B (+30–37%).
Macro Drivers:
Institutional flows: Spot BTC and ETH ETFs are resuming inflows (hundreds of millions daily), signaling structural demand.
Whale activity: Large holders (100–10k+ BTC) continue accumulation; long-term holder supply rising.
Technical breakout: Weak hands and leveraged shorts flushed, momentum accelerating.
Macro tailwinds: DXY softening, equities stable, gold steady, soft-landing narrative intact.
Geopolitical relief: Less tension in global hotspots → improved risk appetite.
Sentiment Shifts:
Crypto Fear & Greed Index jumped from extreme fear (~19–22) to neutral/greed (~45–55).
Social chatter on X, Telegram, and Gate Square dominated by “buy-the-dip reversal,” “BTC breakout,” and “ETH reclaiming $2,100.”
Altcoins rotation increasing; mid- and small-cap tokens seeing inflows → healthy broad participation.
2. Bitcoin (BTC) – Full Technical + On-Chain + Flow Analysis
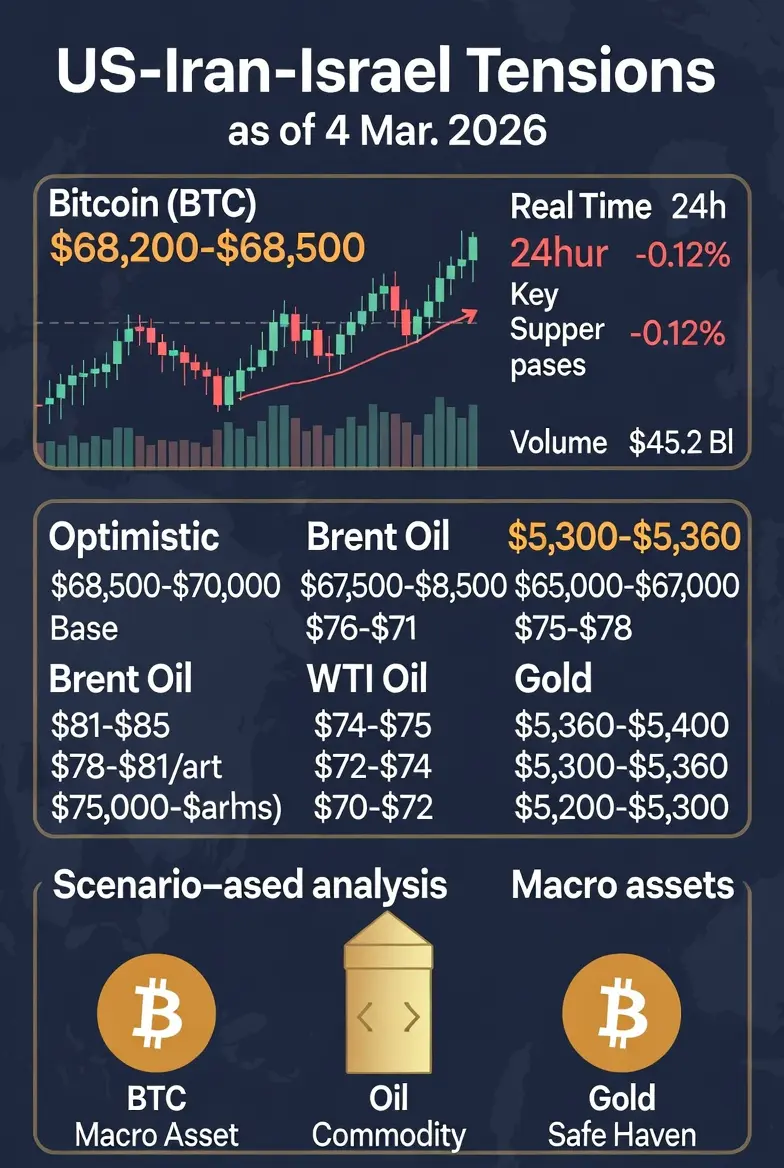
Live Price: ~$72,745–$73,700 (+6.5–7.5% 24h)
Immediate Resistance: $73,500–$74,000 (previous swing highs + Fibonacci 0.618–0.786)
Support: $71,500–$71,000 (high-volume node + EMAs 50/100h)
Macro Floor: $69,800–$70,000 (200-day EMA + weekly pivot)
Bear Trap Zone: $67,500–$68,000 → accumulation likely
Technical Indicators:
RSI (14, 4H/Daily): 68–72 → bullish momentum but near overbought → short-term 2–4% pullback possible
MACD: Strong bullish cross, histogram expanding → momentum continuation
Bollinger Bands: Price hugging upper band, volatility expansion → breakout continuation
Volume Profile: Heavy buy clusters $70k–$72k support floor
On-Chain & Flow Insights:
Whales adding aggressively, LTH supply increasing
Exchange outflows negative, coins moving to cold storage
Spot BTC ETF inflows: multi-hundred-million daily → structural accumulation
Funding rates: Positive but not extreme → short squeeze potential remains
Observation: BTC printed a fresh higher high above $72k, showing strong short-term bullish trend, but momentum needs confirmation via daily higher lows.
3. Ethereum (ETH) – Technical + Fundamental Analysis
Live Price: ~$2,124 (+7–8% 24h)
Resistance: $2,175–$2,200 (prior supply + Fib extension)
Immediate Support: $2,080–$2,050
Stronger Floor: $1,980–$2,000
Technical:
RSI (14, 4H): 65–70 → bullish, more room than BTC
MACD: Bullish crossover confirmed, building momentum
ETH/BTC ratio: ~0.029–0.0295 → ETH may outperform if BTC consolidates
Fundamentals Driving ETH:
L2 TVL & daily active users rebounding
DeFi activity increasing, staking participation high, validator count stable
Spot ETH ETF inflows positive (+$30–50M net/day)
BTC → ETH profit rotation visible in perp volume spikes
4. Altcoins & Sector Rotation
Layer-1s: SOL +8–10% ($80–$85 holding, breakout to $95–$100 possible), AVAX +7–9%, NEAR +7%
Exchange tokens: BNB +7–9% ($600+)
DeFi/L2: MATIC, ARB, OP +10–20%
Memes/high-beta: Intraday 20–50% swings
Observation: Capital is rotating from BTC/ETH profits → altcoins, confirming healthy risk-on sentiment. Mid-cap projects with utility are seeing outsized inflows. BTC dominance softening below 59% → altseason acceleration possible.
5. Trend Confirmation Checklist
To confirm new bullish trend:
Multiple higher highs/lows daily & weekly across BTC, ETH, major alts
Sustained volume >$130–150B for 4–7 days
BTC dominance softening as altcoins catch up
No macro/regulatory black swans (FOMC surprises, SEC, geopolitical flare)
Potential Price Path:
BTC: $75k–$78k
ETH: $2,300+
6. Positioning & Risk Management Strategy
Scalpers (1–4h): Ride intraday swings, tight stops 0.5–1% below support, target 1–3% moves, R:R ≥1:2.5
Swing / Mid-term (daily–weekly): Core longs above $71k/$2.05k, scale-in on dips, trail with 4H EMA
Risk Rules: ≤2–5% per position, leverage ≤10–15x, partial profit-taking 30–50%, cash buffer 20–30%
7. Tomorrow & Weekend Outlook
Bull Case (~65–70%): Hold $72.5k+ BTC / $2.1k+ ETH → grind to $74k / $2.2k with ETF inflows continuing
Pullback Case (~30%): Healthy 3–6% shakeout to test support → aggressive buy zone if volume strong
Bear Trap Case (low probability): Fakeout below $71k → rapid reversal squeeze higher
Key Watch: ETF flows, US macro leaks, altcoin volume rotation, sentiment spikes
8. Community Discussion & Strategy Playbook
Are you scaling in or trimming profits here?
Top 3–5 alt picks for next 15–40% leg?
Overnight risk: spot hold, hedged perps, or de-risking?
BTC target by end-March / Q2?
Share TA screenshots, on-chain analysis, and macro notes
Reminder: Collective community alpha is critical in volatile markets; top threads will be reposted for crowd visibility.
🚨 Gate Square 1. Overall Market Trend & Macro Context
The crypto market is experiencing a powerful, broad-based rally, erasing most of the recent fear-induced drawdowns. The total market cap now hovers around $2.46T–$2.53T, up 5–7% in the past 24 hours, while 24h trading volume has exploded to $150–$160B (+30–37%).
Macro Drivers:
Institutional flows: Spot BTC and ETH ETFs are resuming inflows (hundreds of millions daily), signaling structural demand.
Whale activity: Large holders (100–10k+ BTC) continue accumulation; long-term holder supply rising.
Technical breakout: Weak hands and leveraged shorts flushed, momentum accelerating.
Macro tailwinds: DXY softening, equities stable, gold steady, soft-landing narrative intact.
Geopolitical relief: Less tension in global hotspots → improved risk appetite.
Sentiment Shifts:
Crypto Fear & Greed Index jumped from extreme fear (~19–22) to neutral/greed (~45–55).
Social chatter on X, Telegram, and Gate Square dominated by “buy-the-dip reversal,” “BTC breakout,” and “ETH reclaiming $2,100.”
Altcoins rotation increasing; mid- and small-cap tokens seeing inflows → healthy broad participation.
2. Bitcoin (BTC) – Full Technical + On-Chain + Flow Analysis
Live Price: ~$72,745–$73,700 (+6.5–7.5% 24h)
Immediate Resistance: $73,500–$74,000 (previous swing highs + Fibonacci 0.618–0.786)
Support: $71,500–$71,000 (high-volume node + EMAs 50/100h)
Macro Floor: $69,800–$70,000 (200-day EMA + weekly pivot)
Bear Trap Zone: $67,500–$68,000 → accumulation likely
Technical Indicators:
RSI (14, 4H/Daily): 68–72 → bullish momentum but near overbought → short-term 2–4% pullback possible
MACD: Strong bullish cross, histogram expanding → momentum continuation
Bollinger Bands: Price hugging upper band, volatility expansion → breakout continuation
Volume Profile: Heavy buy clusters $70k–$72k support floor
On-Chain & Flow Insights:
Whales adding aggressively, LTH supply increasing
Exchange outflows negative, coins moving to cold storage
Spot BTC ETF inflows: multi-hundred-million daily → structural accumulation
Funding rates: Positive but not extreme → short squeeze potential remains
Observation: BTC printed a fresh higher high above $72k, showing strong short-term bullish trend, but momentum needs confirmation via daily higher lows.
3. Ethereum (ETH) – Technical + Fundamental Analysis
Live Price: ~$2,124 (+7–8% 24h)
Resistance: $2,175–$2,200 (prior supply + Fib extension)
Immediate Support: $2,080–$2,050
Stronger Floor: $1,980–$2,000
Technical:
RSI (14, 4H): 65–70 → bullish, more room than BTC
MACD: Bullish crossover confirmed, building momentum
ETH/BTC ratio: ~0.029–0.0295 → ETH may outperform if BTC consolidates
Fundamentals Driving ETH:
L2 TVL & daily active users rebounding
DeFi activity increasing, staking participation high, validator count stable
Spot ETH ETF inflows positive (+$30–50M net/day)
BTC → ETH profit rotation visible in perp volume spikes
4. Altcoins & Sector Rotation
Layer-1s: SOL +8–10% ($80–$85 holding, breakout to $95–$100 possible), AVAX +7–9%, NEAR +7%
Exchange tokens: BNB +7–9% ($600+)
DeFi/L2: MATIC, ARB, OP +10–20%
Memes/high-beta: Intraday 20–50% swings
Observation: Capital is rotating from BTC/ETH profits → altcoins, confirming healthy risk-on sentiment. Mid-cap projects with utility are seeing outsized inflows. BTC dominance softening below 59% → altseason acceleration possible.
5. Trend Confirmation Checklist
To confirm new bullish trend:
Multiple higher highs/lows daily & weekly across BTC, ETH, major alts
Sustained volume >$130–150B for 4–7 days
BTC dominance softening as altcoins catch up
No macro/regulatory black swans (FOMC surprises, SEC, geopolitical flare)
Potential Price Path:
BTC: $75k–$78k
ETH: $2,300+
6. Positioning & Risk Management Strategy
Scalpers (1–4h): Ride intraday swings, tight stops 0.5–1% below support, target 1–3% moves, R:R ≥1:2.5
Swing / Mid-term (daily–weekly): Core longs above $71k/$2.05k, scale-in on dips, trail with 4H EMA
Risk Rules: ≤2–5% per position, leverage ≤10–15x, partial profit-taking 30–50%, cash buffer 20–30%
7. Tomorrow & Weekend Outlook
Bull Case (~65–70%): Hold $72.5k+ BTC / $2.1k+ ETH → grind to $74k / $2.2k with ETF inflows continuing
Pullback Case (~30%): Healthy 3–6% shakeout to test support → aggressive buy zone if volume strong
Bear Trap Case (low probability): Fakeout below $71k → rapid reversal squeeze higher
Key Watch: ETF flows, US macro leaks, altcoin volume rotation, sentiment spikes
8. Community Discussion & Strategy Playbook
Are you scaling in or trimming profits here?
Top 3–5 alt picks for next 15–40% leg?
Overnight risk: spot hold, hedged perps, or de-risking?
BTC target by end-March / Q2?
Share TA screenshots, on-chain analysis, and macro notes
Reminder: Collective community alpha is critical in volatile markets; top threads will be reposted for crowd visibility.