Trade
Basic
Futures
Futures
Hundreds of contracts settled in USDT or BTC
TradFi
Gold
Trade global traditional assets with USDT in one place
Options
Hot
Trade European-style vanilla options
Unified Account
Maximize your capital efficiency
Demo Trading
Futures Kickoff
Get prepared for your futures trading
Futures Events
Participate in events to win generous rewards
Demo Trading
Use virtual funds to experience risk-free trading
Earn
Launch
CandyDrop
Collect candies to earn airdrops
Launchpool
Quick staking, earn potential new tokens
HODLer Airdrop
Hold GT and get massive airdrops for free
Launchpad
Be early to the next big token project
Alpha Points
Trade on-chain assets and enjoy airdrop rewards!
Futures Points
Earn futures points and claim airdrop rewards
Investment
Simple Earn
Earn interests with idle tokens
Auto-Invest
Auto-invest on a regular basis
Dual Investment
Buy low and sell high to take profits from price fluctuations
Soft Staking
Earn rewards with flexible staking
Crypto Loan
0 Fees
Pledge one crypto to borrow another
Lending Center
One-stop lending hub
VIP Wealth Hub
Customized wealth management empowers your assets growth
Private Wealth Management
Customized asset management to grow your digital assets
Quant Fund
Top asset management team helps you profit without hassle
Staking
Stake cryptos to earn in PoS products
Smart Leverage
New
No forced liquidation before maturity, worry-free leveraged gains
GUSD Minting
Use USDT/USDC to mint GUSD for treasury-level yields
More
UBCLUB2133
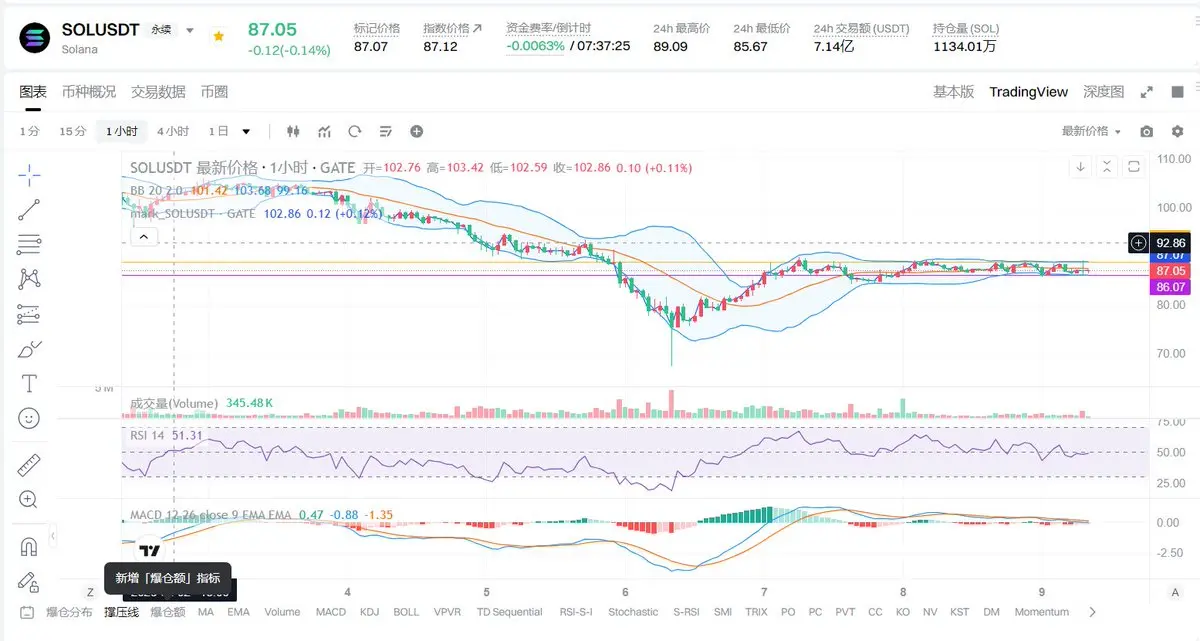
The hourly channel of SOL is becoming increasingly narrow, and a trend reversal is imminent.
SOL-1,02%
- Reward
- like
- Comment
- Repost
- Share
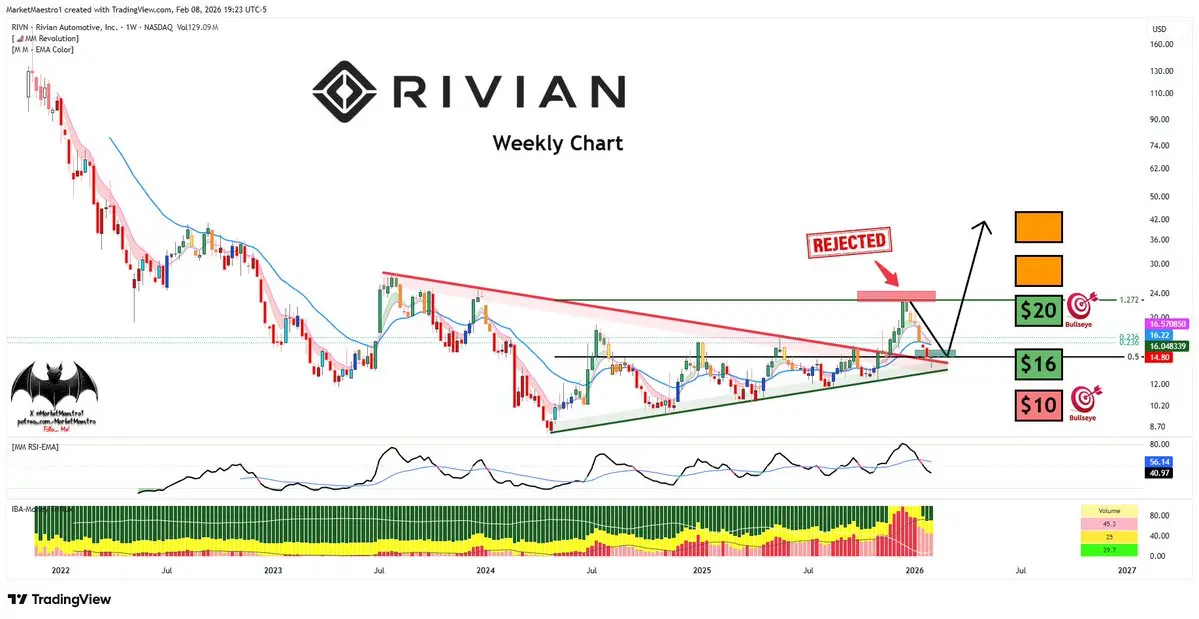
$RIVNthe most annoying stock in the world. It dropped all the way back to a retest of the red resistance it broke before. Now it needs to turn from here 🤞
- Reward
- 1
- Comment
- Repost
- Share
People watching the NFL half time show in Spanish rn
- Reward
- like
- Comment
- Repost
- Share
多军必胜
多军必胜
Created By@XiaofengTraversesBullAndBear
Listing Progress
0.00%
MC:
$2.44K
Create My Token
Early Monday, both cryptocurrencies and gold and silver rose. Gold and silver went up, then continued to push cryptocurrencies higher. A little more upward movement and then a pullback. The same bullish trend. Precious metals are much smoother, with large sums of hot money flowing into precious metals🥹
View Original
- Reward
- like
- Comment
- Repost
- Share
$BTC $XRP $SOL
Bitcoin hasn't stabilized around 7.55 yet, so there will definitely be another wave of pullback! Everyone can consider positioning around 6.66 for spot trading, build positions at 6.33 and 6, then wait patiently for the bloom! No matter how much it crashes later, as long as you hold on, you are the winner👌🏻HLVAEX6I
View OriginalBitcoin hasn't stabilized around 7.55 yet, so there will definitely be another wave of pullback! Everyone can consider positioning around 6.66 for spot trading, build positions at 6.33 and 6, then wait patiently for the bloom! No matter how much it crashes later, as long as you hold on, you are the winner👌🏻HLVAEX6I

- Reward
- 1
- Comment
- Repost
- Share
The halftime show for those who tuned out bad bunny
- Reward
- like
- Comment
- Repost
- Share
Viewing the Top Market Coins Spot Chart and comparing them
1.293
- Reward
- 2
- Comment
- Repost
- Share
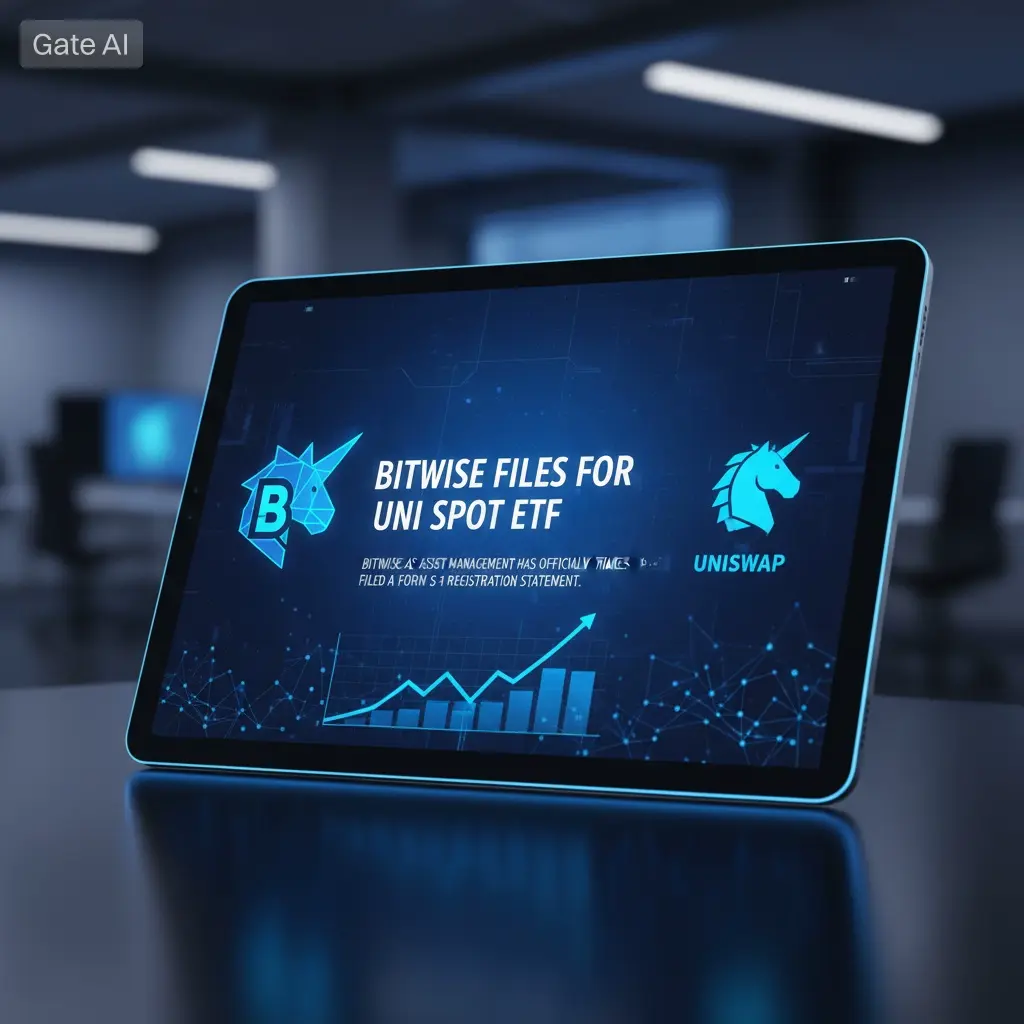
#BitwiseFilesforUNISpotETF Institutional Access to DeFi Takes a Major Step
Bitwise Asset Management has officially filed a Form S-1 registration statement with the U.S. Securities and Exchange Commission to launch a proposed spot exchange-traded fund linked to the Uniswap (UNI) token. If approved, the Bitwise Uniswap ETF would hold UNI directly, offering investors regulated exposure to one of the most influential decentralized finance governance tokens. This filing represents a potentially historic expansion of institutional crypto products beyond Bitcoin and Ethereum into the DeFi sector.
Wha
- Reward
- 3
- 2
- Repost
- Share
MasterChuTheOldDemonMasterChu :
:
2026 Go Go Go 👊View More
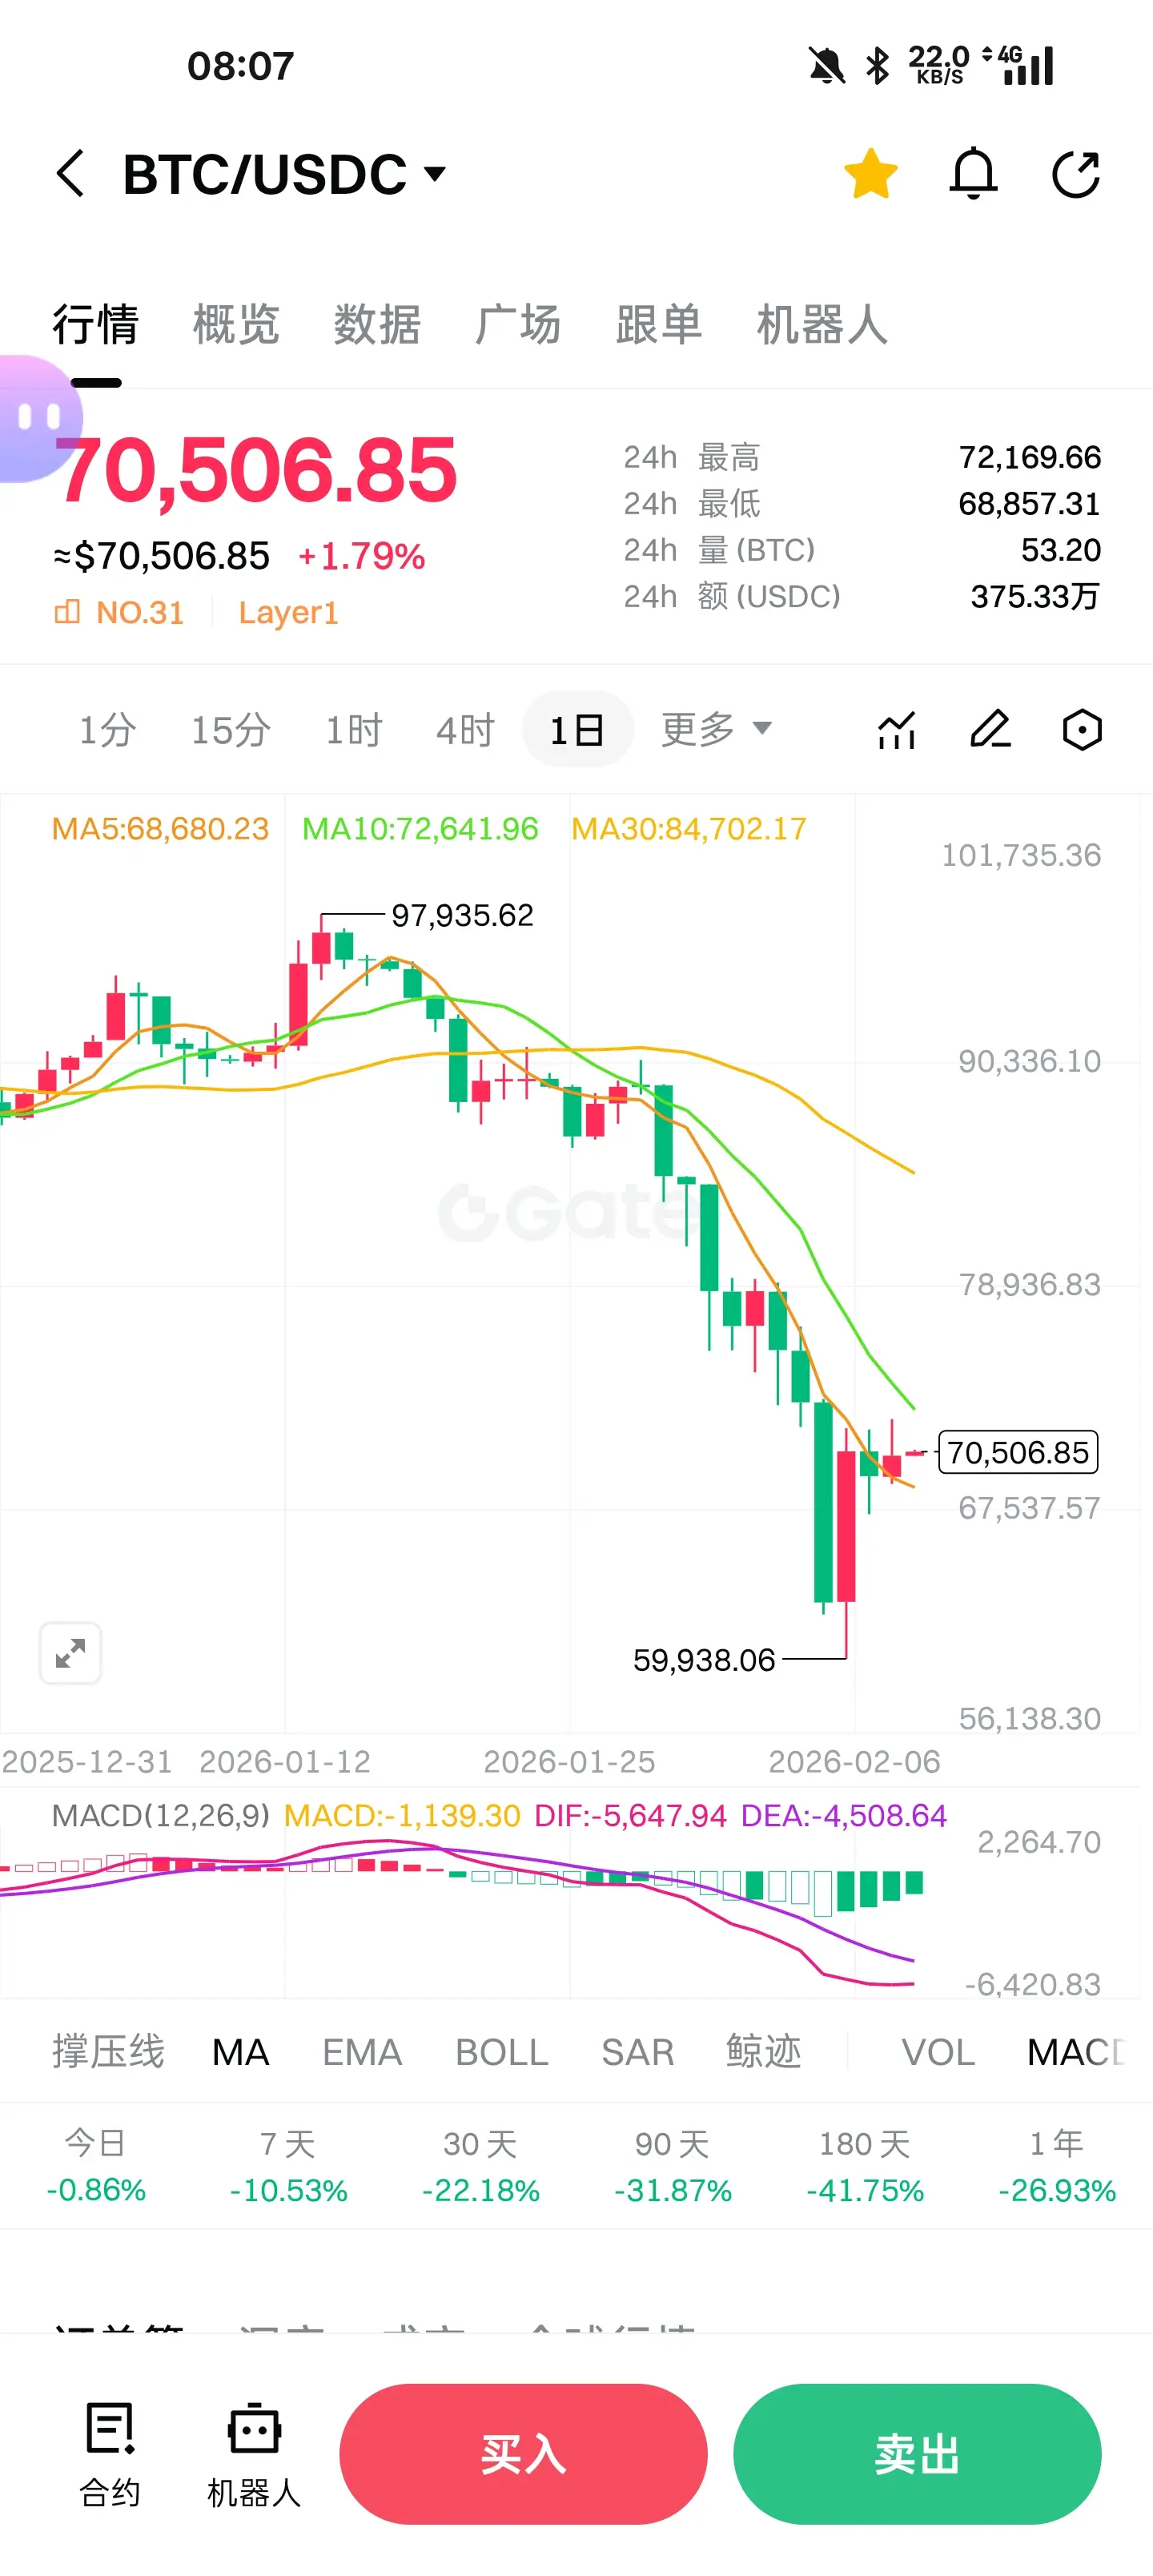
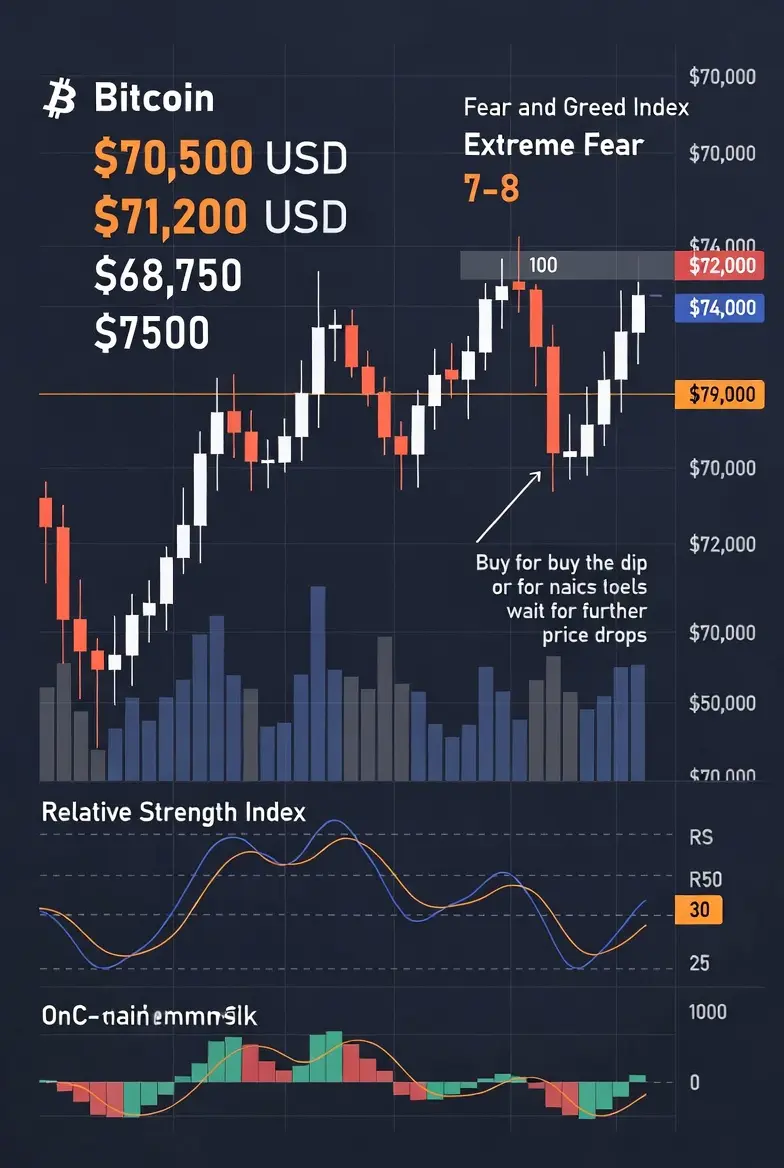
#BuyTheDipOrWaitNow? Bitcoin’s price remains stuck in a tight zone near $70,600–$71,100, showing mild upward momentum but still consolidating in the low-to-mid $70k range. In the last 24 hours the price swung between roughly $68,750 and $71,500, showing continued volatility. While there’s a small recovery from recent weekend lows, the price has not yet made a clean breakout above key resistance. Over the past week, Bitcoin has fallen roughly 10–15%, reflecting a broader corrective phase following the strong run earlier in the cycle. Trading volume remains elevated — driven by fear-based sellin
BTC1,54%

- Reward
- 4
- 4
- Repost
- Share
MingDragonX:
2026 GOGOGO 👊View More
Congratulations to the brothers who placed orders at the specified levels yesterday, capturing around 120 points of big gains on both long and short sides.
(Note: The 2091 long and 2152 short orders reached their respective first take-profit levels.)
View Original(Note: The 2091 long and 2152 short orders reached their respective first take-profit levels.)


- Reward
- like
- 2
- Repost
- Share
IDon'tHaveMuchWithHim. :
:
Waiting for your strategy today, 😀 Let's work together to achieve our goals efficiently and effectively!View More
Check out Gate and join me in the hottest event! https://www.gate.com/id/campaigns/3867?ref=VLNHUVXEAQ&ref_type=132
- Reward
- like
- Comment
- Repost
- Share
Check out Gate and join me in the hottest event! https://www.gate.com/campaigns/4-gold-lucky-draw?ch=821&ref=UgMXU15Z&ref_type=132
- Reward
- 3
- 2
- Repost
- Share
MrFlower_ :
:
2026 GOGOGO 👊View More
汗血宝马
汗血宝马
Created By@gatefunuser_22b1
Listing Progress
100.00%
MC:
$8.42K
Create My Token
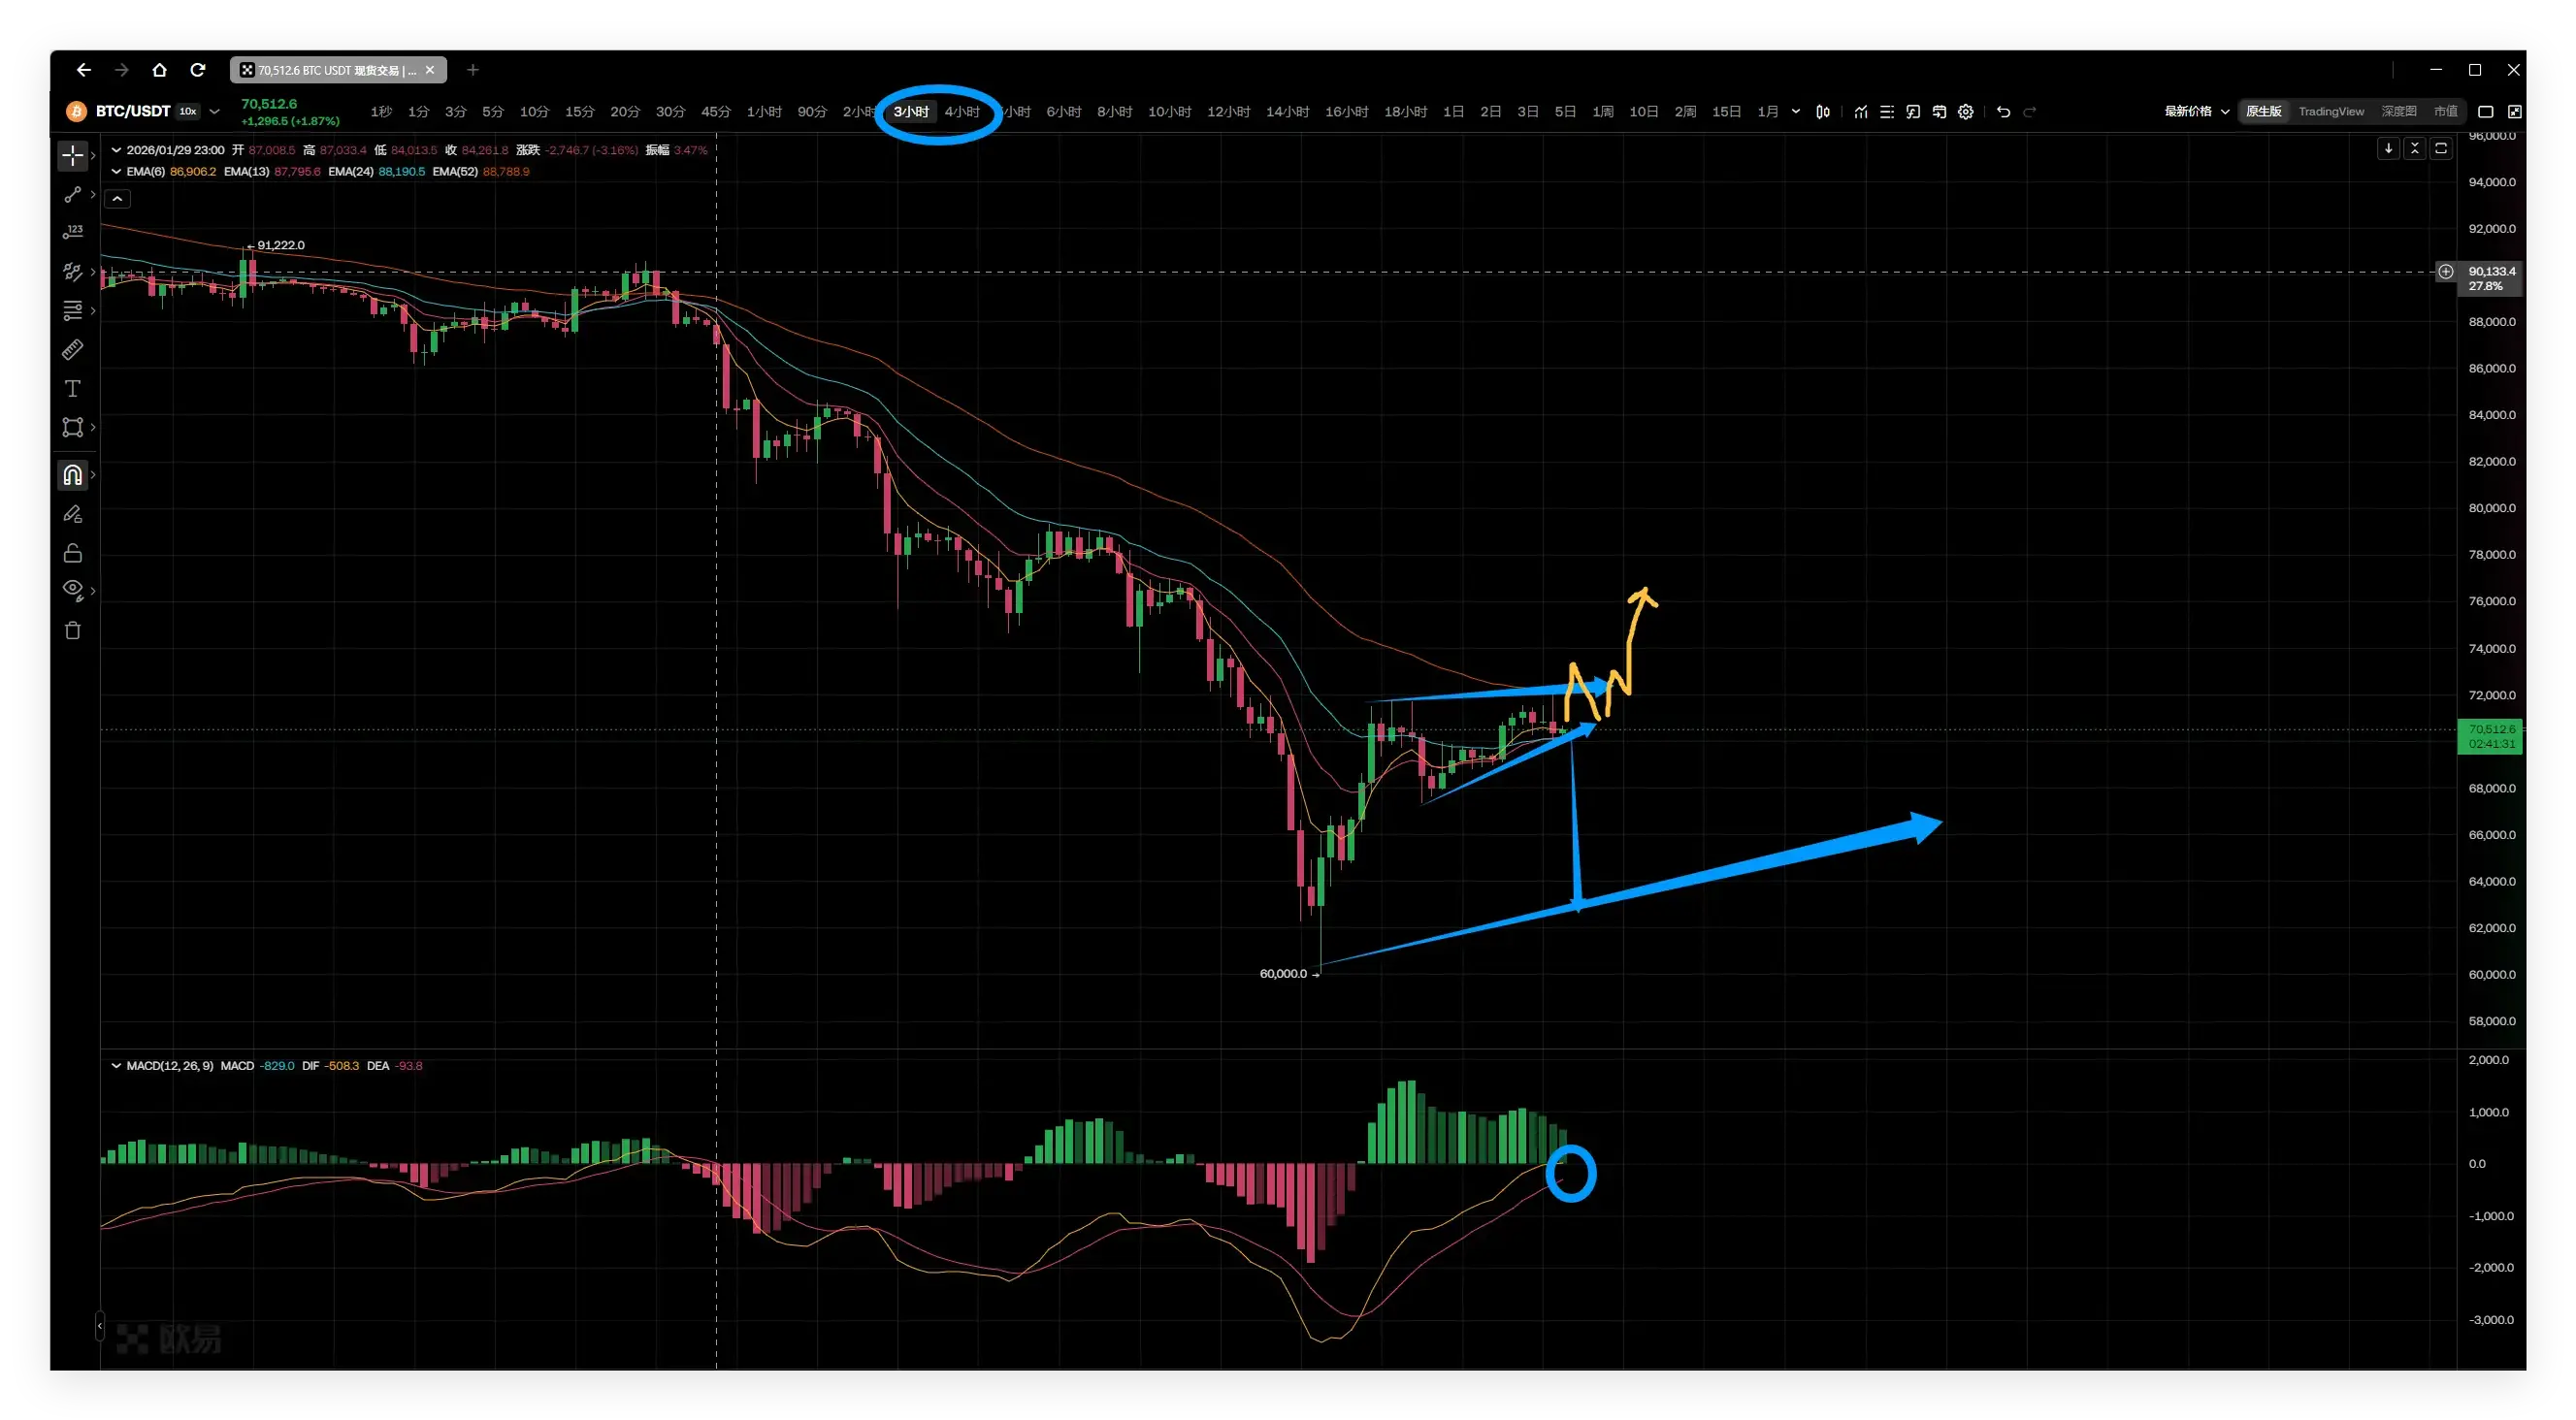
Bitcoin Market Analysis from February 1-9: During the day, pay attention to potential market traps. Currently, the market is positioned at a 3-hour resistance level and is also on the zero line of the 3-hour indicator, so there is no rapid and effective upward movement. Watch for a 3-4 hour rebound. Given the current larger timeframe, the overall bearish trend still exists. Remember not to lose sight of the trend direction due to a temporary rebound. #比特币 #BTC Everyone, remember to follow us. Once followers reach 500, I will do a live stream sharing how to succeed at the turning points of t
BTC1,54%
- Reward
- like
- Comment
- Repost
- Share
Sleeping order with an entry at 72200, currently with a profit of 2000 points. You can reduce the position to lock in the profit or directly take profit.
View Original
- Reward
- 1
- Comment
- Repost
- Share
SOL 72 hours of full liquidity below!
View Original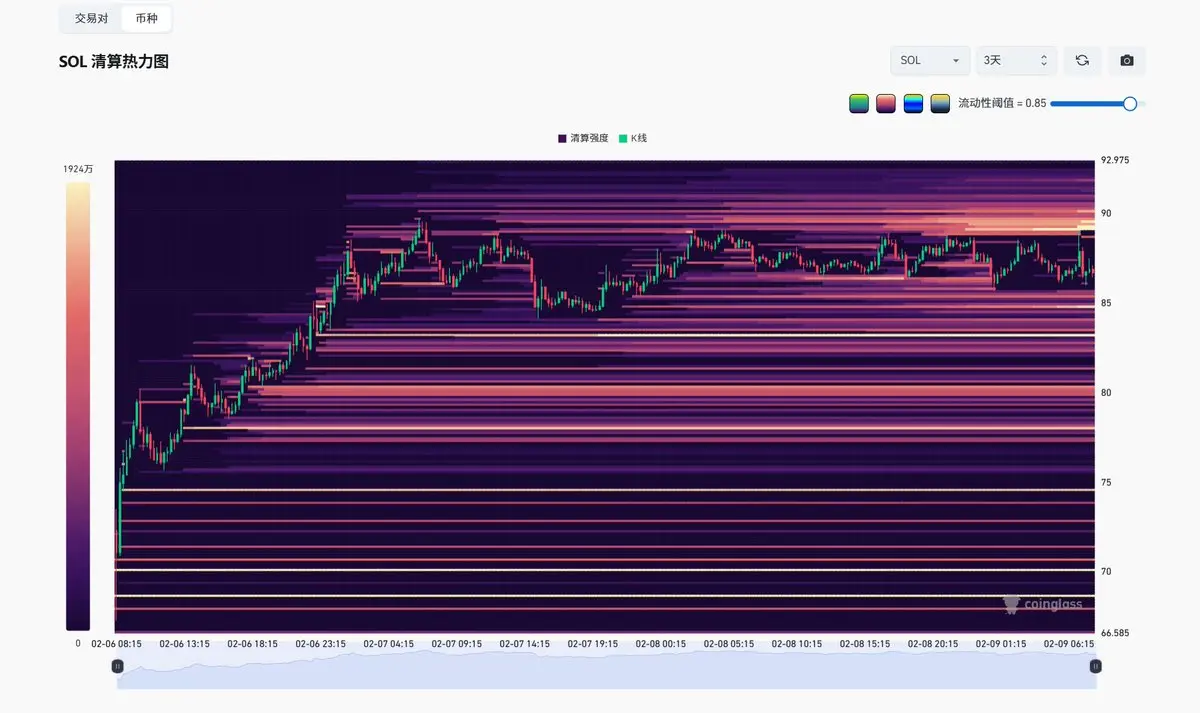
- Reward
- like
- Comment
- Repost
- Share
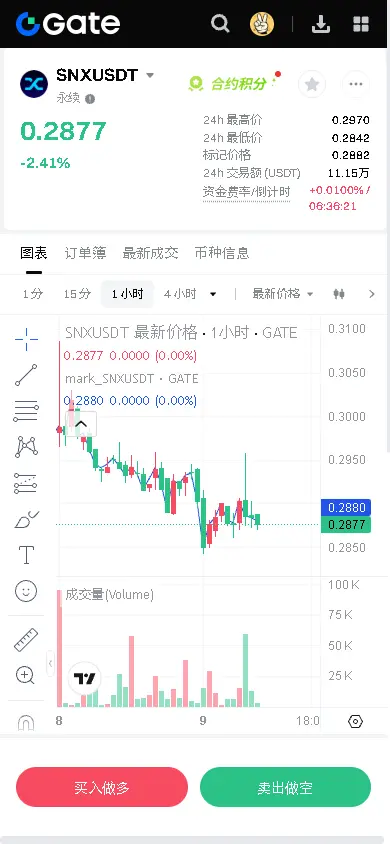
【$SNX Signal】No Position, Downtrend Continuation, Main Force Distributing
$SNX Price decline accompanied by stable holding volume, indicating typical main force distribution rather than long liquidation. Continuous bearish candles on the 4H chart, buying strength (Buy/Sell Ratio < 0.5) remains weak, with Taker sell pressure dominating. Order book shows accumulation of sell orders above (0.29-0.30), sparse buy orders below, with no effective support. Negative funding rates have failed to attract bulls to counterattack, indicating a bearish market sentiment.
🎯 Direction: No Position
The curre
View Original$SNX Price decline accompanied by stable holding volume, indicating typical main force distribution rather than long liquidation. Continuous bearish candles on the 4H chart, buying strength (Buy/Sell Ratio < 0.5) remains weak, with Taker sell pressure dominating. Order book shows accumulation of sell orders above (0.29-0.30), sparse buy orders below, with no effective support. Negative funding rates have failed to attract bulls to counterattack, indicating a bearish market sentiment.
🎯 Direction: No Position
The curre
- Reward
- like
- Comment
- Repost
- Share
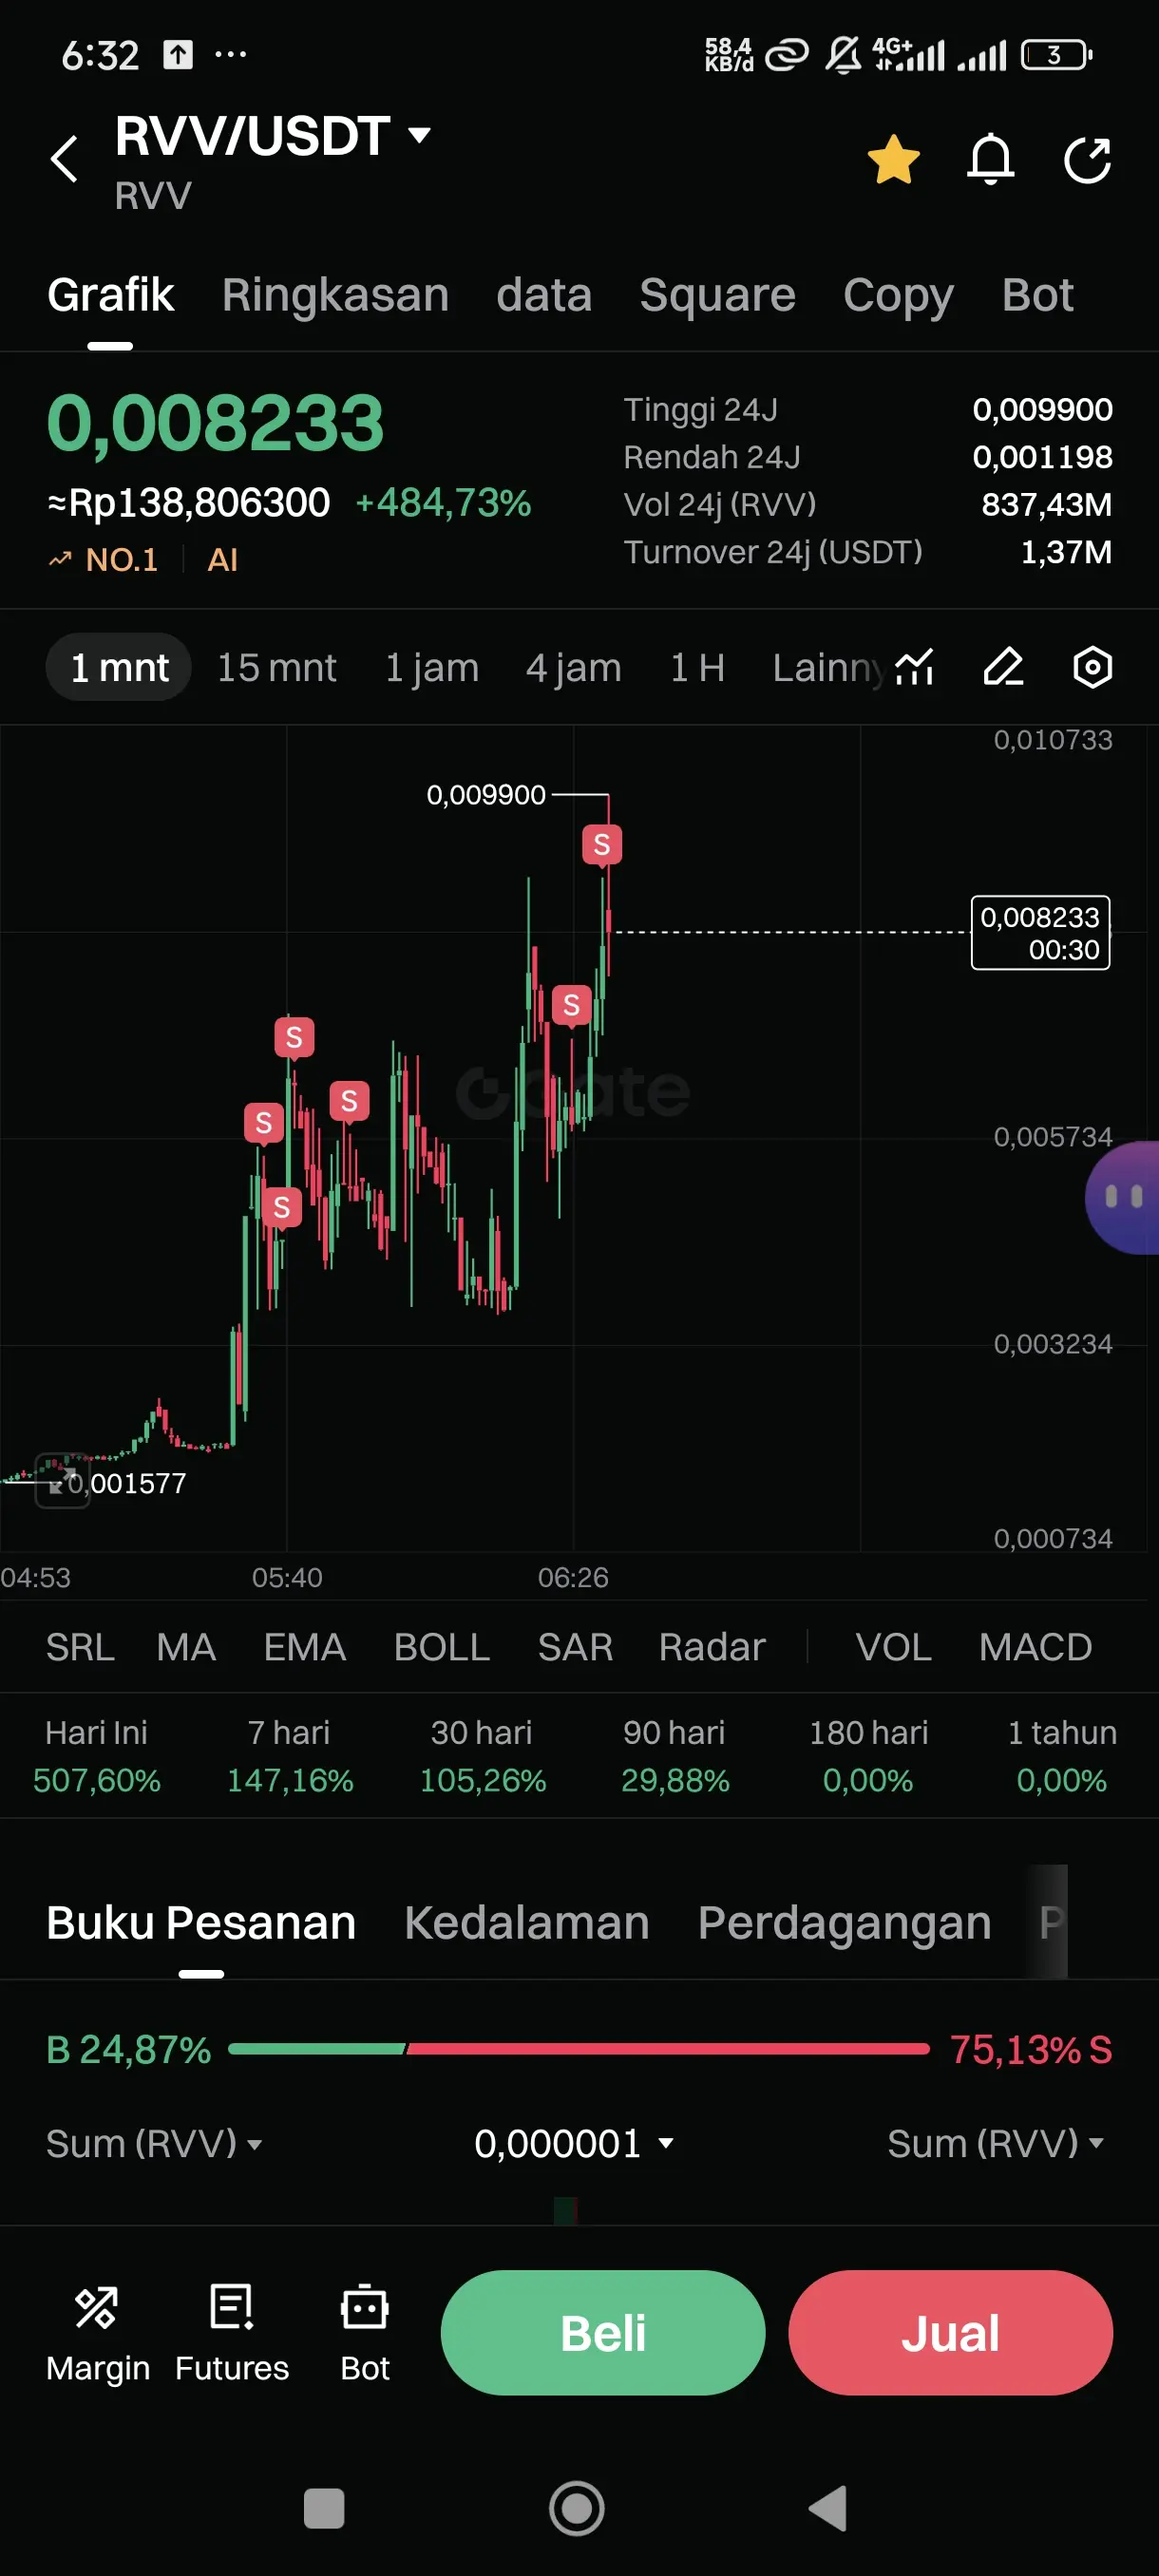
Top Coins Rising Against the Trend in a Weak Market
While the broader crypto market faces pressure and pullback, a few standout coins are showing unusual strength and resilience. These assets are moving against the trend — signaling strong narratives, active liquidity, and investor confidence.
Coins rising in a declining market often indicate:
• Strong fundamental developments
• Sector-specific hype or adoption
• Smart money accumulation
• Relative strength vs BTC dominance
Tracking these outperformers can reveal early opportunities before the wider market reversal begins.
In uncertain conditi
BTC1,54%


- Reward
- 1
- 2
- Repost
- Share
SheenCrypto:
Buy To Earn 💎View More
Live Trading and Learning with Chillzzz
1
- Reward
- like
- Comment
- Repost
- Share
$ETH Price Trend Analysis
1. Candlestick Patterns:
- Recent prices have been fluctuating between 2080 and 2150, showing a consolidation at high levels.
- A rebound occurred after a sharp decline earlier, but the rebound strength has weakened, forming long upper shadows and small real bodies on the candlesticks.
2. Technical Indicators:
- MACD: In the 4-hour cycle, the MACD histogram has shifted from red to green, with DIF and DEA still in negative territory, indicating that the bearish momentum is dominant but showing signs of weakening.
- RSI: The RSI14 value is 47.84, not entering ove
View Original1. Candlestick Patterns:
- Recent prices have been fluctuating between 2080 and 2150, showing a consolidation at high levels.
- A rebound occurred after a sharp decline earlier, but the rebound strength has weakened, forming long upper shadows and small real bodies on the candlesticks.
2. Technical Indicators:
- MACD: In the 4-hour cycle, the MACD histogram has shifted from red to green, with DIF and DEA still in negative territory, indicating that the bearish momentum is dominant but showing signs of weakening.
- RSI: The RSI14 value is 47.84, not entering ove

- Reward
- like
- Comment
- Repost
- Share
- Reward
- like
- 1
- Repost
- Share
Lord,PleaseEnsureTheOld :
:
Are you difficult to reach?Load More
Join 40M users in our growing community
⚡️ Join 40M users in the crypto craze discussion
💬 Engage with your favorite top creators
👍 See what interests you
Trending Topics
View More170.86K Popularity
23.59K Popularity
396.27K Popularity
10.43K Popularity
20.84K Popularity
Hot Gate Fun
View More- MC:$2.44KHolders:20.00%
- MC:$2.44KHolders:20.00%
- MC:$0.1Holders:10.00%
- MC:$2.42KHolders:10.00%
- MC:$0.1Holders:10.00%
News
View MoreNew Wallet Purchases 47.6M WLFI Tokens for 10M USDC
6 m
HYPE (Hyperliquid) increased by 4.45% over the past 24 hours, currently trading at $33.03.
9 m
Infini hacker today transferred 15,470 ETH through Tornado Cash, with a total value of approximately $32.58 million.
13 m
Solana (SOL) is currently priced at $87.22, with a market capitalization of approximately $49.487 billion.
14 m
XRP (XRP) is currently trading at $1.43, with a market capitalization of approximately $87.364 billion.
14 m
Pin