#BitcoinSupportAndResistanceAnalysis
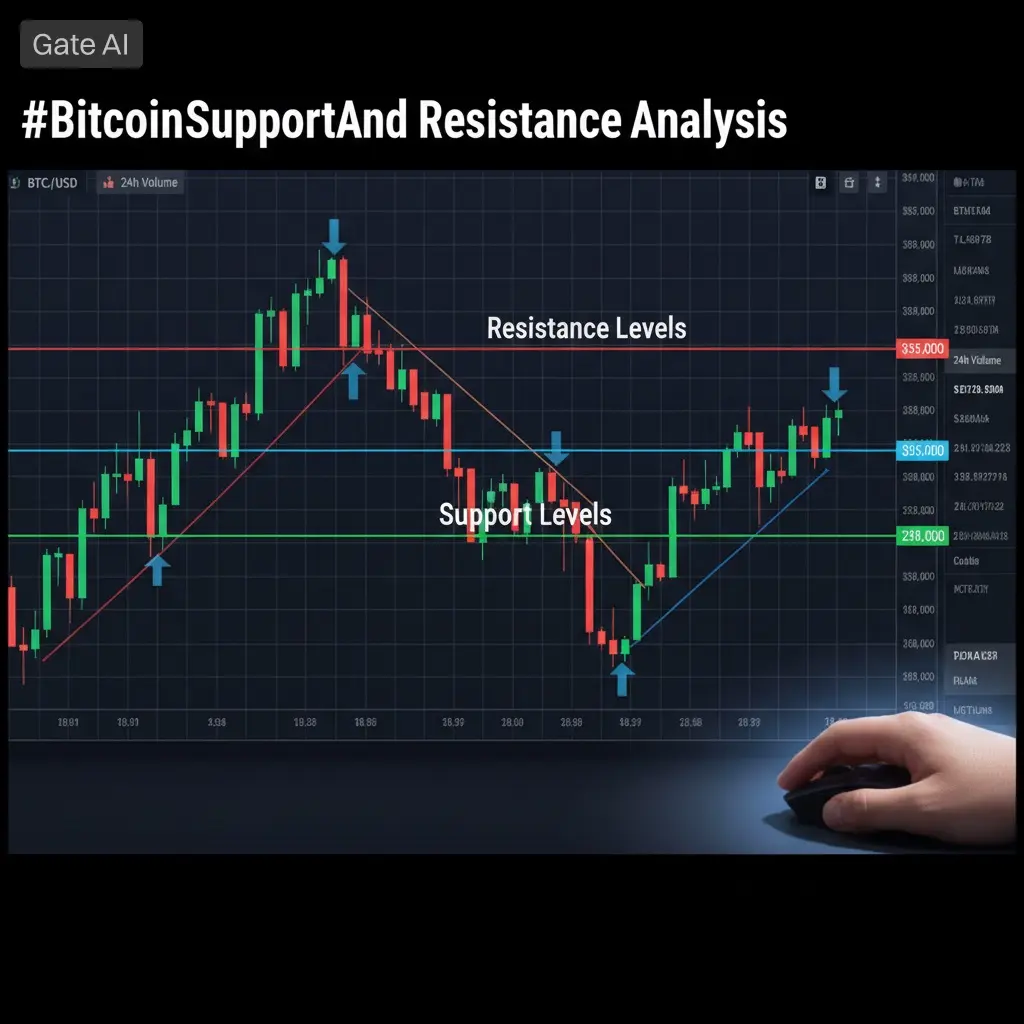
#Bitcoin Support and Resistance Analysis (March 22, 2026) What to Expect Next
As of today, Bitcoin is not making random moves; it is compressing energy within a defined range. This compression means the market is taking a pause neither trending strongly upward nor breaking sharply downwar but quietly building tension. In markets, compression almost always leads to expansion: after a period of sideways consolidation, a significant directional move tends to follow. The key question now is which way that expansion will happen.
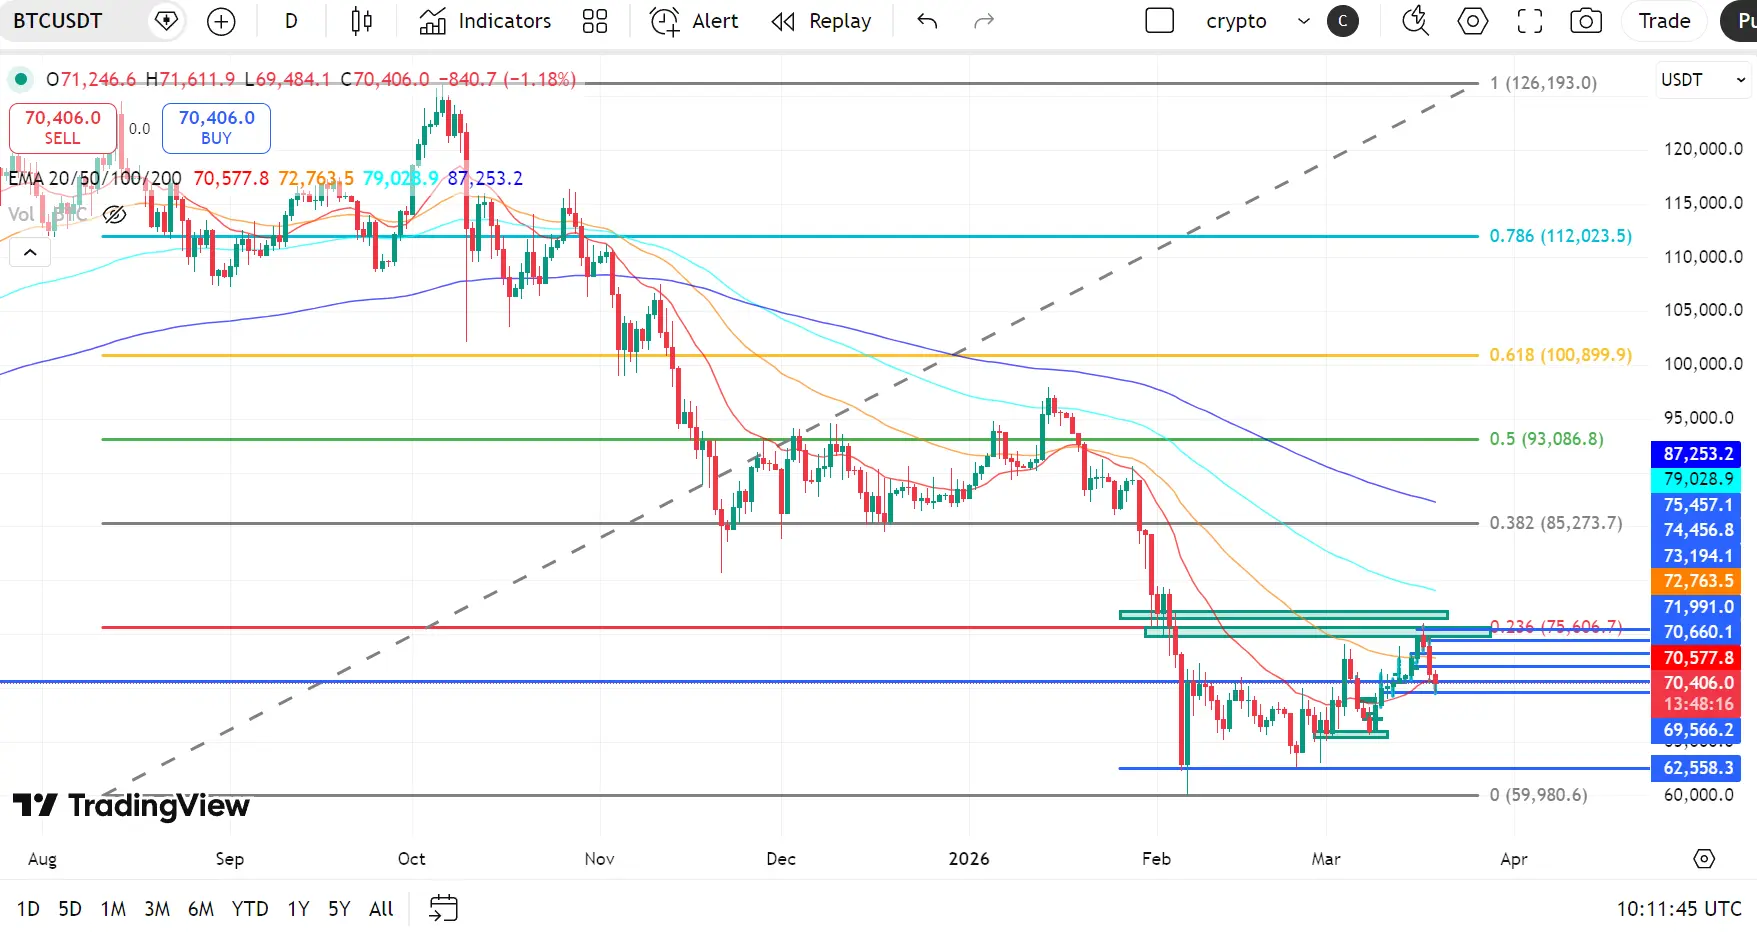
At the current price level around $70,000, the market is sitting in what traders call a decision zone. This means that neither buyers nor sellers have taken full control yet. Instead, the market is being shaped by positioning, order flow, and liquidity dynamics. In simple terms, the market is no longer about immediate direction; it is about who gets caught off guard first.
Market Context What is Really Happening
Right now, Bitcoin is not in a clear uptrend or downtrend. Instead, it is moving sideways within a range, creating frustration for traders who are looking for clear signals. In this neutral zone:
Retail traders often enter and exit too early
Large, disciplined traders accumulate or reduce positions quietly
Stop orders and liquidity clusters build above and below price
Short-term volatility spikes without strong directional continuation
This range is where weak conviction gets exposed, and only traders with patience tend to perform well.
Most losses in these phases occur not at breakout points, but before the breakout, as traders mis-time entries or react emotionally to price swings.
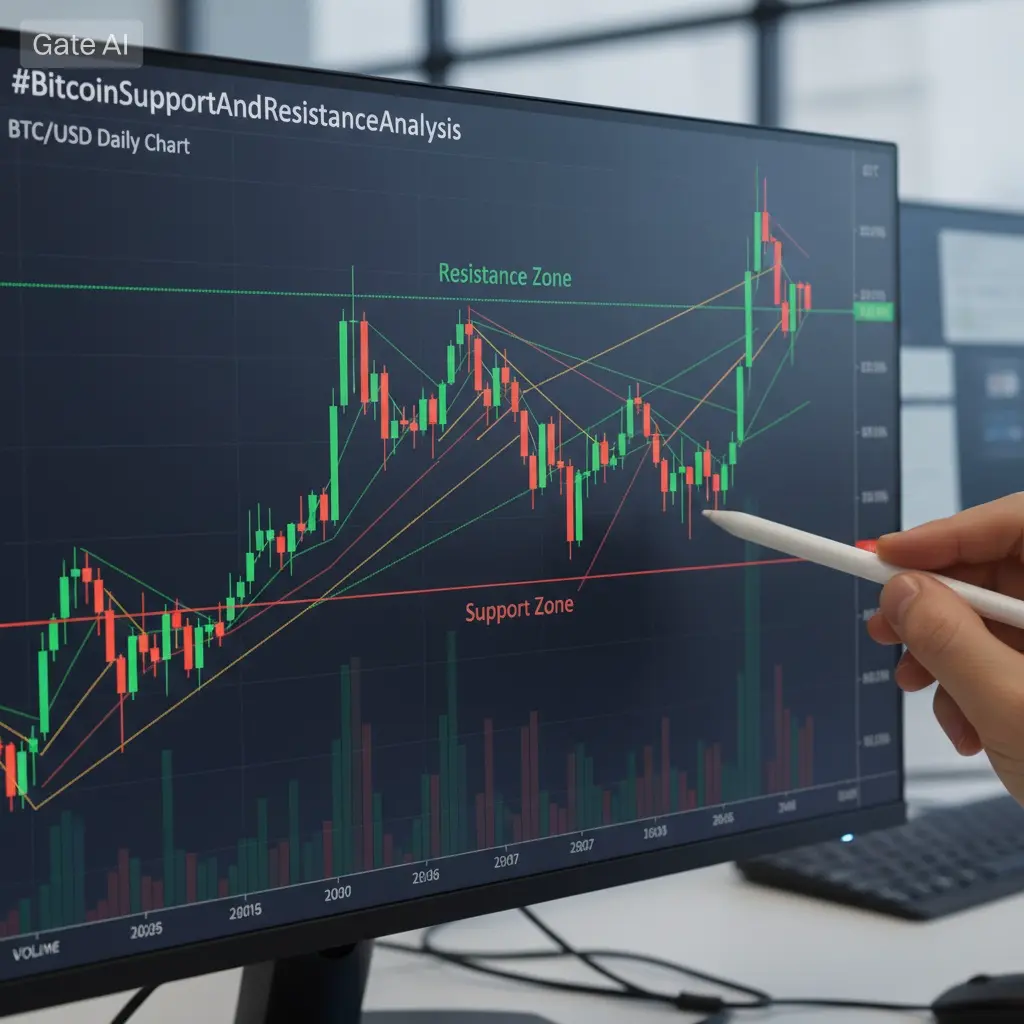
Major Support Levels Where the Market Might Hold
These support zones are areas where buyers have historically shown interest and may step in again:
$69,800 – $70,000
This is the immediate support area. Price is currently testing this zone repeatedly. If it holds, it means bulls are defending this level and buyers remain present.
$68,900
Previously, buyers showed strength at this level, so it is still meaningful. If price revisits here, reactions could occur but a bounce here does not guarantee a bottom.
$67,800 – $68,200
This deeper support range represents the next structural level. If price reaches this zone, the narrative shifts from “minor pullback” to a potential deeper retracement.
$66,500 and below
This is a more bearish threshold. A sustained break below this level would indicate loss of recent bullish structure and could lead to a broader downside phase.
Major Resistance Levels — Where Supply Is Strong
These resistance zones represent areas where sellers have shown pressure in the past:
$70,800
This is the near-term resistance zone. Price has struggled to maintain above this level, suggesting hesitance from bulls.
$71,500
This is the key breakout trigger level. If Bitcoin breaks above this with conviction and volume, short-term structure turns bullish and momentum increases. A break here can trigger fresh buying and open the path toward higher targets.
$73,000 – $73,500
This is a medium-term resistance area where sellers have previously dominated price reactions. The market will test whether selling pressure still exists at these levels.
$75,000 and above
This is a major macro resistance area. Breaking above this would revalidate broad bullish control and increase confidence in continued upward expansion.
Volume Insights Why This Matters
The drop from higher price levels earlier has been accompanied by strong volume, suggesting distribution where larger holders reduce positions. The current consolidation phase, however, is occurring on low volume.
Low volume during a sideways range means:
Traders are waiting for a signal before committing
Market participants are cautious rather than aggressive
Liquidity is building, but not yet being consumed
This sets the stage for a strong move once a breakout direction becomes clear. High volume expanding along with price movement is the confirmation traders look for when judging whether the breakout or breakdown is real.
Liquidity Landscape What Price Moves Toward
In market structure, prices tend to move toward clusters of liquidity:
Above the current range, there are stop orders from short traders and orders from breakout players looking to buy
Below the range, there are stop losses from long traders and potential panic sales
The market does not move randomly; it first targets areas where orders are stacked. The side that gets activated first often determines the immediate directional move.
Bullish Scenario What Needs to Happen
For bulls to gain control and steer the market upward:
Bitcoin must hold above $70,000 support consistently
It must then break above $71,500 with strong volume
Once that breakout is confirmed, the next target becomes $73,000+
A clear move past $75,000 would validate a broader continuation of the uptrend
This scenario would suggest that buyers are stronger and that the market is ready to expand upward.
Bearish Scenario What Could Trigger Downside
For bears to take control and push price lower:
Bitcoin must break below $69,800 with conviction
A sustained move below $69,000 would break the immediate support
Lower targets would become $68,000 and $67,000 support ranges
A deeper reaction could unfold toward $66,500 or lower
This scenario would show weakening demand and give bears the momentum to push price downward.
Neutral and Smart Trading Strategy
This neutral range environment demands patience and clarity:
Avoid entering trades in the middle of the range, where signals are mixed
Only act when price decisively breaks above resistance or below support
Larger traders and institutions often wait for confirmation before increasing exposure
For smart traders, the edge is not in guessing direction, but in waiting for clear market structure confirmation.
Psychological Reality Why Traders Get Trapped
This phase psychologically frustrates many traders because:
Price swings appear directional but fail to sustain
Breakouts happen but quickly reverse
Impulsive traders lose capital by reacting early
The real advantage comes to those who remain patient and refrain from forcing trades.
Short‑Term Outlook What to Expect Next
In the immediate future:
The market is likely to remain in this range until a breakout or breakdown is confirmed
Breakout above $71,500 with volume signals upward expansion
Breakdown below $69,800 with volume signals downward expansion
Everything between these levels remains market noise
Final Thought The Key Edge
The most important insight today is this:
The market isn’t random it is waiting. The next big move will come when the range resolves.
The real edge is not in guessing which direction it will be; the edge is in waiting for confirmation before acting, while many others trade prematurely and get caught on the wrong side.
Whether you are a short-term trader or a longer-term investor, the discipline of waiting for clear structure and confirmation will always outperform emotion-based decisions in markets like this.
In the coming days, watch:
Break and hold above $71,500
Or break and hold below $69,800
These are the levels that will define Bitcoin’s next meaningful move.
#Bitcoin Support and Resistance Analysis (March 22, 2026) What to Expect Next
As of today, Bitcoin is not making random moves; it is compressing energy within a defined range. This compression means the market is taking a pause neither trending strongly upward nor breaking sharply downwar but quietly building tension. In markets, compression almost always leads to expansion: after a period of sideways consolidation, a significant directional move tends to follow. The key question now is which way that expansion will happen.
At the current price level around $70,000, the market is sitting in what traders call a decision zone. This means that neither buyers nor sellers have taken full control yet. Instead, the market is being shaped by positioning, order flow, and liquidity dynamics. In simple terms, the market is no longer about immediate direction; it is about who gets caught off guard first.
Market Context What is Really Happening
Right now, Bitcoin is not in a clear uptrend or downtrend. Instead, it is moving sideways within a range, creating frustration for traders who are looking for clear signals. In this neutral zone:
Retail traders often enter and exit too early
Large, disciplined traders accumulate or reduce positions quietly
Stop orders and liquidity clusters build above and below price
Short-term volatility spikes without strong directional continuation
This range is where weak conviction gets exposed, and only traders with patience tend to perform well.
Most losses in these phases occur not at breakout points, but before the breakout, as traders mis-time entries or react emotionally to price swings.
Major Support Levels Where the Market Might Hold
These support zones are areas where buyers have historically shown interest and may step in again:
$69,800 – $70,000
This is the immediate support area. Price is currently testing this zone repeatedly. If it holds, it means bulls are defending this level and buyers remain present.
$68,900
Previously, buyers showed strength at this level, so it is still meaningful. If price revisits here, reactions could occur but a bounce here does not guarantee a bottom.
$67,800 – $68,200
This deeper support range represents the next structural level. If price reaches this zone, the narrative shifts from “minor pullback” to a potential deeper retracement.
$66,500 and below
This is a more bearish threshold. A sustained break below this level would indicate loss of recent bullish structure and could lead to a broader downside phase.
Major Resistance Levels — Where Supply Is Strong
These resistance zones represent areas where sellers have shown pressure in the past:
$70,800
This is the near-term resistance zone. Price has struggled to maintain above this level, suggesting hesitance from bulls.
$71,500
This is the key breakout trigger level. If Bitcoin breaks above this with conviction and volume, short-term structure turns bullish and momentum increases. A break here can trigger fresh buying and open the path toward higher targets.
$73,000 – $73,500
This is a medium-term resistance area where sellers have previously dominated price reactions. The market will test whether selling pressure still exists at these levels.
$75,000 and above
This is a major macro resistance area. Breaking above this would revalidate broad bullish control and increase confidence in continued upward expansion.
Volume Insights Why This Matters
The drop from higher price levels earlier has been accompanied by strong volume, suggesting distribution where larger holders reduce positions. The current consolidation phase, however, is occurring on low volume.
Low volume during a sideways range means:
Traders are waiting for a signal before committing
Market participants are cautious rather than aggressive
Liquidity is building, but not yet being consumed
This sets the stage for a strong move once a breakout direction becomes clear. High volume expanding along with price movement is the confirmation traders look for when judging whether the breakout or breakdown is real.
Liquidity Landscape What Price Moves Toward
In market structure, prices tend to move toward clusters of liquidity:
Above the current range, there are stop orders from short traders and orders from breakout players looking to buy
Below the range, there are stop losses from long traders and potential panic sales
The market does not move randomly; it first targets areas where orders are stacked. The side that gets activated first often determines the immediate directional move.
Bullish Scenario What Needs to Happen
For bulls to gain control and steer the market upward:
Bitcoin must hold above $70,000 support consistently
It must then break above $71,500 with strong volume
Once that breakout is confirmed, the next target becomes $73,000+
A clear move past $75,000 would validate a broader continuation of the uptrend
This scenario would suggest that buyers are stronger and that the market is ready to expand upward.
Bearish Scenario What Could Trigger Downside
For bears to take control and push price lower:
Bitcoin must break below $69,800 with conviction
A sustained move below $69,000 would break the immediate support
Lower targets would become $68,000 and $67,000 support ranges
A deeper reaction could unfold toward $66,500 or lower
This scenario would show weakening demand and give bears the momentum to push price downward.
Neutral and Smart Trading Strategy
This neutral range environment demands patience and clarity:
Avoid entering trades in the middle of the range, where signals are mixed
Only act when price decisively breaks above resistance or below support
Larger traders and institutions often wait for confirmation before increasing exposure
For smart traders, the edge is not in guessing direction, but in waiting for clear market structure confirmation.
Psychological Reality Why Traders Get Trapped
This phase psychologically frustrates many traders because:
Price swings appear directional but fail to sustain
Breakouts happen but quickly reverse
Impulsive traders lose capital by reacting early
The real advantage comes to those who remain patient and refrain from forcing trades.
Short‑Term Outlook What to Expect Next
In the immediate future:
The market is likely to remain in this range until a breakout or breakdown is confirmed
Breakout above $71,500 with volume signals upward expansion
Breakdown below $69,800 with volume signals downward expansion
Everything between these levels remains market noise
Final Thought The Key Edge
The most important insight today is this:
The market isn’t random it is waiting. The next big move will come when the range resolves.
The real edge is not in guessing which direction it will be; the edge is in waiting for confirmation before acting, while many others trade prematurely and get caught on the wrong side.
Whether you are a short-term trader or a longer-term investor, the discipline of waiting for clear structure and confirmation will always outperform emotion-based decisions in markets like this.
In the coming days, watch:
Break and hold above $71,500
Or break and hold below $69,800
These are the levels that will define Bitcoin’s next meaningful move.